|
|
市場調査レポート
商品コード
1182006
食品トレーサビリティの世界市場規模調査&予測:技術タイプ、ソフトウェア、エンドユーザー別、用途別、地域別分析、2022-2029年Global Food Traceability Market Size study & Forecast, by Material Technology Type, Software Type, by End User, by Application, and Regional Analysis, 2022-2029 |
||||||
|
|
|||||||
|
● お客様のご希望に応じて、既存データの加工や未掲載情報(例:国別セグメント)の追加などの対応が可能です。 詳細はお問い合わせください。 |
|||||||


| 食品トレーサビリティの世界市場規模調査&予測:技術タイプ、ソフトウェア、エンドユーザー別、用途別、地域別分析、2022-2029年 |
|
出版日: 2023年01月05日
発行: Bizwit Research & Consulting LLP
ページ情報: 英文
納期: 2~3営業日
|
- 全表示
- 概要
- 図表
- 目次
食品トレーサビリティは、サプライチェーンのすべての段階において、食品およびその原材料の動きを追跡するものです。
これには、食品と原材料の加工、流通、生産が含まれます。
食品トレーサビリティ市場は、食品媒介疾患の脅威の高まりや、予測期間中の食品媒介疾患に対するヘルスケア投資の増加といった要因から拡大しています。
2020年の世界保健機関によると、全世界で約6億人が食中毒に苦しんでいます。これらの病気の主な原因は、汚染された食品の摂取です。したがって、食品の安全性は大きな関心事となっており、食品トレーサビリティ市場の需要を急増させると推定されます。一方、食品トレーサビリティの技術的進歩や、食品の安全性を向上させるためのイニシアチブの高まりは、市場に有利な機会を生み出します。しかし、消費者の間で食品の安全性に関する懸念が高まっていることが、2022年から2029年の予測期間を通じて市場の成長を妨げています。
世界の食品トレーサビリティ市場調査のために考慮された主要地域は、アジア太平洋、北米、欧州、ラテンアメリカ、および世界のその他の地域が含まれています。北米は、最終用途産業からの需要の増加、需要、QD技術の採用などにより、収益の面で地域市場を独占しています。一方、アジア太平洋地域は、電子機器需要の増加、電子機器への消費支出の増加、環境保護に関する政府規制の強化などの要因から、予測期間中に成長すると予想されています。
本調査の目的は、近年におけるさまざまなセグメントおよび国の市場規模を明らかにし、今後数年間の市場規模を予測することです。本レポートは、調査対象国における産業の質的・量的な側面を盛り込むよう設計されています。
また、市場の将来的な成長を規定する促進要因や課題などの重要な側面に関する詳細な情報も提供しています。さらに、主要企業の競合情勢や製品提供の詳細な分析とともに、利害関係者が投資するためのミクロ市場の潜在的な機会も組み込んでいます。
目次
第1章 エグゼクティブサマリー
- 市場スナップショット
- 世界・セグメント別市場の推定・予測、2019-2029年
- 食品トレーサビリティ市場、地域別、2019-2029年
- 食品トレーサビリティ市場:技術別、2019年~2029年
- 食品トレーサビリティ市場:ソフトウェア別、2019-2029年
- 食品トレーサビリティ市場:エンドユーザー別、2019-2029年
- 食品トレーサビリティ市場:用途別、2019-2029年
- 主な動向
- 調査手法の紹介
- 調査前提条件
第2章 食品トレーサビリティの世界市場の定義と範囲
- 調査の目的
- 市場の定義と範囲
- 調査対象範囲
- 産業の進化
- 調査対象年
- 通貨換算レート
第3章 世界の食品トレーサビリティ市場力学
- 食品トレーサビリティ市場の影響分析(2019-2029年)
- 市場促進要因
- 食中毒の脅威の高まり
- 食品由来疾患に対するヘルスケア投資の増加
- 市場の課題
- 消費者の間で高まっている食品の安全性に対する懸念
- 市場機会
- 食品トレーサビリティの技術的進歩
- 食品の安全性を向上させるためのイニシアチブの高まり
- 市場促進要因
第4章 世界の食品トレーサビリティ市場:産業分析
- ポーターの5フォースモデル
- 供給企業の交渉力
- 買い手の交渉力
- 新規参入業者の脅威
- 代替品の脅威
- 競争企業間の敵対関係
- ポーターの5フォースモデルへの未来的アプローチ(2019-2029年)
- PEST分析
- 政治的要因
- 経済的
- 社会的
- 技術的
- 投資採用モデル
- アナリストの結論・提言
- トップ投資機会
- 主要成功戦略
第5章 リスク評価:COVID-19の影響
- COVID-19が業界に与える全体的な影響の評価
- COVID-19以前とCOVID-19以後の市場シナリオ
第6章 世界の食品トレーサビリティ市場:技術別
- 市場スナップショット
- 食品トレーサビリティの世界市場:技術実績別-ポテンシャル分析
- 食品トレーサビリティの世界市場、技術別推定・予測2019-2029
- 食品トレーサビリティの世界市場、サブセグメント別分析
- RFID
- バーコード
- 赤外線
- バイオメトリクス
- GPS
第7章 食品トレーサビリティの世界市場:ソフトウェア別
- 市場スナップショット
- 食品トレーサビリティの世界市場:ソフトウェア別、パフォーマンス、ポテンシャル分析
- 食品トレーサビリティの世界市場、ソフトウェア別推定・予測2019-2029
- 食品トレーサビリティの世界市場、サブセグメント別分析
- ERP
- LIMS
- 倉庫
第8章 食品トレーサビリティの世界市場:エンドユーザー別
- 市場スナップショット
- 食品トレーサビリティの世界市場:エンドユーザー別、パフォーマンス、ポテンシャル分析
- 食品トレーサビリティの世界市場、エンドユーザー別推定・予測2019-2029
- 食品トレーサビリティの世界市場、サブセグメント分析
- 食品製造業
- 倉庫、輸送
- 小売業
- 政府機関
- その他
第9章 食品トレーサビリティの世界市場:用途別
- 市場スナップショット
- 食品トレーサビリティの世界市場:用途別実績-ポテンシャル分析
- 食品トレーサビリティの世界市場、用途別推定・予測2019-2029
- 食品トレーサビリティの世界市場、サブセグメント分析
- 生鮮食品
- 乳製品
- 飲料製品
- その他
第10章 食品トレーサビリティの世界市場:地域別分析
- 食品トレーサビリティの世界市場、地域別市場スナップショット
- 北米
- 米国
- 技術別の推定・予測、2019年~2029年
- ソフトウェア別の推定・予測、2019年~2029年
- エンドユーザー別の推定・予測(2019年~2029年
- 用途別の推定・予測、2019年~2029年
- カナダ
- 米国
- 欧州の食品トレーサビリティ市場スナップショット
- 英国
- ドイツ
- フランス
- スペイン
- イタリア
- その他の欧州地域
- アジア太平洋地域の食品トレーサビリティ市場のスナップショット
- 中国
- インド
- 日本
- オーストラリア
- 韓国
- その他アジア太平洋地域
- ラテンアメリカの食品トレーサビリティ市場のスナップショット
- ブラジル
- メキシコ
- 世界のその他の地域
第11章 競合情報
- トップ市場戦略
- 企業プロファイル
- C.H. Robinson(US)
- 主要情報
- 概要
- 財務情報(データの入手状況により異なります)
- 製品概要
- 最近の動向
- Bio-Rad Laboratories, Inc(US),
- OPTEL GROUP(Canada),
- Cognex(US),
- Honeywell International Inc.(US),
- SGS SA(Switzerland),
- Zebra Technologies(US),
- Bar Code Integrators(US),
- Carlisle(US),
- Merit-Trax(Canada),
- C.H. Robinson(US)
第12章 調査プロセス
- 調査プロセス
- データマイニング
- 分析
- 市場推定
- バリデーション
- 出版
- 調査属性
- 調査の前提条件
LIST OF TABLES
- TABLE 1. Global Food Traceability Market, report scope
- TABLE 2. Global Food Traceability Market estimates & forecasts by Region 2019-2029 (USD Billion)
- TABLE 3. Global Food Traceability Market estimates & forecasts by Technology 2019-2029 (USD Billion)
- TABLE 4. Global Food Traceability Market estimates & forecasts by Software 2019-2029 (USD Billion)
- TABLE 5. Global Food Traceability Market estimates & forecasts by End User 2019-2029 (USD Billion)
- TABLE 6. Global Food Traceability Market estimates & forecasts by Application 2019-2029 (USD Billion)
- TABLE 7. Global Food Traceability Market by segment, estimates & forecasts, 2019-2029 (USD Billion)
- TABLE 8. Global Food Traceability Market by region, estimates & forecasts, 2019-2029 (USD Billion)
- TABLE 9. Global Food Traceability Market by segment, estimates & forecasts, 2019-2029 (USD Billion)
- TABLE 10. Global Food Traceability Market by region, estimates & forecasts, 2019-2029 (USD Billion)
- TABLE 11. Global Food Traceability Market by segment, estimates & forecasts, 2019-2029 (USD Billion)
- TABLE 12. Global Food Traceability Market by region, estimates & forecasts, 2019-2029 (USD Billion)
- TABLE 13. Global Food Traceability Market by segment, estimates & forecasts, 2019-2029 (USD Billion)
- TABLE 14. Global Food Traceability Market by region, estimates & forecasts, 2019-2029 (USD Billion)
- TABLE 15. Global Food Traceability Market by segment, estimates & forecasts, 2019-2029 (USD Billion)
- TABLE 16. Global Food Traceability Market by region, estimates & forecasts, 2019-2029 (USD Billion)
- TABLE 17. U.S. Food Traceability Market estimates & forecasts, 2019-2029 (USD Billion)
- TABLE 18. U.S. Food Traceability Market estimates & forecasts by segment 2019-2029 (USD Billion)
- TABLE 19. U.S. Food Traceability Market estimates & forecasts by segment 2019-2029 (USD Billion)
- TABLE 20. Canada Food Traceability Market estimates & forecasts, 2019-2029 (USD Billion)
- TABLE 21. Canada Food Traceability Market estimates & forecasts by segment 2019-2029 (USD Billion)
- TABLE 22. Canada Food Traceability Market estimates & forecasts by segment 2019-2029 (USD Billion)
- TABLE 23. UK Food Traceability Market estimates & forecasts, 2019-2029 (USD Billion)
- TABLE 24. UK Food Traceability Market estimates & forecasts by segment 2019-2029 (USD Billion)
- TABLE 25. UK Food Traceability Market estimates & forecasts by segment 2019-2029 (USD Billion)
- TABLE 26. Germany Food Traceability Market estimates & forecasts, 2019-2029 (USD Billion)
- TABLE 27. Germany Food Traceability Market estimates & forecasts by segment 2019-2029 (USD Billion)
- TABLE 28. Germany Food Traceability Market estimates & forecasts by segment 2019-2029 (USD Billion)
- TABLE 29. France Food Traceability Market estimates & forecasts, 2019-2029 (USD Billion)
- TABLE 30. France Food Traceability Market estimates & forecasts by segment 2019-2029 (USD Billion)
- TABLE 31. France Food Traceability Market estimates & forecasts by segment 2019-2029 (USD Billion)
- TABLE 32. Italy Food Traceability Market estimates & forecasts, 2019-2029 (USD Billion)
- TABLE 33. Italy Food Traceability Market estimates & forecasts by segment 2019-2029 (USD Billion)
- TABLE 34. Italy Food Traceability Market estimates & forecasts by segment 2019-2029 (USD Billion)
- TABLE 35. Spain Food Traceability Market estimates & forecasts, 2019-2029 (USD Billion)
- TABLE 36. Spain Food Traceability Market estimates & forecasts by segment 2019-2029 (USD Billion)
- TABLE 37. Spain Food Traceability Market estimates & forecasts by segment 2019-2029 (USD Billion)
- TABLE 38. RoE Food Traceability Market estimates & forecasts, 2019-2029 (USD Billion)
- TABLE 39. RoE Food Traceability Market estimates & forecasts by segment 2019-2029 (USD Billion)
- TABLE 40. RoE Food Traceability Market estimates & forecasts by segment 2019-2029 (USD Billion)
- TABLE 41. China Food Traceability Market estimates & forecasts, 2019-2029 (USD Billion)
- TABLE 42. China Food Traceability Market estimates & forecasts by segment 2019-2029 (USD Billion)
- TABLE 43. China Food Traceability Market estimates & forecasts by segment 2019-2029 (USD Billion)
- TABLE 44. India Food Traceability Market estimates & forecasts, 2019-2029 (USD Billion)
- TABLE 45. India Food Traceability Market estimates & forecasts by segment 2019-2029 (USD Billion)
- TABLE 46. India Food Traceability Market estimates & forecasts by segment 2019-2029 (USD Billion)
- TABLE 47. Japan Food Traceability Market estimates & forecasts, 2019-2029 (USD Billion)
- TABLE 48. Japan Food Traceability Market estimates & forecasts by segment 2019-2029 (USD Billion)
- TABLE 49. Japan Food Traceability Market estimates & forecasts by segment 2019-2029 (USD Billion)
- TABLE 50. South Korea Food Traceability Market estimates & forecasts, 2019-2029 (USD Billion)
- TABLE 51. South Korea Food Traceability Market estimates & forecasts by segment 2019-2029 (USD Billion)
- TABLE 52. South Korea Food Traceability Market estimates & forecasts by segment 2019-2029 (USD Billion)
- TABLE 53. Australia Food Traceability Market estimates & forecasts, 2019-2029 (USD Billion)
- TABLE 54. Australia Food Traceability Market estimates & forecasts by segment 2019-2029 (USD Billion)
- TABLE 55. Australia Food Traceability Market estimates & forecasts by segment 2019-2029 (USD Billion)
- TABLE 56. RoAPAC Food Traceability Market estimates & forecasts, 2019-2029 (USD Billion)
- TABLE 57. RoAPAC Food Traceability Market estimates & forecasts by segment 2019-2029 (USD Billion)
- TABLE 58. RoAPAC Food Traceability Market estimates & forecasts by segment 2019-2029 (USD Billion)
- TABLE 59. Brazil Food Traceability Market estimates & forecasts, 2019-2029 (USD Billion)
- TABLE 60. Brazil Food Traceability Market estimates & forecasts by segment 2019-2029 (USD Billion)
- TABLE 61. Brazil Food Traceability Market estimates & forecasts by segment 2019-2029 (USD Billion)
- TABLE 62. Mexico Food Traceability Market estimates & forecasts, 2019-2029 (USD Billion)
- TABLE 63. Mexico Food Traceability Market estimates & forecasts by segment 2019-2029 (USD Billion)
- TABLE 64. Mexico Food Traceability Market estimates & forecasts by segment 2019-2029 (USD Billion)
- TABLE 65. RoLA Food Traceability Market estimates & forecasts, 2019-2029 (USD Billion)
- TABLE 66. RoLA Food Traceability Market estimates & forecasts by segment 2019-2029 (USD Billion)
- TABLE 67. RoLA Food Traceability Market estimates & forecasts by segment 2019-2029 (USD Billion)
- TABLE 68. Row Food Traceability Market estimates & forecasts, 2019-2029 (USD Billion)
- TABLE 69. Row Food Traceability Market estimates & forecasts by segment 2019-2029 (USD Billion)
- TABLE 70. Row Food Traceability Market estimates & forecasts by segment 2019-2029 (USD Billion)
- TABLE 71. List of secondary sources, used in the study of global Food Traceability Market
- TABLE 72. List of primary sources, used in the study of global Food Traceability Market
- TABLE 73. Years considered for the study
- TABLE 74. Exchange rates considered
List of tables and figures and dummy in nature, final lists may vary in the final deliverable
LIST OF FIGURES
List of figures
- FIG 1. Global Food Traceability Market, research methodology
- FIG 2. Global Food Traceability Market, Market estimation techniques
- FIG 3. Global Market size estimates & forecast methods
- FIG 4. Global Food Traceability Market, key trends 2021
- FIG 5. Global Food Traceability Market, growth prospects 2022-2029
- FIG 6. Global Food Traceability Market, porters 5 force model
- FIG 7. Global Food Traceability Market, pest analysis
- FIG 8. Global Food Traceability Market, value chain analysis
- FIG 9. Global Food Traceability Market by segment, 2019 & 2029 (USD Billion)
- FIG 10. Global Food Traceability Market by segment, 2019 & 2029 (USD Billion)
- FIG 11. Global Food Traceability Market by segment, 2019 & 2029 (USD Billion)
- FIG 12. Global Food Traceability Market by segment, 2019 & 2029 (USD Billion)
- FIG 13. Global Food Traceability Market by segment, 2019 & 2029 (USD Billion)
- FIG 14. Global Food Traceability Market, regional snapshot 2019 & 2029
- FIG 15. North America Food Traceability Market 2019 & 2029 (USD Billion)
- FIG 16. Europe Food Traceability Market 2019 & 2029 (USD Billion)
- FIG 17. Asia pacific Food Traceability Market 2019 & 2029 (USD Billion)
- FIG 18. Latin America Food Traceability Market 2019 & 2029 (USD Billion)
- FIG 19. Global Food Traceability Market, company Market share analysis (2021)
List of tables and figures and dummy in nature, final lists may vary in the final deliverable
Global Food Traceability Market is valued at approximately USD XX billion in 2021 and is anticipated to grow with a healthy growth rate of more than XX % over the forecast period 2022-2029. Food Traceability tracks the movement of food product, and their ingredients across all the stages of the supply chain. It includes processing, distribution, production of food and ingredients
The Food Traceability market is expanding because of factors such as the rising threat of food-borne diseases and growing healthcare investment towards foodborne diseases in the forecast period.
According to the World Health Organization in 2020, around 600 million people across the globe suffered from food-borne diseases. The major cause of these diseases is the consumption of contaminated food products. Thus, food safety has become a major concern and is estimated to surge the demand for the food traceability market. Whereas, technological advancement in food traceability and growing initiatives to improve food safety creates lucrative opportunities for the market. However, rising concerns about food safety among consumers hamper the market growth throughout the forecast period of 2022-2029.
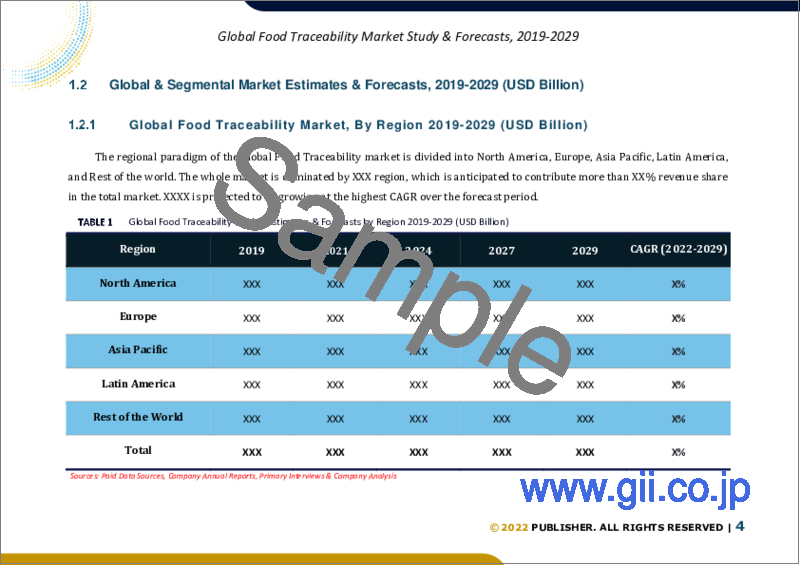
The key regions considered for the Global Food Traceability Market study include Asia Pacific, North America, Europe, Latin America, and the Rest of the World. North America dominates the regional market in terms of revenue, owing to the increasing demand from end-use industries, demand, and adoption of QD technology, etc. Whereas the Asia Pacific is expected to grow during the forecast period, owing to factors such as increasing demand for electronic devices, rising consumer spending on electronics, and rising government regulations toward environmental protection
Major market players included in this report are:
C.H. Robinson (US)
Bio-Rad Laboratories, Inc (US),
OPTEL GROUP (Canada),
Cognex (US),
Honeywell International Inc. (US),
SGS SA (Switzerland),
Zebra Technologies (US),
Bar Code Integrators (US),
Carlisle (US),
Merit-Trax (Canada),
Recent Developments in the Market:
- In June 2020, Cognex (US) acquired SUALAB (Korea). This acquisition will advance its leadership in deep learning-based machine vision and enhance the company's deep learning capabilities.
- Jul 2019, SGS SA (Switzerland) acquired a major stake in DMW ENVIRONMENTAL SAFETY LTD.(UK), a leading solution provider of health and safety services, fire safety audits, including building compliance services, water hygiene services (legionella risk assessment), asbestos surveys, monitoring and analysis, and occupational hygiene.
Global Food Traceability Market Report Scope:
Historical Data: 2019-2020-2021
Base Year for Estimation: 2021
Forecast period: 2022-2029
Report Coverage: Revenue forecast, Company Ranking, Competitive Landscape, Growth factors, and Trends
Segments Covered: Technology, Software, End-user, Application Region
Regional Scope: North America; Europe; Asia Pacific; Latin America; Rest of the World
Customization Scope: Free report customization (equivalent up to 8 analyst's working hours) with purchase. Addition or alteration to country, regional & segment scope*
The objective of the study is to define market sizes of different segments & countries in recent years and to forecast the values to the coming years. The report is designed to incorporate both qualitative and quantitative aspects of the industry within countries involved in the study.
The report also caters detailed information about the crucial aspects such as driving factors & challenges which will define the future growth of the market. Additionally, it also incorporates potential opportunities in micro markets for stakeholders to invest along with the detailed analysis of competitive landscape and product offerings of key players. The detailed segments and sub-segment of the market are explained below:
By Technology:
RFID,
Barcodes,
Infrared,
Biometrics,
GPS
By Software:
ERP,
LIMS,
Warehouse
By End-user:
Food Manufacturing,
Warehouse and Transport,
Retailing,
Government Departments,
Others
By Application:
Fresh Food Produce,
Dairy Products,
Beverage Products,
Others
By Region:
North America
U.S.
Canada
Europe
UK
Germany
France
Spain
Italy
ROE
Asia Pacific
China
India
Japan
Australia
South Korea
RoAPAC
Latin America
Brazil
Mexico
Rest of the World
Table of Contents
Chapter 1. Executive Summary
- 1.1. Market Snapshot
- 1.2. Global & Segmental Market Estimates & Forecasts, 2019-2029 (USD Billion)
- 1.2.1. Food Traceability Market, by Region, 2019-2029 (USD Billion)
- 1.2.2. Food Traceability Market, by Technology, 2019-2029 (USD Billion)
- 1.2.3. Food Traceability Market, by Software, 2019-2029 (USD Billion)
- 1.2.4. Food Traceability Market, by End-User, 2019-2029 (USD Billion)
- 1.2.5. Food Traceability Market, by Application, 2019-2029 (USD Billion)
- 1.3. Key Trends
- 1.4. Estimation Methodology
- 1.5. Research Assumption
Chapter 2. Global Food Traceability Market Definition and Scope
- 2.1. Objective of the Study
- 2.2. Market Definition & Scope
- 2.2.1. Scope of the Study
- 2.2.2. Industry Evolution
- 2.3. Years Considered for the Study
- 2.4. Currency Conversion Rates
Chapter 3. Global Food Traceability Market Dynamics
- 3.1. Food Traceability Market Impact Analysis (2019-2029)
- 3.1.1. Market Drivers
- 3.1.1.1. Rising threat of foodborne diseases
- 3.1.1.2. Growing healthcare investment toward food-borne diseases
- 3.1.2. Market Challenges
- 3.1.2.1. Rising concern about food safety among consumers
- 3.1.3. Market Opportunities
- 3.1.3.1. Technological advancement in food traceability
- 3.1.3.2. Growing initiatives to improve food safety
- 3.1.1. Market Drivers
Chapter 4. Global Food Traceability Market; Industry Analysis
- 4.1. Porter's 5 Force Model
- 4.1.1. Bargaining Power of Suppliers
- 4.1.2. Bargaining Power of Buyers
- 4.1.3. Threat of New Entrants
- 4.1.4. Threat of Substitutes
- 4.1.5. Competitive Rivalry
- 4.2. Futuristic Approach to Porter's 5 Force Model (2019-2029)
- 4.3. PEST Analysis
- 4.3.1. Political
- 4.3.2. Economic
- 4.3.3. Social
- 4.3.4. Technological
- 4.4. Investment Adoption Model
- 4.5. Analyst Recommendation & Conclusion
- 4.6. Top investment opportunity
- 4.7. Top winning strategies
Chapter 5. Risk Assessment: COVID-19 Impact
- 5.1. Assessment of the overall impact of COVID-19 on the industry
- 5.2. Pre COVID-19 and post COVID-19 Market scenario
Chapter 6. Global Food Traceability Market, by Technology
- 6.1. Market Snapshot
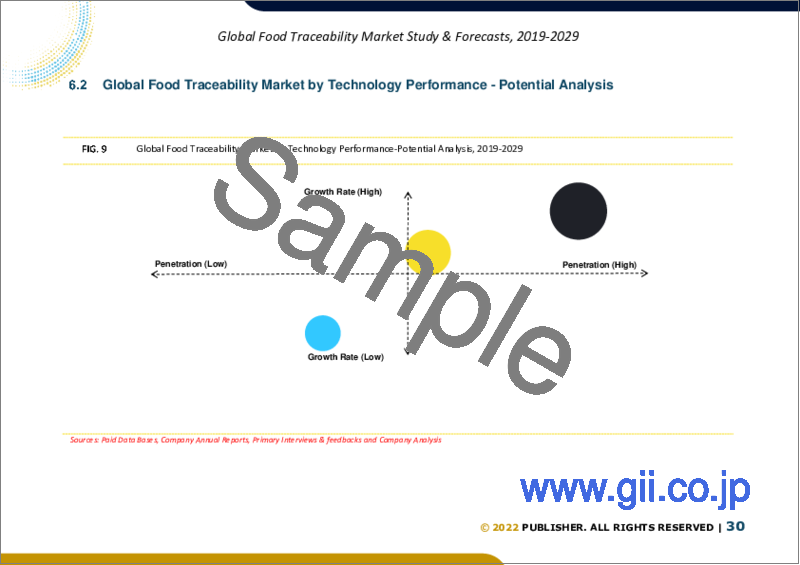
- 6.2. Global Food Traceability Market by Technology Performance - Potential Analysis
- 6.3. Global Food Traceability Market Estimates & Forecasts by Technology 2019-2029 (USD Billion)
- 6.4. Food Traceability Market, Sub Segment Analysis
- 6.4.1. RFID,
- 6.4.2. Barcodes,
- 6.4.3. Infrared,
- 6.4.4. Biometrics,
- 6.4.5. GPS
Chapter 7. Global Food Traceability Market, by Software
- 7.1. Market Snapshot
- 7.2. Global Food Traceability Market by Software, Performance - Potential Analysis
- 7.3. Global Food Traceability Market Estimates & Forecasts by Software 2019-2029 (USD Billion)
- 7.4. Food Traceability Market, Sub Segment Analysis
- 7.4.1. ERP,
- 7.4.2. LIMS,
- 7.4.3. Warehouse
Chapter 8. Global Food Traceability Market, by End-User
- 8.1. Market Snapshot
- 8.2. Global Food Traceability Market by End-User, Performance - Potential Analysis
- 8.3. Global Food Traceability Market Estimates & Forecasts by End-User 2019-2029 (USD Billion)
- 8.4. Food Traceability Market, Sub Segment Analysis
- 8.4.1. Food Manufacturing,
- 8.4.2. Warehouse and Transport,
- 8.4.3. Retailing,
- 8.4.4. Government Departments,
- 8.4.5. Others
Chapter 9. Global Food Traceability Market, by Application
- 9.1. Market Snapshot
- 9.2. Global Food Traceability Market by Application, Performance - Potential Analysis
- 9.3. Global Food Traceability Market Estimates & Forecasts by Application 2019-2029 (USD Billion)
- 9.4. Food Traceability Market, Sub Segment Analysis
- 9.4.1. Fresh Food Produce,
- 9.4.2. Dairy Products,
- 9.4.3. Beverage Products,
- 9.4.4. Others
Chapter 10. Global Food Traceability Market, Regional Analysis
- 10.1. Food Traceability Market, Regional Market Snapshot
- 10.2. North America Food Traceability Market
- 10.2.1. U.S. Food Traceability Market
- 10.2.1.1. Technology breakdown estimates & forecasts, 2019-2029
- 10.2.1.2. Software breakdown estimates & forecasts, 2019-2029
- 10.2.1.3. End-User breakdown estimates & forecasts, 2019-2029
- 10.2.1.4. Application breakdown estimates & forecasts, 2019-2029
- 10.2.2. Canada Food Traceability Market
- 10.2.1. U.S. Food Traceability Market
- 10.3. Europe Food Traceability Market Snapshot
- 10.3.1. U.K. Food Traceability Market
- 10.3.2. Germany Food Traceability Market
- 10.3.3. France Food Traceability Market
- 10.3.4. Spain Food Traceability Market
- 10.3.5. Italy Food Traceability Market
- 10.3.6. Rest of Europe Food Traceability Market
- 10.4. Asia-Pacific Food Traceability Market Snapshot
- 10.4.1. China Food Traceability Market
- 10.4.2. India Food Traceability Market
- 10.4.3. Japan Food Traceability Market
- 10.4.4. Australia Food Traceability Market
- 10.4.5. South Korea Food Traceability Market
- 10.4.6. Rest of Asia Pacific Food Traceability Market
- 10.5. Latin America Food Traceability Market Snapshot
- 10.5.1. Brazil Food Traceability Market
- 10.5.2. Mexico Food Traceability Market
- 10.6. Rest of The World Food Traceability Market
Chapter 11. Competitive Intelligence
- 11.1. Top Market Strategies
- 11.2. Company Profiles
- 11.2.1. C.H. Robinson (US)
- 11.2.1.1. Key Information
- 11.2.1.2. Overview
- 11.2.1.3. Financial (Subject to Data Availability)
- 11.2.1.4. Product Summary
- 11.2.1.5. Recent Developments
- 11.2.2. Bio-Rad Laboratories, Inc (US),
- 11.2.3. OPTEL GROUP (Canada),
- 11.2.4. Cognex (US),
- 11.2.5. Honeywell International Inc. (US),
- 11.2.6. SGS SA (Switzerland),
- 11.2.7. Zebra Technologies (US),
- 11.2.8. Bar Code Integrators (US),
- 11.2.9. Carlisle (US),
- 11.2.10. Merit-Trax (Canada),
- 11.2.1. C.H. Robinson (US)
Chapter 12. Research Process
- 12.1. Research Process
- 12.1.1. Data Mining
- 12.1.2. Analysis
- 12.1.3. Market Estimation
- 12.1.4. Validation
- 12.1.5. Publishing
- 12.2. Research Attributes
- 12.3. Research Assumption