|
|
市場調査レポート
商品コード
1711586
3Dタンパク質構造解析市場- 世界および地域別分析:製品別、用途別、エンドユーザー別、地域別 - 分析と予測(2025年~2035年)3D Protein Structure Analysis Market - A Global and Regional Analysis: Focus on Product, End User, and Region - Analysis and Forecast, 2025-2035 |
||||||
カスタマイズ可能
|
|||||||
| 3Dタンパク質構造解析市場- 世界および地域別分析:製品別、用途別、エンドユーザー別、地域別 - 分析と予測(2025年~2035年) |
|
出版日: 2025年04月23日
発行: BIS Research
ページ情報: 英文 100 Pages
納期: 1~5営業日
|
全表示
- 概要
- 図表
- 目次
世界の3Dタンパク質構造解析の市場規模は、2025年から2035年までの予測期間中に9%のCAGRで拡大すると予測されています。
世界の3Dタンパク質構造解析市場の成長は、タンパク質構造解析用機器の技術的進歩や、タンパク質構造解析を加速させるための研究開発費の増加によって牽引されると予測されます。
分子生物学研究の主な目標の1つは、タンパク質構造を理解することです。タンパク質複合体解析は、タンパク質が複雑な生物学的サンプルに含まれていることから、タンパク質の構造と機能を完全に評価することを含みます。タンパク質複合体の構造は、現代のタンパク質複合体解析法を用いて発見することができます。現在、極低温電子顕微鏡(EM)、X線小角散乱(SAXS)、核磁気共鳴(NMR)分光法、X線結晶構造解析は、分子構造や分子認識機構を記述し理解するための取り組みに幅広く使用されています。Bruker Corporation、JEOL Ltd.、Spectris plcなどの大手メーカーは、ニーズに合わせて3Dタンパク質構造解析用の装置を提供しています。これらの装置は、研究室のスループットのニーズに応えることができます。
- 3Dタンパク質構造解析の大手装置プロバイダーの存在は、市場に大きな影響を与えています。例えば、2022年4月、NJ Biopharmaceuticals LLCとJEOL Ltd.は、JEOLの800 MHz NMRを用いた革新的な創薬プラットフォームソリューションを提供するための提携を発表しました。この提携により、日本電子は3Dタンパク質構造解析の基盤を拡大し、既存の製品ラインナップを増やすことを目指します。
- 2020年8月、科学サービスを提供する世界の企業であるThermo Fisher Scientific Inc.は、製薬・バイオテクノロジー企業と、この画期的な技術のスタートアップパッケージをサービスとして提供する開発業務受託機関(CRO)を結ぶことで、クライオ電子顕微鏡(クライオEM)へのアクセスを容易にすると発表しました。
- 3Dタンパク質構造解析市場のセグメンテーション:
製品別では、世界の3Dタンパク質構造解析市場は消耗品セグメントが支配的と予想されます。これは、3Dタンパク質構造解析のさまざまな技術で使用される複数の試薬、キット、スクリーン、溶媒、洗浄剤などが入手可能なためです。
用途別では、臨床診断分野が世界の3Dタンパク質構造解析市場で最大のシェアを占めています。疾病の増加がこのセグメントの市場成長を牽引します。
エンドユーザー別では、バイオ製薬会社が世界の3Dタンパク質構造解析市場を独占しています。医薬品開発のための製薬会社を中心に、さまざまな産業でタンパク質構造解析の用途が拡大していることが、この市場の動向拡大にさらに寄与すると予想されます。
世界の3Dタンパク質構造解析市場の最近の動向
- 2022年2月、JEOL Ltd.は、タンパク質の単粒子解析に特化した新型冷陰極電子顕微鏡(クライオ電子顕微鏡)「CRYO ARM 200 II」(JEM-Z200CA)の開発を発表しました。
- 2021年11月、日本電子は核磁気共鳴装置「ECZ Luminous」(JNM-ECZLシリーズ)の発売を発表しました。この製品は、最先端のデジタル技術と高周波技術により、分光器の小型化と性能向上を実現した次のステップです。
- 2020年10月、Thermo Fisher Scientific Inc.は2つの画期的なイメージングフィルター、すなわちThermo Scientific Selectris Imaging FilterとThermo Scientific Selectris X Imaging Filterを発表しました。i.は、ユーザーが真の原子分解能でタンパク質を観察できるようにすることで、クライオ電子顕微鏡(クライオ電子顕微鏡)を新たなレベルに引き上げました。
- 2021年4月、Thermo Fisher Scientific Inc.は、Thermo Scientific Krios Cryo-TEMと同社の新しい冷電界放出銃の重要なアクセサリーであるThermo Scientific E-CFEGを発表しました。他の市販技術と比較して、E-four CFEGの主要コンポーネントは、前例のない単一粒子分析(SPA)分解能レベルを達成するために協働します。
製品/イノベーション戦略:当レポートでは、消耗品、装置、計算ソフトウェアをベースとする企業を考察しています。ほとんどの企業は、3Dタンパク質構造解析のための装置と互換性のある消耗品を提供しています。
成長/マーケティング戦略:3Dタンパク質構造解析の主要コンポーネントは、装置、消耗品、計算ソフトウェアです。主な市場収益は消耗品セグメントから生み出されます。ワークフロー全体については、生産に関わる主要企業を考慮した価格分析とともに、当レポートで十分に説明されています。
競合戦略:世界の3Dタンパク質構造解析市場の主要企業は、消耗品、装置、計算ソフトウェアベースの企業で構成され、本調査で分析・プロファイルされています。さらに、世界の3Dタンパク質構造解析市場で活動する参入企業の詳細な競合ベンチマーキングは、読者が明確な市場情勢を提示し、参入企業が互いにどのようにスタックするかを理解するのに役立ちます。さらに、パートナーシップ、協定、協力などの包括的な競合戦略は、読者が市場の未開拓の収益ポケットを理解するのに役立ちます。
当レポートでは、世界の3Dタンパク質構造解析市場について調査し、市場の概要とともに、製品別、用途別、エンドユーザー別、地域別の動向、および市場に参入する企業のプロファイルなどを提供しています。
目次
エグゼクティブサマリー
第1章 業界展望
- 市場概要
- 特許分析
- 特許出願動向
- 規制状況
- 主な動向
第2章 市場力学
- 概要
- 影響分析
- 市場促進要因
- 市場抑制要因
- 市場機会
第3章 世界の3Dタンパク質構造解析市場:競合情勢
- 概要
- 企業戦略
- ビジネス戦略
- 償還シナリオ
第4章 世界の3Dタンパク質構造解析市場、製品別、(100万米ドル)、2023年~2035年
- 概要
- 消耗品
- 装置
- 計算ソフトウェア
第5章 世界の3Dタンパク質構造解析市場、用途別、(100万米ドル)、2023年~2035年
- 概要
- 臨床診断
- 創薬
- その他
第6章 世界の3Dタンパク質構造解析市場、エンドユーザー別、(100万米ドル)、2023年~2035年
- 概要
- バイオ医薬品会社
- 学術研究機関
- その他
第7章 世界の3Dタンパク質構造解析市場、地域別、(100万米ドル)、2023年~2035年
- 概要
- 北米
- 米国
- カナダ
- 欧州
- ドイツ
- 英国
- フランス
- イタリア
- スペイン
- その他
- アジア太平洋
- 中国
- 日本
- インド
- 韓国
- オーストラリア
- その他
- その他の地域
第8章 企業プロファイル
- Bruker Corporation
- JEOL Ltd.
- Spectris plc
- Thermo Fisher Scientific Inc.
- Merck KGaA
- Schrodinger, Inc.
- Molecular Dimensions
- Arinax Scientific Instrumentation
- Cambridge Isotope Laboratories, Inc.
- HAMPTON RESEARCH CORP.
- DNASTAR
- RosettaCommons.org
- Rigaku Corporation
- Dassault Systemes
- Jena Bioscience GmbH
List of Figures
- Figure 1: Global 3D Protein Structure Analysis Market, Dynamics Impact Analysis
- Figure 2: Global 3D Protein Structure Analysis Market Coverage
- Figure 3: Global 3D Protein Structure Analysis Market, Patent Analysis, January 2022-March 2025
- Figure 4: Global 3D Protein Strutcure Analysis Market, Competitive Landscape, January 2022-March 2025
List of Tables
- Table 1: Global 3D Protein Structure Analysis Market, Dynamics Impact Analysis
- Table 2: Global 3D Protein Structure Analysis Market, (by Product), $Million, 2023-2035
- Table 3: Global 3D Protein Structure Analysis Market, (by Application), $Million, 2023-2035
- Table 4: Global 3D Protein Structure Analysis Market, (by End User), $Million, 2023-2035
- Table 5: Global 3D Protein Structure Analysis Market, (by Region), $Million, 2023-2035
Global 3D Protein Structure Analysis Market Overview
The global 3D protein structure analysis market is expected to grow at a CAGR of 9% during the forecast period from 2025 to 2035. The growth in the global 3D protein structure analysis market is expected to be driven by technological advancements in equipment for protein structure analysis and by an increase in R&D expenditure to accelerate protein structure analysis.
Market Lifecycle Stage
One of the main goals of molecular biology research is to understand protein structure. Protein complex analysis involves a complete evaluation of the structure and function of proteins because proteins are found in intricate biological samples. The structure of protein complexes can be discovered using contemporary protein complex analysis methods. At present cryo-electron microscopy (EM), small angle X-Ray scattering (SAXS), nuclear magnetic resonance (NMR) spectroscopy, and X-Ray crystallography are used extensively in efforts to describe and understand molecular structures and molecular recognition mechanisms. Leading manufacturers like Bruker Corporation, JEOL Ltd., and Spectris plc provide equipment for 3D protein structure analysis according to one's needs. These equipment can address the laboratory's throughput needs.
Impact
- The presence of major equipment providers of 3D protein structure analysis has a major impact on the market. For instance, in April 2022, NJ Biopharmaceuticals LLC and JEOL Ltd. announced their collaboration to bring innovative drug discovery platform solutions using JEOL's 800 MHz NMR. With the help of this partnership, JEOL Ltd. aspires to grow its 3D protein structure analysis base and increase its existing product line.
- In August 2020, Thermo Fisher Scientific Inc., a global player in providing scientific services, announced that it would facilitate access to cryo-electron microscopy (cryo-EM) by connecting pharmaceutical and biotechnology companies with contract research organizations (CROs) that provide start-up packages for this game-changing technology as a service.
- 3D Protein Structure Analysis Market Segmentation:
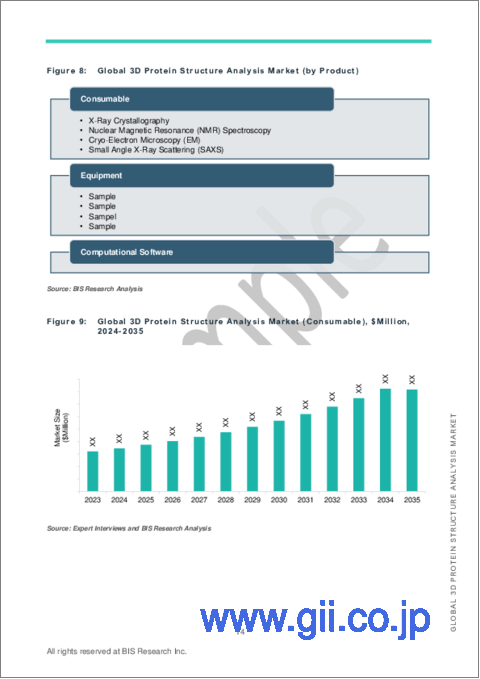
Segmentation 1: by Product
- Consumable
- Equipment
- Computational Software
Based on product, the global 3D protein structure analysis market is expected to be dominated by the consumable segment. This is due to the availability of several reagents, kits, screens, solvents, detergents, and others to be used in different technologies for 3D protein structure analysis.
Segmentation 2: by Application
- Clinical Diagnosis
- Drug Discovery
- Other Application
Based on application, the clinical diagnosis segment accounted for the largest share of global 3D protein structure analysis market. The increasing incidences of diseases will drive the market growth of this segment.
Segmentation 3: by End User
- Biopharmaceutical Company
- Academic and Research Institute
- Other End User (CRO, CDMOs, Research Hospitals, R&D Centers, etc.)
Based on end users, the biopharmaceutical company segment is the dominating end user in the global 3D protein structure analysis market. The expanding application of protein structure analysis in a variety of industries, primarily in pharmaceutical companies for drug development, is further expected to contribute to its growing trend.
Segmentation 4: by Region
- North America
- Europe
- Asia-Pacific
- Rest-of-the-World
Recent Developments in Global 3D Protein Structure Analysis Market
- In February 2022, JEOL Ltd. announced the development of a new cold field emission cryo-electron microscope (cryo-EM), the CRYO ARM 200 II (JEM-Z200CA), dedicated to single particle analysis of proteins.
- In November 2021, JEOL Ltd. announced the availability of "ECZ Luminous" nuclear magnetic resonance console (JNM-ECZL series). This product is the next step in spectrometer miniaturization and extended performance through state-of-the-art digital and high-frequency technologies.
- In October 2020, Thermo Fisher Scientific Inc. introduced two ground-breaking imaging filters, i.e., the Thermo Scientific Selectris Imaging Filter and the Thermo Scientific Selectris X Imaging Filter, which elevated cryo-electron microscopy (cryo-EM) to a new level by allowing users to view proteins at true atomic resolution.
- In April 2021, Thermo Fisher Scientific Inc. unveiled the Thermo Scientific E-CFEG, a significant accessory for the Thermo Scientific Krios Cryo-TEM and the company's new cold field emission gun. In comparison to other commercially available technologies, the E-four CFEG's key components work together to achieve single particle analysis (SPA) resolution levels that are unprecedented.
Demand - Drivers and Limitations
Following are the demand drivers for the global 3D protein structure analysis market:
- Technological advancements in equipment for protein structure analysis
- Increase in R&D expenditure to accelerate protein structure analysis
- Rising focus on miniaturization
The 3D protein structure analysis market is expected to face some limitations too due to the following challenges:
- Certain instrument limitations pertaining to 3D protein structure analysis
- Lack of qualified personnel
- High cost and time-consuming method
How can this report add value to an organization?
Product/Innovation Strategy: The report considers consumable, equipment, and computational software-based companies. Most companies provide consumables that are compatible with equipment for 3D protein structure analysis.
Growth/Marketing Strategy: The key components in 3D protein structure analysis are the equipment, consumable, and computational software. The main market revenue is generated from the consumable segment. The entire workflow has been well explained in the report, along with pricing analysis considering the key companies involved in the production.
Competitive Strategy: The key players in the global 3D protein structure analysis market have been analyzed and profiled in the study, consisting of consumable, equipment, and computational software-based companies. Moreover, a detailed competitive benchmarking of the players operating in the global 3D protein structure analysis market has been done to help the reader understand how players stack against each other, presenting a clear market landscape. Additionally, comprehensive competitive strategies such as partnerships, agreements, and collaborations will aid the reader in understanding the untapped revenue pockets in the market.
Key Market Players and Competition Synopsis of 3D Protein Structure Analysis
The companies that are profiled have been selected based on inputs gathered from primary experts, analyzing company coverage, product portfolio, and market penetration.
Some of the prominent names established in 3D protein structure analysis market are:
- Merck KGaA
- Molecular Dimensions
- Cambridge Isotope Laboratories, Inc.
- HAMPTON RESEARCH CORP.
- Jena Bioscience GmbH
- Bruker Corporation
- JEOL Ltd.
- Spectris plc
- Thermo Fisher Scientific, Inc.
- Arinax Scientific Instrumentation.
- Rigaku Corporation
- Schrodinger, Inc.
- DNASTAR
- RosettaCommons.org
- Dassault Systemes
Table of Contents
Executive Summary
Scope and Definition
Market/Product Definition
Inclusion and Exclusion
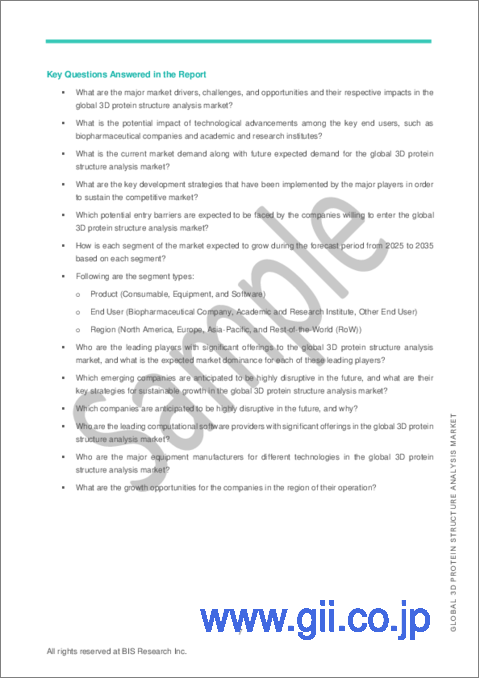
Key Questions Answered
Research Methodology
1. Industry Outlook
- 1.1 Market Overview
- 1.2 Patent Analysis
- 1.2.1 Patent Filing Trend
- 1.3 Regulatory Landscape
- 1.4 Key Trends
2. Market Dynamics
- 2.1 Overview
- 2.1.1 Impact Analysis
- 2.2 Market Drivers
- 2.3 Market Restraints
- 2.4 Market Opportunities
3. Global 3D Protein Structure Analysis Market: Competitive Landscape
- 3.1 Overview
- 3.2 Corporate Strategies
- 3.2.1 Mergers and Acquisitions
- 3.2.2 Synergistic Activities
- 3.2.3 Business Expansions and Funding
- 3.3 Business Strategies
- 3.3.1 Product Launches and Approvals
- 3.3.2 Publications
- 3.3.3 Licenses and Agreements
- 3.3.4 Other Activities
- 3.4 Reimbursement Scenario.
4. Global 3D Protein Structure Analysis Market (by Product), ($Million), 2023-2035
- 4.1 Overview
- 4.2 Consumable
- 4.2.1 X-Ray Crystallography
- 4.2.2 Nuclear Magnetic Resonance (NMR) Spectroscopy
- 4.2.3 Cryo-Electron Microscopy (Cryo-EM)
- 4.2.4 Small Angle X-Ray Scattering (SAXS)
- 4.3 Equipment
- 4.3.1 X-Ray Crystallography
- 4.3.2 Nuclear Magnetic Resonance (NMR) Spectroscopy
- 4.3.3 Cryo-Electron Microscopy (Cryo-EM)
- 4.3.4 Small Angle X-Ray Scattering (SAXS)
- 4.4 Computational Software
5. Global 3D Protein Structure Analysis Market (by Application), ($Million), 2023-2035
- 5.1 Overview
- 5.2 Clinical Diagnosis
- 5.3 Drug Discovery
- 5.4 Other Application
6. Global 3D Protein Structure Analysis Market (by End User), ($Million), 2023-2035
- 6.1 Overview
- 6.2 Biopharmaceutical Company
- 6.3 Academic and Research Institute
- 6.4 Other End User
7. Global 3D Protein Structure Analysis Market (Region), ($Million), 2023-2035
- 7.1 Overview
- 7.2 North America
- 7.2.1 U.S.
- 7.2.2 Canada
- 7.3 Europe
- 7.3.1 Germany
- 7.3.2 U.K.
- 7.3.3 France
- 7.3.4 Italy
- 7.3.5 Spain
- 7.3.6 Rest-of-Europe
- 7.4 Asia Pacific
- 7.4.1 China
- 7.4.2 Japan
- 7.4.3 India
- 7.4.4 South Korea
- 7.4.5 Australia
- 7.4.6 Rest-of- Asia Pacific
- 7.5 Rest-of-the-World
8. Company Profiles
- 8.1 Overview
- 8.2 Bruker Corporation
- 8.2.1 Overview
- 8.2.2 Top Products / Product Portfolio
- 8.2.3 Top Competitors
- 8.2.4 Target Customers/End-Users
- 8.2.5 Key Personnel
- 8.2.6 Analyst View
- 8.3 JEOL Ltd.
- 8.3.1 Overview
- 8.3.2 Top Products / Product Portfolio
- 8.3.3 Top Competitors
- 8.3.4 Target Customers/End-Users
- 8.3.5 Key Personnel
- 8.3.6 Analyst View
- 8.4 Spectris plc
- 8.4.1 Overview
- 8.4.2 Top Products / Product Portfolio
- 8.4.3 Top Competitors
- 8.4.4 Target Customers/End-Users
- 8.4.5 Key Personnel
- 8.4.6 Analyst View
- 8.5 Thermo Fisher Scientific Inc.
- 8.5.1 Overview
- 8.5.2 Top Products / Product Portfolio
- 8.5.3 Top Competitors
- 8.5.4 Target Customers/End-Users
- 8.5.5 Key Personnel
- 8.5.6 Analyst View
- 8.6 Merck KGaA
- 8.6.1 Overview
- 8.6.2 Top Products / Product Portfolio
- 8.6.3 Top Competitors
- 8.6.4 Target Customers/End-Users
- 8.6.5 Key Personnel
- 8.6.6 Analyst View
- 8.7 Schrodinger, Inc.
- 8.7.1 Overview
- 8.7.2 Top Products / Product Portfolio
- 8.7.3 Top Competitors
- 8.7.4 Target Customers/End-Users
- 8.7.5 Key Personnel
- 8.7.6 Analyst View
- 8.8 Molecular Dimensions
- 8.8.1 Overview
- 8.8.2 Top Products / Product Portfolio
- 8.8.3 Top Competitors
- 8.8.4 Target Customers/End-Users
- 8.8.5 Key Personnel
- 8.8.6 Analyst View
- 8.9 Arinax Scientific Instrumentation
- 8.9.1 Overview
- 8.9.2 Top Products / Product Portfolio
- 8.9.3 Top Competitors
- 8.9.4 Target Customers/End-Users
- 8.9.5 Key Personnel
- 8.9.6 Analyst View
- 8.10 Cambridge Isotope Laboratories, Inc.
- 8.10.1 Overview
- 8.10.2 Top Products / Product Portfolio
- 8.10.3 Top Competitors
- 8.10.4 Target Customers/End-Users
- 8.10.5 Key Personnel
- 8.10.6 Analyst View
- 8.11 HAMPTON RESEARCH CORP.
- 8.11.1 Overview
- 8.11.2 Top Products / Product Portfolio
- 8.11.3 Top Competitors
- 8.11.4 Target Customers/End-Users
- 8.11.5 Key Personnel
- 8.11.6 Analyst View
- 8.12 DNASTAR
- 8.12.1 Overview
- 8.12.2 Top Products / Product Portfolio
- 8.12.3 Top Competitors
- 8.12.4 Target Customers/End-Users
- 8.12.5 Key Personnel
- 8.12.6 Analyst View
- 8.13 RosettaCommons.org
- 8.13.1 Overview
- 8.13.2 Top Products / Product Portfolio
- 8.13.3 Top Competitors
- 8.13.4 Target Customers/End-Users
- 8.13.5 Key Personnel
- 8.13.6 Analyst View
- 8.14 Rigaku Corporation
- 8.14.1 Overview
- 8.14.2 Top Products / Product Portfolio
- 8.14.3 Top Competitors
- 8.14.4 Target Customers/End-Users
- 8.14.5 Key Personnel
- 8.14.6 Analyst View
- 8.15 Dassault Systemes
- 8.15.1 Overview
- 8.15.2 Top Products / Product Portfolio
- 8.15.3 Top Competitors
- 8.15.4 Target Customers/End-Users
- 8.15.5 Key Personnel
- 8.15.6 Analyst View
- 8.16 Jena Bioscience GmbH
- 8.16.1 Overview
- 8.16.2 Top Products / Product Portfolio
- 8.16.3 Top Competitors
- 8.16.4 Target Customers/End-Users
- 8.16.5 Key Personnel
- 8.16.6 Analyst View


