|
|
市場調査レポート
商品コード
1622832
アジア太平洋のアグリボルタイクス(営農型太陽光発電)市場:製品別・国別動向 - 分析と予測(2023年~2033年)Asia-Pacific Agrivoltaics Market:Focus on Product and Country - Analysis and Forecast, 2023-2033 |
||||||
|
|||||||
カスタマイズ可能
|
|||||||


| アジア太平洋のアグリボルタイクス(営農型太陽光発電)市場:製品別・国別動向 - 分析と予測(2023年~2033年) |
|
出版日: 2024年12月27日
発行: BIS Research
ページ情報: 英文 66 Pages
納期: 1~5営業日
|

全表示
- 概要
- 図表
- 目次
アジア太平洋のアグリボルタイクス(営農型太陽光発電)の市場規模は、2023年の6億5,480万米ドルから2033年には60億230万米ドルに達し、予測期間の2023年~2033年のCAGRは24.80%になると予測されています。
アジア太平洋の農業用太陽光発電分野の企業は、革新的な技術を導入し、農家や太陽エネルギー・プロバイダーと戦略的提携を結び、政府のインセンティブや再生可能エネルギー政策を活用することで、この成長機会を活用することができます。開発には、研究開発費と強力な生産インフラの構築が不可欠です。
企業は、これらの戦略を実践することで、農業に特化した持続可能なエネルギーソリューションのリーダーとしての地位を確立することができます。地域の再生可能エネルギー目標を推進することに加え、この戦略はアジア太平洋の農家とエネルギー・ユーザーのニーズの変化を考慮に入れています。企業は、協力し革新することで、この地域の経済的・環境的メリットを生み出しながら、アグリボルタイクスの方向性に大きな影響を与えることができます。
| 主要市場統計 | |
|---|---|
| 予測期間 | 2023年~2033年 |
| 2023年の評価 | 6億5,480万米ドル |
| 2033年の予測 | 60億230万米ドル |
| CAGR | 24.8% |
アジア太平洋におけるアグリボルタイクス市場は、再生可能エネルギー源の需要を満たし、農業生産性を向上させる必要性から、大きく拡大しています。ソーラーパネルと農業慣行の統合、すなわちアグリボルタイクスは、この地域の土地利用問題に対処する創造的な方法を提供します。この戦略は、アジア太平洋諸国が農業とエネルギー発電を融合させることで、再生可能エネルギーへのコミットメントと食料安全保障のバランスを取るのに役立ちます。
気候変動に対する意識の高まり、持続可能な農業慣行の必要性、再生可能エネルギーを支援する政府の取り組みは、市場拡大を後押しする主な要因です。中国、日本、インドなど多くのアジア太平洋諸国は、営農型太陽光発電設備が土地利用を最適化し、農家とエネルギー生産者の双方に利益をもたらすと見ているため、営農型太陽光発電設備を促進するための政策や補助金を実施しています。
エネルギー貯蔵システムやソーラーパネルの設計における技術開発も市場を牽引しています。発電しながら作物への光の透過を最大化する、軽量で透明な可動式パネルが増えています。さらに、地元農家、エネルギー供給業者、アグリテック企業間の協力が、技術革新と普及を後押ししています。
当レポートでは、アジア太平洋のアグリボルタイクス市場について調査し、市場の概要とともに、製品別、国別の動向、および市場に参入する企業のプロファイルなどを提供しています。
目次
エグゼクティブサマリー
第1章 市場
- 動向:現在および将来の影響評価
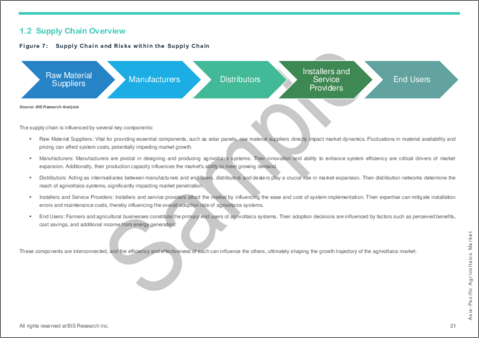
- サプライチェーンの概要
- 研究開発レビュー
- 規制状況
- 市場力学の概要
第2章 地域
- 地域別概要
- アジア太平洋
第3章 市場-競合ベンチマーキングと企業プロファイル
- 今後の見通し
- 地理的評価
- Jinko Solar
- Trinasolar
- Yingli Solar
第4章 調査手法
List of Figures
- Figure 1: Agrivoltaics Market (by Region), $Million, 2023, 2026, 2033
- Figure 2: Pricing Analysis for Agrivoltaics Market (Region), $ per KW/h, 2023, 2026, and 2033
- Figure 3: Asia-Pacific Agrivoltaics Market (by Site of Installation), $Million, 2023, 2026, and 2033
- Figure 4: Asia-Pacific Agrivoltaics Market (by Array Configuration), $Million, 2023, 2026, and 2033
- Figure 5: Asia-Pacific Agrivoltaics Market (by Photovoltaic Technology), $Million, 2023, 2026, and 2033
- Figure 6: Key Events
- Figure 7: Supply Chain and Risks within the Supply Chain
- Figure 8: Agrivoltaics Market (by Company), January 2020-March 2024
- Figure 9: Agrivoltaics Market (by Country), January 2020-March 2024
- Figure 10: Impact Analysis of Market Navigating Factors, 2023-2033
- Figure 11: Estimated Average Carbon Emission and Fossil Energy Demand in Agrivoltaics and Conventional Farm
- Figure 12: China Agrivoltaics Market, $Million, 2022-2033
- Figure 13: India Agrivoltaics Market, $Million, 2022-2033
- Figure 14: Japan Agrivoltaics Market, $Million, 2022-2033
- Figure 15: South Korea Agrivoltaics Market, $Million, 2022-2033
- Figure 16: Rest-of-Asia-Pacific Agrivoltaics Market, $Million, 2022-2033
- Figure 17: Strategic Initiatives, 2020-2024
- Figure 18: Share of Strategic Initiatives, 2020-2024
- Figure 19: Data Triangulation
- Figure 20: Top-Down and Bottom-Up Approach
- Figure 21: Assumptions and Limitations
List of Tables
- Table 1: Market Snapshot
- Table 2: Opportunities across Regions
- Table 3: Recent Initiatives in Agrivoltaics
- Table 4: Agrivoltaics Market (by Region), $Million, 2022-2033
- Table 5: Asia-Pacific Agrivoltaics Market (by Array Configuration), $Million, 2022-2033
- Table 6: Asia-Pacific Agrivoltaics Market (by Photovoltaic Technology), $Million, 2022-2033
- Table 7: Asia-Pacific Agrivoltaics Market (by Site of Installation), $Million, 2022-2033
- Table 8: China Agrivoltaics Market (by Array Configuration), $Million, 2022-2033
- Table 9: China Agrivoltaics Market (by Photovoltaic Technology), $Million, 2022-2033
- Table 10: China Agrivoltaics Market (by Site of Installation), $Million, 2022-2033
- Table 11: India Agrivoltaics Market (by Array Configuration), $Million, 2022-2033
- Table 12: India Agrivoltaics Market (by Photovoltaic Technology), $Million, 2022-2033
- Table 13: India Agrivoltaics Market (by Site of Installation), $Million, 2022-2033
- Table 14: Japan Agrivoltaics Market (by Array Configuration), $Million, 2022-2033
- Table 15: Japan Agrivoltaics Market (by Photovoltaic Technology), $Million, 2022-2033
- Table 16: Japan Agrivoltaics Market (by Site of Installation), $Million, 2022-2033
- Table 17: Profits Attained from Rice Farming and the Profit from the PV Power
- Table 18: South Korea Agrivoltaics Market (by Array Configuration), $Million, 2022-2033
- Table 19: South Korea Agrivoltaics Market (by Photovoltaic Technology), $Million, 2022-2033
- Table 20: South Korea Agrivoltaics Market (by Site of Installation), $Million, 2022-2033
- Table 21: Rest-of-Asia-Pacific Agrivoltaics Market (by Array Configuration), $Million, 2022-2033
- Table 22: Rest-of-Asia-Pacific Agrivoltaics Market (by Photovoltaic Technology), $Million, 2022-2033
- Table 23: Rest-of-Asia-Pacific Agrivoltaics Market (by Site of Installation), $Million, 2022-2033
- Table 24: Market Share, 2022
Introduction to Asia-Pacific Agrivoltaics Market
The Asia-Pacific agrivoltaics market is projected to reach $6,002.3 million by 2033 from $654.8 million in 2023, growing at a CAGR of 24.80% during the forecast period 2023-2033. Companies in the APAC agrivoltaics sector can capitalize on this growing opportunity by implementing innovative technologies, forming strategic alliances with farmers and solar energy providers, and leveraging government incentives and renewable energy policies. To capitalize on the growing market, research and development expenditures as well as the construction of a strong production infrastructure are essential.
Businesses can position themselves as leaders in agriculturally specific sustainable energy solutions by putting these strategies into practice. In addition to advancing the region's renewable energy objectives, this strategy takes into account the changing needs of APAC's farmers and energy users. Businesses can significantly influence the direction of agrivoltaics while generating economic and environmental advantages for the area by collaborating and innovating.
| KEY MARKET STATISTICS | |
|---|---|
| Forecast Period | 2023 - 2033 |
| 2023 Evaluation | $654.8 Million |
| 2033 Forecast | $6,002.3 Million |
| CAGR | 24.8% |
Market Introduction
The market for agrivoltaics in Asia Pacific is expanding significantly due to the need to meet the demands for renewable energy sources and increase agricultural productivity. The integration of solar panels with agricultural practices, or agrivoltaics, offers a creative way to address the region's land-use issues. This strategy helps APAC nations strike a balance between their commitments to renewable energy and food security by fusing farming and energy generation.
Growing awareness of climate change, the need for sustainable agricultural practices, and government initiatives to support renewable energy are major factors propelling the market's expansion. A number of APAC countries, such as China, Japan, and India, are putting policies and subsidies in place to promote agrivoltaic installations because they see how they can optimize land use and benefit both farmers and energy producers.
Technological developments in energy storage systems and solar panel design are also driving the market. There are increasingly lightweight, transparent, and movable panels that maximize crop light penetration while producing electricity. Furthermore, cooperation amongst local farmers, energy suppliers, and agritech firms is encouraging innovation and uptake.
The market for agrivoltaics is expected to grow rapidly as the APAC region continues to place a high priority on sustainability. It presents a viable route to energy resilience and agricultural efficiency in the face of escalating resource and climate challenges.
Market Segmentation
Segmentation 1: by Array Configuration
- Fixed
- Single-Axis Tracking
Segmentation 2: by Photovoltaic Technology
- Monofacial Solar Panels
- Bifacial Solar Panels
- Translucent Photovoltaic Technology
- Others
Segmentation 3: by Site of Installation
- Grassland Farming
- Horticulture and Arable Farming
- Indoor Farming
- Pollinator Habitat
Segmentation 4: by Country
- China
- Japan
- India
- South Korea
- Rest-of-Asia-Pacific
How can this report add value to an organization?
Product/Innovation Strategy: The product segment helps the reader understand the different applications of agrivoltaics products in the market. The market is poised for significant expansion with ongoing technological advancements, increased investments, and growing awareness of the use of agrivoltaics. Therefore, agrivoltaics are a high-investment and high-revenue generating model.
Growth/Marketing Strategy: The apac agrivoltaics market is growing at a rapid pace. The market offers enormous opportunities for existing and emerging market players. Some of the strategies covered in this segment are mergers and acquisitions, product launches, partnerships and collaborations, business expansions, and investments. The strategies preferred by companies to maintain and strengthen their market position primarily include partnerships and collaborations.
Competitive Strategy: The key players in the apac agrivoltaics market analyzed and profiled in the study include agrivoltaics projects. Additionally, a comprehensive competitive landscape such as partnerships, agreements, and collaborations are expected to aid the reader in understanding the untapped revenue pockets in the market.
Table of Contents
Executive Summary
Scope and Definition
1 Markets
- 1.1 Trends: Current and Future Impact Assessment
- 1.1.1 Potential for Rural Electric Vehicle Charging
- 1.1.2 Increasing Demand for Renewable Energy
- 1.2 Supply Chain Overview
- 1.2.1 Value Chain Analysis
- 1.3 Research and Development Review
- 1.3.1 Patent Filing Trend (by Company)
- 1.3.2 Patent Filing Trend (by Country)
- 1.4 Regulatory Landscape
- 1.5 Market Dynamics Overview
- 1.5.1 Market Drivers
- 1.5.1.1 Dual-Revenue Streams for Farmers
- 1.5.1.2 Agrivoltaics as a Sustainable Solution for Agriculture
- 1.5.2 Market Restraints
- 1.5.2.1 High Installation Costs
- 1.5.2.2 Limited Compatibility to Certain Crops
- 1.5.3 Market Opportunities
- 1.5.3.1 Reduced Emissions through Improved Farm Electrification
- 1.5.3.2 Increased Government Initiatives to Boost R&D in Agrivoltaics
- 1.5.1 Market Drivers
2 Regions
- 2.1 Regional Summary
- 2.2 Asia-Pacific
- 2.2.1 Regional Overview
- 2.2.2 Driving Factors for Market Growth
- 2.2.3 Factors Challenging the Market
- 2.2.4 Product
- 2.2.5 China
- 2.2.6 India
- 2.2.7 Japan
- 2.2.8 South Korea
- 2.2.9 Rest-of-Asia-Pacific
3 Markets - Competitive Benchmarking & Company Profiles
- 3.1 Next Frontiers
- 3.2 Geographic Assessment
- 3.2.1 Jinko Solar
- 3.2.1.1 Overview
- 3.2.1.2 Top Project Portfolio
- 3.2.1.3 Top Competitors
- 3.2.1.4 Target Customers
- 3.2.1.5 Key Personnel
- 3.2.1.6 Analyst View
- 3.2.1.7 Market Share, 2023
- 3.2.2 Trinasolar
- 3.2.2.1 Overview
- 3.2.2.2 Top Project Portfolio
- 3.2.2.3 Top Competitors
- 3.2.2.4 Target Customers
- 3.2.2.5 Key Personnel
- 3.2.2.6 Analyst View
- 3.2.2.7 Market Share, 2023
- 3.2.3 Yingli Solar
- 3.2.3.1 Overview
- 3.2.3.2 Top Project Portfolio
- 3.2.3.3 Top Competitors
- 3.2.3.4 Target Customers
- 3.2.3.5 Key Personnel
- 3.2.3.6 Analyst View
- 3.2.3.7 Market Share,2023
- 3.2.1 Jinko Solar
4 Research Methodology
- 4.1 Data Sources
- 4.1.1 Primary Data Sources
- 4.1.2 Secondary Data Sources
- 4.1.3 Data Triangulation
- 4.2 Market Estimation and Forecast
