|
|
市場調査レポート
商品コード
1532311
電気バス市場- 世界および地域別分析:用途別、推進力別、バッテリータイプ別、バスの長さ別、座席数別、自律走行レベル別、航続距離別、バッテリー容量別、モーター出力別、充電方式別、地域別 - 分析と予測(2024年~2034年)Electric Bus Market - A Global and Regional Analysis: Focus on Application, Propulsion, Battery Type, Length of Bus, Seating Capacity, Level of Autonomy, Range, Battery Capacity, Power Output, Charging Type, and Region - Analysis and Forecast, 2024-2034 |
||||||
|
|||||||
カスタマイズ可能
|
|||||||

| 電気バス市場- 世界および地域別分析:用途別、推進力別、バッテリータイプ別、バスの長さ別、座席数別、自律走行レベル別、航続距離別、バッテリー容量別、モーター出力別、充電方式別、地域別 - 分析と予測(2024年~2034年) |
|
出版日: 2024年08月13日
発行: BIS Research
ページ情報: 英文 120 Pages
納期: 1~5営業日
|

全表示
- 概要
- 目次
電気バス市場は、都市部が持続可能で効率的な輸送ソリューションを求める中、世界中で急速に普及しています。
従来の化石燃料ではなく電気を動力源とする電気バスは、温室効果ガスの排出削減、運行コストの削減、静かな運行など、数多くの利点を提供します。こうした利点から、電気バスは、環境の持続可能性を高め、都市の大気質の改善を目指す公共交通システムにとって魅力的な選択肢となっています。楽観的な予測では、電気バスの市場規模は、2024年に159億米ドルとなり、15.14%のCAGRで拡大し、2034年には651億米ドルに達すると予測されています。
| 主要市場統計 | |
|---|---|
| 予測期間 | 2024年~2034年 |
| 2024年の評価 | 159億米ドル |
| 2034年の予測 | 651億米ドル |
| CAGR | 15.14% |
電気バス市場成長の主な促進要因のひとつは、世界各国政府による厳しい環境規制の実施が増加していることです。例えば、欧州連合(EU)のクリーン・ビークル指令は、公共機関が購入する新型バスの一定割合を、電気バスを含む低排出ガス車またはゼロ・エミッション車とすることを義務付けています。同様に米国では、連邦運輸局(FTA)の低排出ガス車・無排出ガス車プログラム(Low or No Emission Vehicle Program)が、電気バスとそれを支えるインフラを購入するための資金を運輸機関に提供しています。FTAによると、2020年だけで1億8,000万米ドル以上が、全米での低排出バスの導入を支援するために割り当てられました。こうした取り組みは、財政的インセンティブと規制上の支援を提供することで、ディーゼルエンジンバスから電気バスへの移行を推進しています。
同市場では、電気バスの普及に不可欠な充電インフラにも多額の投資が行われています。例えば、中国政府はこの取り組みの最前線に立っており、交通運輸省は急速に増加する電気バス車両をサポートするため、2025年までに60万カ所以上の充電ステーションを設置することを目指しています。欧州では、欧州投資銀行(EIB)がパリやアムステルダムなどの都市に多額の融資を行い、電気バス用の大規模な充電ネットワークを整備しています。
当レポートでは、世界の電気バス市場について調査し、市場の概要とともに、用途別、推進力別、バッテリータイプ別、バスの長さ別、座席数別、自律走行レベル別、航続距離別、バッテリー容量別、モーター出力別、充電方式別、地域別の動向、および市場に参入する企業のプロファイルなどを提供しています。
目次
エグゼクティブサマリー
第1章 市場:業界の展望
- 動向:現在および将来の影響評価
- サプライチェーンの概要
- R&Dレビュー
- 規制状況
- ステークホルダー分析
- 主要な世界的イベントの影響分析
- 市場力学の概要
第2章 電気バス市場(用途別)
- 用途のセグメンテーション
- 用途の概要
- 電気バス市場(タイプ別)
- 電気バス市場(推進力別)
第3章 電気バス市場(製品別)
- 製品セグメンテーション
- 製品概要
- 電気バス市場(バッテリータイプ別)
- 電気バス市場(バスの長さ別)
- 電気バス市場(座席数別)
- 電気バス市場(自律走行レベル別)
- 電気バス市場(航続距離別)
- 電気バス市場(バッテリー容量別)
- 電気バス市場(モーター出力別)
- 電気バス市場(充電方式別)
第4章 電気バス市場(地域別)
- 電気バス市場(地域別)
- 北米
- 欧州
- アジア太平洋
- その他の地域
第5章 企業プロファイル
- 今後の見通し
- 地理的評価
- BYD Company Ltd.
- Proterra, Inc.
- AB Volvo
- Daimler AG
- Scania AB
- Iveco
- VDL Groep bv
- NFI Group
- Xiamen King Long United Automotive Industry Co., Ltd.
- Yutong Bus Co., Ltd.
- TATA Motors
- Ebusco
- JBM Group
- Ashok Leyland
- Blue Bird Corporation
- その他
第6章 調査手法
Introduction to the Electric Bus Market
The electric bus market has been rapidly gaining traction worldwide as urban areas seek sustainable and efficient transportation solutions. Electric buses, powered by electricity rather than traditional fossil fuels, offer numerous benefits, including reduced greenhouse gas emissions, lower operational costs, and quieter operation. These advantages make electric buses an attractive option for public transportation systems aiming to enhance environmental sustainability and improve urban air quality. In an optimistic forecast, the market, valued at $15.90 billion in 2024, is projected to grow at a CAGR of 15.14%, reaching $65.10 billion by 2034.
| KEY MARKET STATISTICS | |
|---|---|
| Forecast Period | 2024 - 2034 |
| 2024 Evaluation | $15.90 Billion |
| 2034 Forecast | $65.10 Billion |
| CAGR | 15.14% |
One of the key drivers behind the growth of the electric bus market has been the increasing implementation of stringent environmental regulations by governments globally. For instance, the European Union's Clean Vehicle Directive mandates that a certain percentage of new buses purchased by public authorities must be low-emission or zero-emission vehicles, including electric buses. Similarly, in the U.S., the Federal Transit Administration's (FTA) Low or No Emission Vehicle Program provides funding to transit agencies to purchase electric buses and supporting infrastructure. According to the FTA, over $180 million was allocated in 2020 alone to support the adoption of low-emission buses across the country. These initiatives are propelling the transition from diesel-powered buses to electric ones by providing financial incentives and regulatory support.
The market is also witnessing substantial investments in charging infrastructure, which is crucial for the widespread deployment of electric buses. The Chinese government, for example, has been at the forefront of this effort, with the Ministry of Transport aiming to install over 600,000 charging stations by 2025 to support its rapidly growing electric bus fleet. In Europe, the European Investment Bank (EIB) has provided significant loans to cities such as Paris and Amsterdam to develop extensive charging networks for electric buses.
Moreover, the electric bus market has been characterized by innovation and technological advancements. Manufacturers are continually enhancing the design and performance of electric buses, focusing on aspects such as battery longevity, energy efficiency, and passenger comfort. The introduction of autonomous driving features and smart grid integration are also shaping the future of the market. For example, the California Air Resources Board (CARB) has set a target for all public transit agencies in California to transition to 100% zero-emission buses by 2040, encouraging technological innovation in the sector. As cities around the world continue to prioritize sustainable urban mobility, the electric bus market is poised for significant expansion, playing a pivotal role in the transformation of public transportation systems.
Market Segmentation
Segmentation 1: by Type
- City/Transit Buses
- Coaches
- Midibus
- School Bus
- Others
Segmentation 2: by Propulsion
- Battery Electric Vehicles (BEVs)
- Fuel Cell Electric Vehicles (FCEVs)
- Others
Segmentation 3: by Battery Type
- Lithium-ion Batteries
- Lithium Iron Phosphate Batteries (LFP)
- Lithium Nickel Manganese Cobalt Oxide Batteries (NMC)
- Lithium Nickel Cobalt Aluminum Oxide Batteries (NCA)
- Others
Segmentation 4: by Length of Bus
- Upto 9 m
- 10-14 m
- Above 14 m
Segmentation 5: by Seating Capacity
- Upto 40 Seats
- 41-70 Seats
- Above 70 Seats
Segmentation 6: by Level of Autonomy
- Semi-Autonomous
- Autonomous
Segmentation 7: by Range
- Upto 200 Miles
- Above 200 Miles
Segmentation 8: by Battery Capacity
- Upto 400 kWh
- Above 400 kWh
Segmentation 9: by Power Output
- Upto 250 Kw
- Above 250 Kw
Segmentation 10: by Charging Type
- Plug-in Charging
- Inductive Charging
- Overhead Charging
- In-Depot Charging
Segmentation 11: by Region
- North America
- Europe
- Asia-Pacific
- Rest-of-the-World
How Can This Report Add Value to an Organization?
Product/Innovation Strategy: The global electric bus market has been extensively segmented based on various categories, such as type, propulsion, battery type, length of bus, seating capacity, level of autonomy, range, battery capacity, power output, and charging type. This can help readers get a clear overview of which segments account for the largest share and which ones are well-positioned to grow in the coming years.
Competitive Strategy: A detailed competitive benchmarking of the players operating in the global electric bus market has been done to help the reader understand how players stack against each other, presenting a clear market landscape. Additionally, comprehensive competitive strategies such as partnerships, agreements, and collaborations will aid the reader in understanding the untapped revenue pockets in the market.
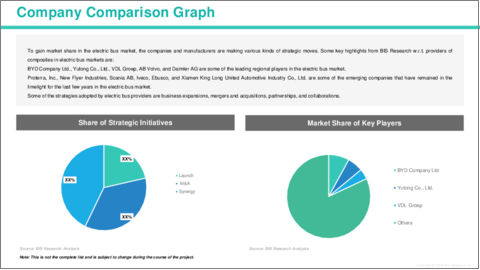
Key Market Players and Competition Synopsis
The companies that are profiled have been selected based on thorough secondary research, which includes analyzing company coverage, product portfolio, market penetration, and insights gathered from primary experts.
Some of the prominent companies in this market are:
- BYD Company Ltd.
- Proterra, Inc.
- AB Volvo
- VDL Groep bv
- NFI Group
- Yutong Bus Co., Ltd.
- TATA Motors
- Ashok Leyland
Key Questions Answered in this Report:
- What are the main factors driving the demand for the electric bus market?
- What are the major patents filed by the companies active in the electric bus market?
- Who are the key players in theelectric bus market, and what are their respective market shares?
- What partnerships or collaborations are prominent among stakeholders in the electric bus market?
- What are the strategies adopted by the key companies to gain a competitive edge in the electric bus market?
- What is the futuristic outlook for the electric bus market in terms of growth potential?
- What is the current estimation of the electric bus market, and what growth trajectory is projected from 2024 to 2034?
- Which application and product segment is expected to lead the market over the forecast period (2024-2034)?
- Which regions demonstrate the highest adoption rates forthe electric bus market, and what factors contribute to their leadership?
Table of Contents
Executive Summary
Scope and Definition
Market/Product Definition
Key Questions Answered
Analysis and Forecast Note
1. Markets: Industry Outlook
- 1.1 Trends: Current and Future Impact Assessment
- 1.2 Supply Chain Overview
- 1.2.1 Value Chain Analysis
- 1.2.2 Pricing Forecast
- 1.3 R&D Review
- 1.3.1 Patent Filing Trend by Country, by Company
- 1.4 Regulatory Landscape
- 1.5 Stakeholder Analysis
- 1.5.1 Use Case
- 1.5.2 End User and Buying Criteria
- 1.6 Impact Analysis for Key Global Events
- 1.7 Market Dynamics Overview
- 1.7.1 Market Drivers
- 1.7.2 Market Restraints
- 1.7.3 Market Opportunities
2. Electric Bus Market (by Application)
- 2.1 Application Segmentation
- 2.2 Application Summary
- 2.3 Electric Bus Market (by Type)
- 2.3.1 City/Transit Buses
- 2.3.2 Coaches
- 2.3.3 Midibus
- 2.3.4 School Bus
- 2.3.5 Others
- 2.4 Electric Bus Market (by Propulsion)
- 2.4.1 Battery Electric Vehicles (BEVs)
- 2.4.2 Fuel Cell Electric Vehicles (FCEVs)
- 2.4.3 Others
3. Electric Bus Market (by Product)
- 3.1 Product Segmentation
- 3.2 Product Summary
- 3.3 Electric Bus Market (by Battery Type)
- 3.3.1 Lithium-ion Batteries
- 3.3.1.1 Lithium Iron Phosphate Batteries (LFP)
- 3.3.1.2 Lithium Nickel Manganese Cobalt Oxide Batteries (NMC)
- 3.3.1.3 Lithium Nickel Cobalt Aluminum Oxide Batteries (NCA)
- 3.3.1.4 Others
- 3.3.2 Other Batteries
- 3.3.1 Lithium-ion Batteries
- 3.4 Electric Bus Market (by Length of Bus)
- 3.4.1 Upto 9 m
- 3.4.2 10-14 m
- 3.4.3 Above 14 m
- 3.5 Electric Bus Market (by Seating Capacity)
- 3.5.1 Upto 40 Seats
- 3.5.2 41-70 Seats
- 3.5.3 Above 70 Seats
- 3.6 Electric Bus Market (by Level of Autonomy)
- 3.6.1 Semi-autonomous
- 3.6.2 Autonomous
- 3.7 Electric Bus Market (by Range)
- 3.7.1 Upto 200 Miles
- 3.7.2 Above 200 Miles
- 3.8 Electric Bus Market (by Battery Capacity)
- 3.8.1 Upto 400 kWh
- 3.8.2 Above 400 kWh
- 3.9 Electric Bus Market (by Motor Power Output)
- 3.9.1 Upto 250 Kw
- 3.9.2 Above 250 Kw
- 3.10 Electric Bus Market (by Charging Type)
- 3.10.1 Plug-in Charging
- 3.10.2 Inductive Charging
- 3.10.3 Overhead Charging
- 3.10.4 In-Depot Charging
4. Electric Bus Market (by Region)
- 4.1 Electric Bus Market (by Region)
- 4.2 North America
- 4.2.1 Regional Overview
- 4.2.2 Driving Factors for Market Growth
- 4.2.3 Factors Challenging the Market
- 4.2.4 Application
- 4.2.5 Product
- 4.2.6 U.S.
- 4.2.6.1 Market by Application
- 4.2.6.2 Market by Product
- 4.2.7 Canada
- 4.2.7.1 Market by Application
- 4.2.7.2 Market by Product
- 4.2.8 Mexico
- 4.2.8.1 Market by Application
- 4.2.8.2 Market by Product
- 4.3 Europe
- 4.3.1 Regional Overview
- 4.3.2 Driving Factors for Market Growth
- 4.3.3 Factors Challenging the Market
- 4.3.4 Application
- 4.3.5 Product
- 4.3.6 Germany
- 4.3.6.1 Market by Application
- 4.3.6.2 Market by Product
- 4.3.7 France
- 4.3.7.1 Market by Application
- 4.3.7.2 Market by Product
- 4.3.8 Spain
- 4.3.8.1 Market by Application
- 4.3.8.2 Market by Product
- 4.3.9 U.K.
- 4.3.9.1 Market by Application
- 4.3.9.2 Market by Product
- 4.3.10 Italy
- 4.3.10.1 Market by Application
- 4.3.10.2 Market by Product
- 4.3.11 Sweden
- 4.3.11.1 Market by Application
- 4.3.11.2 Market by Product
- 4.3.12 Netherlands
- 4.3.12.1 Market by Application
- 4.3.12.2 Market by Product
- 4.3.13 Poland
- 4.3.13.1 Market by Application
- 4.3.13.2 Market by Product
- 4.3.14 Rest-of-Europe
- 4.3.14.1 Market by Application
- 4.3.14.2 Market by Product
- 4.4 Asia-Pacific
- 4.4.1 Regional Overview
- 4.4.2 Driving Factors for Market Growth
- 4.4.3 Factors Challenging the Market
- 4.4.4 Application
- 4.4.5 Product
- 4.4.6 China
- 4.4.6.1 Market by Application
- 4.4.6.2 Market by Product
- 4.4.7 Japan
- 4.4.7.1 Market by Application
- 4.4.7.2 Market by Product
- 4.4.8 India
- 4.4.8.1 Market by Application
- 4.4.8.2 Market by Product
- 4.4.9 South Korea
- 4.4.9.1 Market by Application
- 4.4.9.2 Market by Product
- 4.4.10 Australia
- 4.4.10.1 Market by Application
- 4.4.10.2 Market by Product
- 4.4.11 Rest-of-Asia-Pacific
- 4.4.11.1 Market by Application
- 4.4.11.2 Market by Product
- 4.5 Rest-of-the-World
- 4.5.1 Regional Overview
- 4.5.2 Driving Factors for Market Growth
- 4.5.3 Factors Challenging the Market
- 4.5.4 Application
- 4.5.5 Product
- 4.5.6 South America
- 4.5.6.1 Market by Application
- 4.5.6.2 Market by Product
- 4.5.7 Middle East and Africa
- 4.5.7.1 Market by Application
- 4.5.7.2 Market by Product
5. Companies Profiled
- 5.1 Next Frontiers
- 5.2 Geographic Assessment
- 5.2.1 BYD Company Ltd.
- 5.2.1.1 Overview
- 5.2.1.2 Top Products/Product Portfolio
- 5.2.1.3 Top Competitors
- 5.2.1.4 Target Customers
- 5.2.1.5 Key Personnel
- 5.2.1.6 Analyst View
- 5.2.1.7 Market Share
- 5.2.2 Proterra, Inc.
- 5.2.2.1 Overview
- 5.2.2.2 Top Products/Product Portfolio
- 5.2.2.3 Top Competitors
- 5.2.2.4 Target Customers
- 5.2.2.5 Key Personnel
- 5.2.2.6 Analyst View
- 5.2.2.7 Market Share
- 5.2.3 AB Volvo
- 5.2.3.1 Overview
- 5.2.3.2 Top Products/Product Portfolio
- 5.2.3.3 Top Competitors
- 5.2.3.4 Target Customers
- 5.2.3.5 Key Personnel
- 5.2.3.6 Analyst View
- 5.2.3.7 Market Share
- 5.2.4 Daimler AG
- 5.2.4.1 Overview
- 5.2.4.2 Top Products/Product Portfolio
- 5.2.4.3 Top Competitors
- 5.2.4.4 Target Customers
- 5.2.4.5 Key Personnel
- 5.2.4.6 Analyst View
- 5.2.4.7 Market Share
- 5.2.5 Scania AB
- 5.2.5.1 Overview
- 5.2.5.2 Top Products/Product Portfolio
- 5.2.5.3 Top Competitors
- 5.2.5.4 Target Customers
- 5.2.5.5 Key Personnel
- 5.2.5.6 Analyst View
- 5.2.5.7 Market Share
- 5.2.6 Iveco
- 5.2.6.1 Overview
- 5.2.6.2 Top Products/Product Portfolio
- 5.2.6.3 Top Competitors
- 5.2.6.4 Target Customers
- 5.2.6.5 Key Personnel
- 5.2.6.6 Analyst View
- 5.2.6.7 Market Share
- 5.2.7 VDL Groep bv
- 5.2.7.1 Overview
- 5.2.7.2 Top Products/Product Portfolio
- 5.2.7.3 Top Competitors
- 5.2.7.4 Target Customers
- 5.2.7.5 Key Personnel
- 5.2.7.6 Analyst View
- 5.2.7.7 Market Share
- 5.2.8 NFI Group
- 5.2.8.1 Overview
- 5.2.8.2 Top Products/Product Portfolio
- 5.2.8.3 Top Competitors
- 5.2.8.4 Target Customers
- 5.2.8.5 Key Personnel
- 5.2.8.6 Analyst View
- 5.2.8.7 Market Share
- 5.2.9 Xiamen King Long United Automotive Industry Co., Ltd.
- 5.2.9.1 Overview
- 5.2.9.2 Top Products/Product Portfolio
- 5.2.9.3 Top Competitors
- 5.2.9.4 Target Customers
- 5.2.9.5 Key Personnel
- 5.2.9.6 Analyst View
- 5.2.9.7 Market Share
- 5.2.10 Yutong Bus Co., Ltd.
- 5.2.10.1 Overview
- 5.2.10.2 Top Products/Product Portfolio
- 5.2.10.3 Top Competitors
- 5.2.10.4 Target Customers
- 5.2.10.5 Key Personnel
- 5.2.10.6 Analyst View
- 5.2.10.7 Market Share
- 5.2.11 TATA Motors
- 5.2.11.1 Overview
- 5.2.11.2 Top Products/Product Portfolio
- 5.2.11.3 Top Competitors
- 5.2.11.4 Target Customers
- 5.2.11.5 Key Personnel
- 5.2.11.6 Analyst View
- 5.2.11.7 Market Share
- 5.2.12 Ebusco
- 5.2.12.1 Overview
- 5.2.12.2 Top Products/Product Portfolio
- 5.2.12.3 Top Competitors
- 5.2.12.4 Target Customers
- 5.2.12.5 Key Personnel
- 5.2.12.6 Analyst View
- 5.2.12.7 Market Share
- 5.2.13 JBM Group
- 5.2.13.1 Overview
- 5.2.13.2 Top Products/Product Portfolio
- 5.2.13.3 Top Competitors
- 5.2.13.4 Target Customers
- 5.2.13.5 Key Personnel
- 5.2.13.6 Analyst View
- 5.2.13.7 Market Share
- 5.2.14 Ashok Leyland
- 5.2.14.1 Overview
- 5.2.14.2 Top Products/Product Portfolio
- 5.2.14.3 Top Competitors
- 5.2.14.4 Target Customers
- 5.2.14.5 Key Personnel
- 5.2.14.6 Analyst View
- 5.2.14.7 Market Share
- 5.2.15 Blue Bird Corporation
- 5.2.15.1 Overview
- 5.2.15.2 Top Products/Product Portfolio
- 5.2.15.3 Top Competitors
- 5.2.15.4 Target Customers
- 5.2.15.5 Key Personnel
- 5.2.15.6 Analyst View
- 5.2.15.7 Market Share
- 5.2.16 Others
- 5.2.1 BYD Company Ltd.

