|
|
市場調査レポート
商品コード
1492696
ブルーアンモニア市場- 世界および地域別分析:用途別、製品別、地域別 - 分析と予測(2024年~2034年)Blue Ammonia Market - A Global and Regional Analysis: Focus on Application, Technology, and Region - Analysis and Forecast, 2024-2034 |
||||||

|
|||||||
カスタマイズ可能
|
|||||||


| ブルーアンモニア市場- 世界および地域別分析:用途別、製品別、地域別 - 分析と予測(2024年~2034年) |
|
出版日: 2024年06月12日
発行: BIS Research
ページ情報: 英文 100 Pages
納期: 1~5営業日
|

全表示
- 概要
- 目次
ブルーアンモニア市場は、脱炭素化に向けた世界の後押しが勢いを増すにつれて、関心と投資が急増しています。
炭素回収・貯留(CCS)技術によって水素をアンモニアに変換して得られるブルーアンモニアは、持続可能なエネルギーの未来への移行において極めて重要な要素です。気候変動に対する懸念が高まり、温室効果ガスの排出を削減する必要性が高まる中、ブルーアンモニアは、さまざまな産業でカーボンフットプリントを大幅に抑制する可能性があるため、有望なソリューションとして浮上しています。楽観的な予測では、ブルーアンモニアの市場規模は、2024年に4億3,890万米ドルとなり、今後44.89%のCAGRで拡大し、2034年には178億9,220万米ドルに達すると予測されています。
| 主要市場統計 | |
|---|---|
| 予測期間 | 2024年~2034年 |
| 2024年評価 | 4億3,890万米ドル |
| 2034年予測 | 178億9,220万米ドル |
| CAGR | 44.89% |
例えば、日本やノルウェーなどの国々は、水素経済における世界的リーダーとしての地位を確立することを目指し、野心的な水素戦略を発表しています。2050年までにカーボンニュートラルを達成するという日本のコミットメントには、ブルーアンモニア生産を含む水素技術への重点的な取り組みが含まれています。同様に、膨大な洋上風力資源とCCS技術へのコミットメントを持つノルウェーは、ブルーアンモニアを重要な輸出商品とみなし、エネルギー集約型産業を脱炭素化する手段としています。
さらに、ブルーアンモニア市場の牽引力が高まっていることを裏付けているのが、業界関係者間の協力関係です。エネルギー企業、技術開発者、研究機関のパートナーシップは、技術革新を推進し、ブルーアンモニア生産の規模を拡大しています。例えば、エネルギー大手とエンジニアリング企業との提携は、アンモニア生産に合わせた効率的な炭素回収技術の開発に重点を置いています。こうしたパートナーシップは、技術的進歩を加速させるだけでなく、世界のエネルギー情勢におけるブルーアンモニアの可能性の実現に向けた集団的コミットメントを示すものでもあります。
さらに、クリーン・エネルギー・キャリアとしてのブルーアンモニアの多用途性は、多様な分野での需要に燃料を供給します。発電用の低炭素燃料から持続可能な肥料生産用の原料まで、ブルーアンモニアは多面的な用途を提供します。事業の脱炭素化を目指す産業界は、従来の化石燃料に代わる実行可能な選択肢として、ブルーアンモニアへの関心を高めています。こうした需要の高まりは、市場の拡大の可能性を明確にし、より環境に優しく持続可能な未来への移行を推進する上でブルーアンモニアが果たす役割を裏付けています。
当レポートでは、世界のブルーアンモニア市場について調査し、市場の概要とともに、用途別、製品別、地域別の動向、および市場に参入する企業のプロファイルなどを提供しています。
目次
エグゼクティブサマリー
第1章 市場:業界の見通し
- 動向:現在および将来の影響評価
- サプライチェーンの概要
- R&Dレビュー
- 規制状況
- ステークホルダー分析
- 主要な世界的イベントの影響分析
- 市場力学の概要
第2章 ブルーアンモニア市場(用途別)
- 用途のセグメンテーション
- 用途の概要
- ブルーアンモニア市場(用途別)
第3章 ブルーアンモニア市場(製品別)
- 製品セグメンテーション
- 製品概要
- ブルーアンモニア市場(技術別)
第4章 ブルーアンモニア市場(地域別)
- ブルーアンモニア市場(地域別)
- 北米
- 欧州
- アジア太平洋
- その他の地域
第5章 企業プロファイル
- 今後の見通し
- 地理的評価
- Yara International ASA
- Saudi Arabian Oil Co.
- OCI
- CF Industries Holdings, Inc.
- Ma'aden
- Qatar Fertiliser Company
- Shell Plc
- ExxonMobil Corporation
- Linde Plc
- Nutrien Ltd.
- Uniper SE
- ADNOC Group
- LSB Industries
- Eurochem Group
- Pao Novatek
- その他
第6章 調査手法
Introduction to Blue Ammonia Market
The blue ammonia market is experiencing a surge in interest and investment as the global push towards decarbonization gains momentum. Blue ammonia, derived from converting hydrogen into ammonia with carbon capture and storage (CCS) technology, represents a crucial component in the transition towards a sustainable energy future. Amid growing concerns over climate change and the need to reduce greenhouse gas emissions, blue ammonia emerges as a promising solution due to its potential to significantly curb carbon footprints across various industries. In an optimistic forecast, the market, valued at $438.9 million in 2024, is anticipated to grow at a CAGR of 44.89%, reaching $17,892.2 million by 2034.
| KEY MARKET STATISTICS | |
|---|---|
| Forecast Period | 2024 - 2034 |
| 2024 Evaluation | $438.9 Million |
| 2034 Forecast | $17,892.2 Million |
| CAGR | 44.89% |
For instance, countries such as Japan and Norway have announced ambitious hydrogen strategies, aiming to establish themselves as global leaders in the hydrogen economy. Japan's commitment to carbon neutrality by 2050 includes a substantial focus on hydrogen technologies, including blue ammonia production. Similarly, Norway, with its vast offshore wind resources and commitment to CCS technology, sees blue ammonia as a key export commodity and a means to decarbonize its energy-intensive industries.
Moreover, collaborations between industry players underscore the increasing traction of the Blue Ammonia Market. Partnerships between energy companies, technology developers, and research institutions are driving innovation and scaling up blue ammonia production. For example, collaborations between energy giants and engineering firms are focused on developing efficient carbon capture technologies tailored for ammonia production. These partnerships not only accelerate technological advancements but also signal a collective commitment towards realizing the potential of blue ammonia in the global energy landscape.
Furthermore, the versatility of blue ammonia as a clean energy carrier fuel its demand across diverse sectors. From serving as a low-carbon fuel for power generation to a feedstock for sustainable fertilizer production, blue ammonia offers multifaceted applications. Industries seeking to decarbonize their operations are increasingly turning to blue ammonia as a viable alternative to traditional fossil fuels. This growing demand underscores the market's potential for expansion and underscores its role in driving the transition towards a greener, more sustainable future.
Market Segmentation
Segmentation 1: by Application
- Transportation
- Power Generation
- Industrial Feedstock
Segmentation 2: by Technology
- Steam Methane Reforming
- Autothermal Reforming
- Gas partial Oxidation
Segmentation 3: by Region
- North America
- Europe
- Asia-Pacific
- Rest-of-the-World
How can this report add value to an organization?
Product/Innovation Strategy: The global blue ammonia market has been extensively segmented based on various categories, such as application, technology, and region. This can help readers get a clear overview of which segments account for the largest share and which ones are well-positioned to grow in the coming years.
Competitive Strategy: A detailed competitive benchmarking of the players operating in the global blue ammonia market has been done to help the reader understand how players stack against each other, presenting a clear market landscape. Additionally, comprehensive competitive strategies such as partnerships, agreements, and collaborations will aid the reader in understanding the untapped revenue pockets in the market.
Key Market Players and Competition Synopsis
The companies that are profiled have been selected based on thorough secondary research, which includes analyzing company coverage, product portfolio, market penetration, and insights gathered from primary experts.
Some of the prominent companies in this market are:
- Yara International ASA
- Saudi Arabian Oil Co.
- OCI
- CF Industries Holdings, Inc.
Key Questions Answered in this Report:
- What are the main factors driving the demand for blue ammonia market?
- What are the major patents filed by the companies active in the blue ammonia market?
- Who are the key players in theblue ammonia market, and what are their respective market shares?
- What partnerships or collaborations are prominent among stakeholders in the blue ammonia market?
- What are the strategies adopted by the key companies to gain a competitive edge in blue ammonia market?
- What is the futuristic outlook for the blue ammonia market in terms of growth potential?
- What is the current estimation of the blue ammonia market and what growth trajectory is projected from 2024 to 2034?
- Which application, and product segment is expected to lead the market over the forecast period (2024-2034)?
- Which regions demonstrate the highest adoption rates forblue ammonia market, and what factors contribute to their leadership?
Table of Contents
Executive Summary
Scope and Definition
Market/Product Definition
Key Questions Answered
Analysis and Forecast Note
1. Markets: Industry Outlook
- 1.1 Trends: Current and Future Impact Assessment
- 1.2 Supply Chain Overview
- 1.2.1 Value Chain Analysis
- 1.2.2 Pricing Forecast
- 1.3 R&D Review
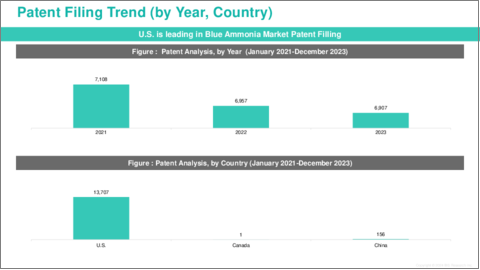
- 1.3.1 Patent Filing Trend by Country, by Company
- 1.4 Regulatory Landscape
- 1.5 Stakeholder Analysis
- 1.5.1 Use Case
- 1.5.2 End User and Buying Criteria
- 1.6 Impact Analysis for Key Global Events
- 1.7 Market Dynamics Overview
- 1.7.1 Market Drivers
- 1.7.2 Market Restraints
- 1.7.3 Market Opportunities
2. Blue Ammonia Market (by Application)
- 2.1 Application Segmentation
- 2.2 Application Summary
- 2.3 Blue Ammonia Market (by Application)
- 2.3.1 Transportation
- 2.3.2 Power Generation
- 2.3.3 Industrial Feedstock
3. Blue Ammonia Market (by Product)
- 3.1 Product Segmentation
- 3.2 Product Summary
- 3.3 Blue Ammonia Market (by Technology)
- 3.3.1 Steam methane reforming
- 3.3.2 Autothermal reforming
- 3.3.3 Gas partial oxidation
4. Blue Ammonia Market (by Region)
- 4.1 Blue Ammonia Market (by Region)
- 4.2 North America
- 4.2.1 Regional Overview
- 4.2.2 Driving Factors for Market Growth
- 4.2.3 Factors Challenging the Market
- 4.2.4 Application
- 4.2.5 Product
- 4.2.6 U.S.
- 4.2.6.1 Market by Application
- 4.2.6.2 Market by Product
- 4.2.7 Canada
- 4.2.7.1 Market by Application
- 4.2.7.2 Market by Product
- 4.2.8 Mexico
- 4.2.8.1 Market by Application
- 4.2.8.2 Market by Product
- 4.3 Europe
- 4.3.1 Regional Overview
- 4.3.2 Driving Factors for Market Growth
- 4.3.3 Factors Challenging the Market
- 4.3.4 Application
- 4.3.5 Product
- 4.3.6 Germany
- 4.3.6.1 Market by Application
- 4.3.6.2 Market by Product
- 4.3.7 France
- 4.3.7.1 Market by Application
- 4.3.7.2 Market by Product
- 4.3.8 Netherlands
- 4.3.8.1 Market by Application
- 4.3.8.2 Market by Product
- 4.3.9 U.K.
- 4.3.9.1 Market by Application
- 4.3.9.2 Market by Product
- 4.3.10 Italy
- 4.3.10.1 Market by Application
- 4.3.10.2 Market by Product
- 4.3.11 Rest-of-Europe
- 4.3.11.1 Market by Application
- 4.3.11.2 Market by Product
- 4.4 Asia-Pacific
- 4.4.1 Regional Overview
- 4.4.2 Driving Factors for Market Growth
- 4.4.3 Factors Challenging the Market
- 4.4.4 Application
- 4.4.5 Product
- 4.4.6 China
- 4.4.6.1 Market by Application
- 4.4.6.2 Market by Product
- 4.4.7 Japan
- 4.4.7.1 Market by Application
- 4.4.7.2 Market by Product
- 4.4.8 India
- 4.4.8.1 Market by Application
- 4.4.8.2 Market by Product
- 4.4.9 South Korea
- 4.4.9.1 Market by Application
- 4.4.9.2 Market by Product
- 4.4.10 Rest-of-Asia-Pacific
- 4.4.10.1 Market by Application
- 4.4.10.2 Market by Product
- 4.5 Rest-of-the-World
- 4.5.1 Regional Overview
- 4.5.2 Driving Factors for Market Growth
- 4.5.3 Factors Challenging the Market
- 4.5.4 Application
- 4.5.5 Product
- 4.5.6 South America
- 4.5.6.1 Market by Application
- 4.5.6.2 Market by Product
- 4.5.7 Middle East and Africa
- 4.5.7.1 Market by Application
- 4.5.7.2 Market by Product
5. Companies Profiled
- 5.1 Next Frontiers
- 5.2 Geographic Assessment
- 5.2.1 Yara International ASA
- 5.2.1.1 Overview
- 5.2.1.2 Top Products/Product Portfolio
- 5.2.1.3 Top Competitors
- 5.2.1.4 Target Customers
- 5.2.1.5 Key Personnel
- 5.2.1.6 Analyst View
- 5.2.1.7 Market Share
- 5.2.2 Saudi Arabian Oil Co.
- 5.2.2.1 Overview
- 5.2.2.2 Top Products/Product Portfolio
- 5.2.2.3 Top Competitors
- 5.2.2.4 Target Customers
- 5.2.2.5 Key Personnel
- 5.2.2.6 Analyst View
- 5.2.2.7 Market Share
- 5.2.3 OCI
- 5.2.3.1 Overview
- 5.2.3.2 Top Products/Product Portfolio
- 5.2.3.3 Top Competitors
- 5.2.3.4 Target Customers
- 5.2.3.5 Key Personnel
- 5.2.3.6 Analyst View
- 5.2.3.7 Market Share
- 5.2.4 CF Industries Holdings, Inc.
- 5.2.4.1 Overview
- 5.2.4.2 Top Products/Product Portfolio
- 5.2.4.3 Top Competitors
- 5.2.4.4 Target Customers
- 5.2.4.5 Key Personnel
- 5.2.4.6 Analyst View
- 5.2.4.7 Market Share
- 5.2.5 Ma'aden
- 5.2.5.1 Overview
- 5.2.5.2 Top Products/Product Portfolio
- 5.2.5.3 Top Competitors
- 5.2.5.4 Target Customers
- 5.2.5.5 Key Personnel
- 5.2.5.6 Analyst View
- 5.2.5.7 Market Share
- 5.2.6 Qatar Fertiliser Company
- 5.2.6.1 Overview
- 5.2.6.2 Top Products/Product Portfolio
- 5.2.6.3 Top Competitors
- 5.2.6.4 Target Customers
- 5.2.6.5 Key Personnel
- 5.2.6.6 Analyst View
- 5.2.6.7 Market Share
- 5.2.7 Shell Plc
- 5.2.7.1 Overview
- 5.2.7.2 Top Products/Product Portfolio
- 5.2.7.3 Top Competitors
- 5.2.7.4 Target Customers
- 5.2.7.5 Key Personnel
- 5.2.7.6 Analyst View
- 5.2.7.7 Market Share
- 5.2.8 ExxonMobil Corporation
- 5.2.8.1 Overview
- 5.2.8.2 Top Products/Product Portfolio
- 5.2.8.3 Top Competitors
- 5.2.8.4 Target Customers
- 5.2.8.5 Key Personnel
- 5.2.8.6 Analyst View
- 5.2.8.7 Market Share
- 5.2.9 Linde Plc
- 5.2.9.1 Overview
- 5.2.9.2 Top Products/Product Portfolio
- 5.2.9.3 Top Competitors
- 5.2.9.4 Target Customers
- 5.2.9.5 Key Personnel
- 5.2.9.6 Analyst View
- 5.2.9.7 Market Share
- 5.2.10 Nutrien Ltd.
- 5.2.10.1 Overview
- 5.2.10.2 Top Products/Product Portfolio
- 5.2.10.3 Top Competitors
- 5.2.10.4 Target Customers
- 5.2.10.5 Key Personnel
- 5.2.10.6 Analyst View
- 5.2.10.7 Market Share
- 5.2.11 Uniper SE
- 5.2.11.1 Overview
- 5.2.11.2 Top Products/Product Portfolio
- 5.2.11.3 Top Competitors
- 5.2.11.4 Target Customers
- 5.2.11.5 Key Personnel
- 5.2.11.6 Analyst View
- 5.2.11.7 Market Share
- 5.2.12 ADNOC Group
- 5.2.12.1 Overview
- 5.2.12.2 Top Products/Product Portfolio
- 5.2.12.3 Top Competitors
- 5.2.12.4 Target Customers
- 5.2.12.5 Key Personnel
- 5.2.12.6 Analyst View
- 5.2.12.7 Market Share
- 5.2.13 LSB Industries
- 5.2.13.1 Overview
- 5.2.13.2 Top Products/Product Portfolio
- 5.2.13.3 Top Competitors
- 5.2.13.4 Target Customers
- 5.2.13.5 Key Personnel
- 5.2.13.6 Analyst View
- 5.2.13.7 Market Share
- 5.2.14 Eurochem Group
- 5.2.14.1 Overview
- 5.2.14.2 Top Products/Product Portfolio
- 5.2.14.3 Top Competitors
- 5.2.14.4 Target Customers
- 5.2.14.5 Key Personnel
- 5.2.14.6 Analyst View
- 5.2.14.7 Market Share
- 5.2.15 Pao Novatek
- 5.2.15.1 Overview
- 5.2.15.2 Top Products/Product Portfolio
- 5.2.15.3 Top Competitors
- 5.2.15.4 Target Customers
- 5.2.15.5 Key Personnel
- 5.2.15.6 Analyst View
- 5.2.15.7 Market Share
- 5.2.16 Others
- 5.2.1 Yara International ASA
