|
|
市場調査レポート
商品コード
1445392
デジタル診断市場 - 世界および地域の分析:用途・製品・エンドユーザー・国別の分析・予測 (2023~2033年)Digital Diagnostics Market - A Global and Regional Analysis: Focus on Application, Product, End User, and Country - Analysis and Forecast, 2023-2033 |
||||||

|
|||||||
カスタマイズ可能
|
|||||||

| デジタル診断市場 - 世界および地域の分析:用途・製品・エンドユーザー・国別の分析・予測 (2023~2033年) |
|
出版日: 2024年03月07日
発行: BIS Research
ページ情報: 英文 141 Pages
納期: 1~5営業日
|

全表示
- 概要
- 図表
- 目次
世界のデジタル診断の市場規模は、2023年の14億3,170万米ドルから、予測期間中は19.24%のCAGRで推移し、2033年には83億1,920万米ドルの規模に成長すると予測されています。
同市場は、技術の進歩、遠隔医療ソリューションへの関心の高まり、個別化医療へのシフトなどにより、大幅な成長と変革を遂げるとみられています。
| 主要市場統計 | |
|---|---|
| 予測期間 | 2023-2033年 |
| 2023年評価 | 14億3,000万米ドル |
| 2033年予測 | 83億1,920万米ドル |
| CAGR | 19.24% |
世界のデジタル診断市場は、既存事業者と新興事業者が市場シェアを争う激しい競合を特徴としています。市場で予想される成長と変革は、課題と機会の両方をもたらし、今後数年間でダイナミックな情勢となる見通しです。デジタル診断分野が成長を続ける中で、企業は規制の遵守、データの保護、市場の飽和への対応といった課題に直面することが予想されます。技術の進歩に迅速に対応し、戦略的パートナーシップを確立し、変化する顧客ニーズに対応できる企業には機会が示されています。
用途別では、癌の領域が2022年の市場をリードしました。癌の診断・治療は複雑であることから、高度で精密な診断ツールが必要とされており、デジタル診断は画像診断や分子診断を通じて先進的なソリューションを提供しています。
エンドユーザー別では、病院が2022年の市場をリードしました。病院は、医療診断の主要センターとして極めて重要な役割を担っているため、大きな割合を占めています。病院内でデジタル技術を導入することにより、診断手順が最適化され、効率と精度が向上します。
製品別では、ソフトウェアが2022年の市場をリードしました。デジタル診断は、画像解析、データ解釈、診断意思決定支援などの作業において、高度なソフトウェアに大きく依存しています。
地域別では、北米地域が予測期間中に最大のシェアを示す見通しであり、一方、アジア太平洋地域が最大のCAGRを示すと予想されています。
当レポートでは、世界のデジタル診断の市場を調査し、市場概要、市場影響因子の分析、法規制環境、R&Dおよび特許の動向、市場規模の推移・予測、各種区分・地域別の詳細分析、競合情勢、主要企業の分析などをまとめています。
目次
エグゼクティブサマリー
第1章 市場
- 動向:現在および将来の影響評価
- デジタル診断市場:動向分析
- 市場におけるスタートアップの数の増加
- 参入事業者間のパートナーシップとコラボレーション
- R&Dレビュー
- 特許出願動向(国別、年別)
- 規制状況
- 主要な世界的出来事の影響分析:COVID-19
- 市場力学:概要
- 市場促進要因
- 市場抑制要因
- 市場機会
第2章 用途
- 用途の分類
- 用途の概要
- デジタル診断市場
- 市場概要
- デジタル診断市場(用途別)
- 心臓病
- 腫瘍
- 病理
- 神経内科
- その他
- デジタル診断市場(エンドユーザー別)
- 病院
- 臨床および診断ラボ
- その他
第3章 製品
- 製品の分類
- 製品概要
- デジタル診断市場
- 市場概要
- デジタル診断市場(製品別)
- ハードウェア
- ソフトウェア
第4章 地域
- 地域概要
- 促進要因・抑制要因
- 北米
- 欧州
- アジア太平洋
- ラテンアメリカ
- 中東・アフリカ
第5章 市場:競合ベンチマーキング・企業プロファイル
- 地理的評価
- General Electric Healthcare
- Koninklijke Philips N.V.
- Canon Inc.
- Siemens Healthineers
- VUNO, Inc.
- Medtronic plc
- Nano-X Imaging Ltd.
- Digital Diagnostics, Inc
- Riverain Technologies
- Healthy.io
- Brainomix
- Behold.ai
- AliveCor, Inc.
第6章 調査手法
List of Figures
- Figure 1: Global Digital Diagnostics Market (by Region), $Million, 2022, 2026, and 2033
- Figure 2: Global Digital Diagnostics Market (by Application), $Million, 2022, 2026, and 2033
- Figure 3: Global Digital Diagnostics Market (by End User), $Million, 2022, 2026, and 2033
- Figure 4: Global Digital Diagnostics Market (by Product), $Million, 2022, 2026, and 2033
- Figure 5: Key Events to Keep a Track of Global Digital Diagnostics Market
- Figure 6: Digital Diagnostics Market (by Country), January 2020-December 2023
- Figure 7: Digital Diagnostics Market (by Year), January 2020-December 2023
- Figure 8: Proportion of People Suffering from Cancer for Five Years Based on the Stage of Diagnosis
- Figure 9: Technological Advancements in the Field of AI
- Figure 10: U.S. Digital Diagnostics Market, $Million, 2022-2033
- Figure 11: Canada Digital Diagnostics Market, $Million, 2022-2033
- Figure 12: France Digital Diagnostics Market, $Million, 2022-2033
- Figure 13: Germany Digital Diagnostics Market, $Million, 2022-2033
- Figure 14: U.K. Digital Diagnostics Market, $Million, 2022-2033
- Figure 15: Spain Digital Diagnostics Market, $Million, 2022-2033
- Figure 16: Italy Digital Diagnostics Market, $Million, 2022-2033
- Figure 17: Rest-of-Europe Digital Diagnostics Market, $Million, 2022-2033
- Figure 18: China Digital Diagnostics Market, $Million, 2022-2033
- Figure 19: India Digital Diagnostics Market, $Million, 2022-2033
- Figure 20: Japan Digital Diagnostics Market, $Million, 2022-2033
- Figure 21: South Korea Digital Diagnostics Market, $Million, 2022-2033
- Figure 22: Australia Digital Diagnostics Market, $Million, 2022-2033
- Figure 23: Rest-of-Asia-Pacific Digital Diagnostics Market, $Million, 2022-2033
- Figure 24: Brazil Digital Diagnostics Market, $Million, 2022-2033
- Figure 25: Mexico Digital Diagnostics Market, $Million, 2022-2033
- Figure 26: Rest-of-Latin America Digital Diagnostics Market, $Million, 2022-2033
- Figure 27: U.A.E. Digital Diagnostics Market, $Million, 2022-2033
- Figure 28: South Africa Digital Diagnostics Market, $Million, 2022-2033
- Figure 29: K.S.A. Digital Diagnostics Market, $Million, 2022-2033
- Figure 30: Israel Digital Diagnostics Market, $Million, 2022-2033
- Figure 31: Turkiye Digital Diagnostics Market, $Million, 2022-2033
- Figure 32: Rest-of-Middle East and Africa Digital Diagnostics Market, $Million, 2022-2033
- Figure 33: Strategic Initiatives, 2020-2023
- Figure 34: Data Triangulation
- Figure 35: Top-Down and Bottom-Up Approach
- Figure 36: Assumptions and Limitations
List of Tables
- Table 1: Market Snapshot
- Table 2: Opportunities Across Regions
- Table 3: Startups Entering in the Digital Diagnostics Market
- Table 4: Digital Diagnostics Market, Key Partnerships and Collaborations
- Table 5: Digital Diagnostics Market, Regulatory Landscape
- Table 6: Comparative Table Outlining the Key Trends Affected by COVID-19
- Table 7: Impact Analysis of Market Navigating Factors, 2023-2033
- Table 8: Government Initiatives across Different Countries
- Table 9: Startups in Low-Economic Countries
- Table 10: Digital Diagnostics Market Players and Their Partnerships with Hospitals and Diagnostic Centers
- Table 11: Digital Diagnostics Market (by Application), $Million, 2022-2033
- Table 12: Digital Diagnostics Market (by End User), $Million, 2022-2033
- Table 13: Companies in Digital Diagnostics Market in the Cardiology Segment
- Table 14: Digital Diagnostics Market (by Product), $Million, 2022-2033
- Table 15: Digital Diagnostics Market (by Region), $Million, 2022-2033
- Table 16: North America Digital Diagnostics Market (by Application), $Million, 2022-2033
- Table 17: North America Digital Diagnostics Market (by End User), $Million, 2022-2033
- Table 18: North America Digital Diagnostics Market (by Product), $Million, 2022-2033
- Table 19: U.S. Digital Diagnostics Market (by Application), $Million, 2022-2033
- Table 20: U.S. Digital Diagnostics Market (by End User), $Million, 2022-2033
- Table 21: U.S. Digital Diagnostics Market (by Product), $Million, 2022-2033
- Table 22: Canada Digital Diagnostics Market (by Application), $Million, 2022-2033
- Table 23: Canada Digital Diagnostics Market (by End User), $Million, 2022-2033
- Table 24: Canada Digital Diagnostics Market (by Product), $Million, 2022-2033
- Table 25: Europe Digital Diagnostics Market (by Application), $Million, 2022-2033
- Table 26: Europe Digital Diagnostics Market (by End User), $Million, 2022-2033
- Table 27: Europe Digital Diagnostics Market (by Product), $Million, 2022-2033
- Table 28: France Digital Diagnostics Market (by Application), $Million, 2022-2033
- Table 29: France Digital Diagnostics Market (by End User), $Million, 2022-2033
- Table 30: France Digital Diagnostics Market (by Product), $Million, 2022-2033
- Table 31: Germany Digital Diagnostics Market (by Application), $Million, 2022-2033
- Table 32: Germany Digital Diagnostics Market (by End User), $Million, 2022-2033
- Table 33: Germany Digital Diagnostics Market (by Product), $Million, 2022-2033
- Table 34: U.K. Digital Diagnostics Market (by Application), $Million, 2022-2033
- Table 35: U.K. Digital Diagnostics Market (by End User), $Million, 2022-2033
- Table 36: U.K. Digital Diagnostics Market (by Product), $Million, 2022-2033
- Table 37: Spain Digital Diagnostics Market (by Application), $Million, 2022-2033
- Table 38: Spain Digital Diagnostics Market (by End User), $Million, 2022-2033
- Table 39: Spain Digital Diagnostics Market (by Product), $Million, 2022-2033
- Table 40: Italy Digital Diagnostics Market (by Application), $Million, 2022-2033
- Table 41: Italy Digital Diagnostics Market (by End User), $Million, 2022-2033
- Table 42: Italy Digital Diagnostics Market (by Product), $Million, 2022-2033
- Table 43: Rest-of-Europe Digital Diagnostics Market (by Application), $Million, 2022-2033
- Table 44: Rest-of-Europe Digital Diagnostics Market (by End User), $Million, 2022-2033
- Table 45: Rest-of-Europe Digital Diagnostics Market (by Product), $Million, 2022-2033
- Table 46: Asia-Pacific Digital Diagnostics Market (by Application), $Million, 2022-2033
- Table 47: Asia-Pacific Digital Diagnostics Market (by End User), $Million, 2022-2033
- Table 48: Asia-Pacific Digital Diagnostics Market (by Product), $Million, 2022-2033
- Table 49: China Digital Diagnostics Market (by Application), $Million, 2022-2033
- Table 50: China Digital Diagnostics Market (by End User), $Million, 2022-2033
- Table 51: China Digital Diagnostics Market (by Product), $Million, 2022-2033
- Table 52: India Digital Diagnostics Market (by Application), $Million, 2022-2033
- Table 53: India Digital Diagnostics Market (by End User), $Million, 2022-2033
- Table 54: India Digital Diagnostics Market (by Product), $Million, 2022-2033
- Table 55: Japan Digital Diagnostics Market (by Application), $Million, 2022-2033
- Table 56: Japan Digital Diagnostics Market (by End User), $Million, 2022-2033
- Table 57: Japan Digital Diagnostics Market (by Product), $Million, 2022-2033
- Table 58: South Korea Digital Diagnostics Market (by Application), $Million, 2022-2033
- Table 59: South Korea Digital Diagnostics Market (by End User), $Million, 2022-2033
- Table 60: South Korea Digital Diagnostics Market (by Product), $Million, 2022-2033
- Table 61: Australia Digital Diagnostics Market (by Application), $Million, 2022-2033
- Table 62: Australia Digital Diagnostics Market (by End User), $Million, 2022-2033
- Table 63: Australia Digital Diagnostics Market (by Product), $Million, 2022-2033
- Table 64: Rest-of-Asia-Pacific Digital Diagnostics Market (by Application), $Million, 2022-2033
- Table 65: Rest-of-Asia-Pacific Digital Diagnostics Market (by End User), $Million, 2022-2033
- Table 66: Rest-of-Asia-Pacific Digital Diagnostics Market (by Product), $Million, 2022-2033
- Table 67: Latin America Digital Diagnostics Market (by Application), $Million, 2022-2033
- Table 68: Latin America Digital Diagnostics Market (by End User), $Million, 2022-2033
- Table 69: Latin America Digital Diagnostics Market (by Product), $Million, 2022-2033
- Table 70: Brazil Digital Diagnostics Market (by Application), $Million, 2022-2033
- Table 71: Brazil Digital Diagnostics Market (by End User), $Million, 2022-2033
- Table 72: Brazil Digital Diagnostics Market (by Product), $Million, 2022-2033
- Table 73: Mexico Digital Diagnostics Market (by Application), $Million, 2022-2033
- Table 74: Mexico Digital Diagnostics Market (by End User), $Million, 2022-2033
- Table 75: Mexico Digital Diagnostics Market (by Product), $Million, 2022-2033
- Table 76: Rest-of-Latin America Digital Diagnostics Market (by Application), $Million, 2022-2033
- Table 77: Rest-of-Latin America Digital Diagnostics Market (by End User), $Million, 2022-2033
- Table 78: Rest-of-Latin America Digital Diagnostics Market (by Product), $Million, 2022-2033
- Table 79: Middle East and Africa Digital Diagnostics Market (by Application), $Million, 2022-2033
- Table 80: Middle East and Africa Digital Diagnostics Market (by End User), $Million, 2022-2033
- Table 81: Middle East and Africa Digital Diagnostics Market (by Product), $Million, 2022-2033
- Table 82: U.A.E. Digital Diagnostics Market (by Application), $Million, 2022-2033
- Table 83: U.A.E. Digital Diagnostics Market (by End User), $Million, 2022-2033
- Table 84: U.A.E. Digital Diagnostics Market (by Product), $Million, 2022-2033
- Table 85: South Africa Digital Diagnostics Market (by Application), $Million, 2022-2033
- Table 86: South Africa Digital Diagnostics Market (by End User), $Million, 2022-2033
- Table 87: South Africa Digital Diagnostics Market (by Product), $Million, 2022-2033
- Table 88: K.S.A. Digital Diagnostics Market (by Application), $Million, 2022-2033
- Table 89: K.S.A. Digital Diagnostics Market (by End User), $Million, 2022-2033
- Table 90: K.S.A. Digital Diagnostics Market (by Product), $Million, 2022-2033
- Table 91: Israel Digital Diagnostics Market (by Application), $Million, 2022-2033
- Table 92: Israel Digital Diagnostics Market (by End User), $Million, 2022-2033
- Table 93: Israel Digital Diagnostics Market (by Product), $Million, 2022-2033
- Table 94: Turkiye Digital Diagnostics Market (by Application), $Million, 2022-2033
- Table 95: Turkiye Digital Diagnostics Market (by End User), $Million, 2022-2033
- Table 96: Turkiye Digital Diagnostics Market (by Product), $Million, 2022-2033
- Table 97: Rest-of-Middle East and Africa Digital Diagnostics Market (by Application), $Million, 2022-2033
- Table 98: Rest-of-Middle East and Africa Digital Diagnostics Market (by End User), $Million, 2022-2033
- Table 99: Rest-of-Middle East and Africa Digital Diagnostics Market (by Product), $Million, 2022-2033
The Global Digital Diagnostics Market Expected to Reach $8.31 Billion by 2033
Global Digital Diagnostics Market Overview
The global digital diagnostics market is projected to reach $8,319.2 million by 2033 from $1,431.7 million in 2023, growing at a CAGR of 19.24% during the forecast period 2023-2033. The market is set to experience substantial growth and transformation due to technological advancements, rising interest in telehealth solutions, and a shift towards personalized healthcare.
| KEY MARKET STATISTICS | |
|---|---|
| Forecast Period | 2023 - 2033 |
| 2023 Evaluation | $1.43 Billion |
| 2033 Forecast | $8,319.2 million |
| CAGR | 19.24% |
Market Lifecycle Stage
The global digital diagnostics market is characterized by intense competition, as established entities and emerging players compete for a share of the market. The anticipated growth and transformation of the market bring forth both challenges and opportunities, rendering it a dynamic landscape to observe in the upcoming years. While the digital diagnostics sector continues to grow, companies are expected to confront challenges linked to adhering to regulations, safeguarding data, and coping with market saturation. Nonetheless, there are opportunities for those who can quickly adapt to technological advancements, establish strategic partnerships, and meet the changing needs of customers.
Industry Impact
The digital diagnostics market is reshaping industries, particularly healthcare, by ushering in transformative changes. Advanced technologies such as artificial intelligence and machine learning are enhancing the precision and speed of medical diagnostics, revolutionizing patient care. The integration of data analytics not only provides valuable insights into population health but also drives evidence-based decision-making by healthcare organizations and policymakers. The competitive landscape is evolving, fostering innovation as companies vie to offer cutting-edge diagnostic solutions.
The industry's advancements in digital diagnostics research and development continually address population health trends, disease prevalence, and treatment outcomes. As a result, the digital diagnostics market's impact extends beyond technological integration for diagnosis, making it an integral component of global health strategies and broader ecosystem.
Market Segmentation:
Segmentation 1: by Application
- Cardiology
- Oncology
- Neurology
- Pathology
- Others
Oncology to Dominate the Global Digital Diagnostics Market (by Application)
The oncology segment dominated the global digital diagnostics market (by application) in FY2022.
The oncology sector dominates the digital diagnostics market for various compelling reasons. Given the intricate nature of cancer diagnosis and treatment, there is a need for sophisticated and precise diagnostic tools, with digital diagnostics providing advanced solutions through imaging and molecular diagnostics.
Segmentation 2: by End User
- Hospitals
- Clinical Laboratories
- Others
Hospitals to Dominate the Global Digital Diagnostics Market (by End User)
The hospitals segment dominated the global digital diagnostics market (by end user) in FY2022.
Hospitals hold a substantial portion of the end user segment in the global digital diagnostics market due to their pivotal role as primary centers for medical diagnostics. The incorporation of digital technologies within hospital settings serves to optimize diagnostic procedures, resulting in improved efficiency and accuracy.
Segmentation 3: by Product
- Hardware
- Software
Software to Dominate the Global Digital Diagnostics Market (by Product)
The global digital diagnostics market (by product) was dominated by the software segment in FY2022. Digital diagnostics heavily relies on advanced software applications for tasks such as image analysis, data interpretation, and diagnostic decision support.
Segmentation 4: by Region
- North America
- Europe
- Asia-Pacific
- Latin America
- Middle East and Africa
North America holds the largest share during the forecast period 2023-2033, and Asia-Pacific is expected to witness the highest CAGR for the forecast period 2023-2033.
Demand - Drivers, Restraints, and Opportunities
Market Drivers:
Growing burden of chronic diseases: With the rising incidence of chronic diseases, early diagnostic intervention is a key factor leading to the growth of digital diagnostic solutions worldwide. Digital diagnostics, powered by artificial intelligence, machine learning, and deep learning algorithms, help alleviate the burden of an increasing patient population and further provide faster diagnosis.
Market Restraints:
Challenges regarding biased data leading to miscalculations in data-driven diagnostic software: The bias introduced by the underrepresentation of certain population segments can result in skewed outcomes from AI-enabled medical devices, potentially leading to misdiagnoses. This obstacle in adopting AI-enabled medical devices as reliable clinical decision-support tools stems from concerns about their accuracy and reliability. These inherent biases within AI systems and the potential for inaccurate diagnoses or prognoses pose a threat to patient safety, raising questions about the accountability of stakeholders in healthcare settings, thereby hindering the growth of the digital diagnostics market.
Market Opportunities:
Increasing Opportunities for Digital Diagnostic Solutions in Emerging Economies: Emerging economic countries face multiple challenges, such as limited specialized medical professionals and growing burden of patients. This creates a need for accurate diagnosis and automated tools that assist and lighten the load for physicians. Digital diagnostic solutions can bridge the gap between remote communities and medical centers.
How can this report add value to an organization?
Workflow/Innovation Strategy: The digital diagnostics market (by application) has been segmented into detailed segments of the application of digital diagnostics based on disease indications, including cardiology, oncology, neurology, pathology, and others. Moreover, the study provides the reader with a detailed understanding of the products that are majorly segmented into hardware and software.
Growth/Marketing Strategy: The digital diagnostics market encompasses a range of digital devices available in the market. Since the market is growing, there are upcoming technologies that can further enhance the adoption of digital diagnostics and AI in the market.
Competitive Strategy: Key players in the global digital diagnostics market have been analyzed and profiled in the study, including manufacturers involved in new product launches, acquisitions, expansions, and strategic collaborations. Moreover, a detailed competitive benchmarking of the players operating in the global digital diagnostics market has been done to help the reader understand how players stack against each other, presenting a clear market landscape. Additionally, comprehensive competitive strategies such as partnerships, agreements, and collaborations will aid the reader in understanding the untapped revenue pockets in the market.
Methodology
Key Considerations and Assumptions in Market Engineering and Validation
- The base year considered for the calculation of the market size is 2022. The historical year analysis has been done from FY2020 to FY2021, and the market size has been calculated for FY2022 and projected for the period 2023-2033.
- The geographical distribution of the market revenue is estimated to be the same as the company's net revenue distribution. All the numbers are adjusted to two digits after decimals for report presentation reasons. However, the real figures have been utilized for compound annual growth rate (CAGR) estimation. CAGR is calculated from 2023 to 2033.
- The market has been mapped based on different types of products available in the market and based on several indications. All the key manufacturing companies that have a significant number of offerings to the digital diagnostics market have been considered and profiled in the report.
- In the study, the primary respondent's verification has been considered to finalize the estimated market for the digital diagnostics market.
- The latest annual reports of each market player have been taken into consideration for market revenue calculation.
- Market strategies and developments of key players have been considered for the calculation of sub-segment split.
- The base currency considered for the market analysis is US$. Currencies other than the US$ have been converted to the US$ for all statistical calculations, considering the average conversion rate for that particular year. The currency conversion rate has been taken from the historical exchange rate of the Oanda website or from the annual reports of the respective company if stated.
Primary Research
The key data points taken from the primary sources include:
- Validation and triangulation of all the numbers and graphs
- Validation of the report's segmentation and key qualitative findings
- Understanding of the numbers of the various markets for market type
- Percentage split of individual markets for regional analysis
Secondary Research
Open Sources
- Food and Drug Administration (FDA), PubMed, and National Center for Biotechnology Information (NCBI)
- Annual reports, SEC filings, and investor presentations of the leading market players
- Company websites and detailed study of their portfolio
- Gold standard magazines, journals, whitepapers, press releases, and news articles
- Databases
The key data points taken from the secondary sources include:
- Segmentations, split-ups, and percentage shares
- Data for market value
- Key industry trends of the top players in the market
- Qualitative insights into various aspects of the market, key trends, and emerging areas of innovation
- Quantitative data for mathematical and statistical calculations
Key Market Players and Competition Synopsis
Digital diagnostics involves employing digital technologies, including software, algorithms, and digital devices, for the diagnosis of medical conditions and diseases. This entails incorporating advanced technologies such as artificial intelligence, machine learning, and data analytics to improve the precision and effectiveness of diagnostic processes in the healthcare sector.
Over the next 10 years, the digital diagnostics market is expected to experience significant growth, propelled by swift technological progress. Key competitive trends include a notable focus on remote patient monitoring, incorporation of artificial intelligence to improve diagnostics, and increasing significance of wearable technologies in health monitoring.
Some of the prominent companies in this market are:
- GE Healthcare
- Siemens Healthineers
- Medtronic plc
- Nano-X Imaging Ltd.
- Koninklijke Philips N.V.
- Digital Diagnostics Inc.
- Riverain Technologies
- VUNO, Inc.
- AliveCor, Inc.
- Behold.ai.
- Brainomix
- Healthy.io
- Canon Inc.
Companies that are not a part of the aforementioned pool have been well-represented across different sections of the report (wherever applicable).
Table of Contents
Executive Summary
Scope and Definition
1 Markets
- 1.1 Trends: Current and Future Impact Assessment
- 1.1.1 Digital Diagnostics Market Trend Analysis
- 1.1.2 Increasing Number of Startups in the Market
- 1.1.3 Partnerships and Collaborations among Market Players
- 1.2 Research and Development Review
- 1.2.1 Patent Filing Trend (by Country, Year)
- 1.3 Regulatory Landscape
- 1.4 Impact Analysis for Key Global Events - COVID-19
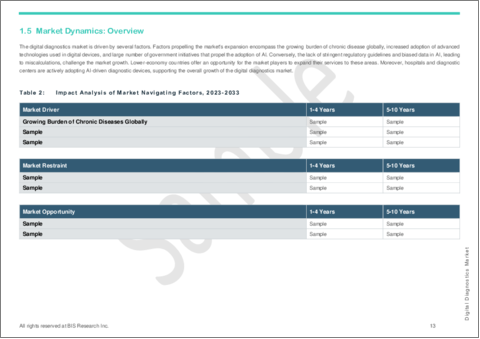
- 1.5 Market Dynamics: Overview
- 1.5.1 Market Drivers
- 1.5.1.1 Growing Burden of Chronic Diseases
- 1.5.1.2 Increasing Adoption of Advanced Technologies
- 1.5.1.3 AI Adoption in Digital Diagnostic Devices
- 1.5.2 Market Restraints
- 1.5.2.1 Challenges Regarding Biased Data Leading to Miscalculations in Data-Driven Diagnostic Software
- 1.5.2.2 Lack of Stringent Regulatory Guidelines
- 1.5.3 Market Opportunities
- 1.5.3.1 Increasing Opportunities for Digital Diagnostic Solutions in Emerging Economies
- 1.5.3.2 Synergetic Partnership Opportunities with Hospitals and Diagnostic Centers to Reduce Wait Times and Burden
- 1.5.1 Market Drivers
2 Application
- 2.1 Application Segmentation
- 2.2 Application Summary
- 2.3 Digital Diagnostics Market
- 2.3.1 Market Overview
- 2.3.1.1 Analyst View
- 2.3.1 Market Overview
- 2.4 Digital Diagnostics Market (by Application)
- 2.4.1 Cardiology
- 2.4.2 Oncology
- 2.4.3 Pathology
- 2.4.4 Neurology
- 2.4.5 Others
- 2.5 Digital Diagnostics Market (by End User)
- 2.5.1 Hospitals
- 2.5.2 Clinical and Diagnostic Laboratories
- 2.5.3 Others
3 Products
- 3.1 Product Segmentation
- 3.2 Product Summary
- 3.3 Digital Diagnostics Market
- 3.3.1 Market Overview
- 3.3.1.1 Analyst View
- 3.3.1 Market Overview
- 3.4 Digital Diagnostics Market (by Product)
- 3.4.1 Hardware
- 3.4.2 Software
4 Regions
- 4.1 Regional Summary
- 4.2 Drivers and Restraints
- 4.3 North America
- 4.3.1 Regional Overview
- 4.3.1.1 Driving Factors for Market Growth
- 4.3.1.2 Factors Challenging the Market
- 4.3.2 Application
- 4.3.3 Product
- 4.3.4 U.S.
- 4.3.5 Canada
- 4.3.1 Regional Overview
- 4.4 Europe
- 4.4.1 Regional Overview
- 4.4.1.1 Driving Factors for Market Growth
- 4.4.1.2 Factors Challenging the Market
- 4.4.2 Application
- 4.4.3 Product
- 4.4.4 France
- 4.4.5 Germany
- 4.4.6 U.K.
- 4.4.7 Spain
- 4.4.8 Italy
- 4.4.9 Rest-of-Europe
- 4.4.1 Regional Overview
- 4.5 Asia-Pacific
- 4.5.1 Regional Overview
- 4.5.1.1 Driving Factors for Market Growth
- 4.5.1.2 Factors Challenging the Market
- 4.5.2 Application
- 4.5.3 Product
- 4.5.4 China
- 4.5.5 India
- 4.5.6 Japan
- 4.5.7 South Korea
- 4.5.8 Australia
- 4.5.9 Rest-of-Asia-Pacific
- 4.5.1 Regional Overview
- 4.6 Latin America
- 4.6.1 Regional Overview
- 4.6.1.1 Driving Factors for Market Growth
- 4.6.1.2 Factors Challenging the Market
- 4.6.2 Application
- 4.6.3 Product
- 4.6.4 Brazil
- 4.6.5 Mexico
- 4.6.6 Rest-of-Latin America
- 4.6.1 Regional Overview
- 4.7 Middle East and Africa
- 4.7.1 Regional Overview
- 4.7.1.1 Driving Factors for Market Growth
- 4.7.1.2 Factors Challenging the Market
- 4.7.2 Application
- 4.7.3 Product
- 4.7.4 U.A.E.
- 4.7.5 South Africa
- 4.7.6 K.S.A.
- 4.7.7 Israel
- 4.7.8 Turkiye
- 4.7.9 Rest-of-Middle East and Africa
- 4.7.1 Regional Overview
5 Markets -Competitive Benchmarking & Company Profiles
- 5.1 Geographic Assessment
- 5.1.1 General Electric Healthcare
- 5.1.1.1 Overview
- 5.1.1.2 Top Products/Product Portfolio
- 5.1.1.3 Target Customers
- 5.1.1.4 Key Personnel
- 5.1.1.5 Analyst View
- 5.1.2 Koninklijke Philips N.V.
- 5.1.2.1 Overview
- 5.1.2.2 Top Products/Product Portfolio
- 5.1.2.3 Target Customers
- 5.1.2.4 Key Personnel
- 5.1.2.5 Analyst View
- 5.1.3 Canon Inc.
- 5.1.3.1 Overview
- 5.1.3.2 Top Products/Product Portfolio
- 5.1.3.3 Target Customers
- 5.1.3.4 Key Personnel
- 5.1.3.5 Analyst View
- 5.1.4 Siemens Healthineers
- 5.1.4.1 Overview
- 5.1.4.2 Top Products/Product Portfolio
- 5.1.4.3 Target Customers
- 5.1.4.4 Key Personnel
- 5.1.4.5 Analyst View
- 5.1.5 VUNO, Inc.
- 5.1.5.1 Overview
- 5.1.5.2 Top Products
- 5.1.5.3 Target Customers
- 5.1.5.4 Key Personnel
- 5.1.5.5 Analyst View
- 5.1.6 Medtronic plc
- 5.1.6.1 Overview
- 5.1.6.2 Top Products
- 5.1.6.3 Target Customers
- 5.1.6.4 Key Personnel
- 5.1.6.5 Analyst View
- 5.1.7 Nano-X Imaging Ltd.
- 5.1.7.1 Overview
- 5.1.7.2 Top Products
- 5.1.7.3 Target Customers
- 5.1.7.4 Key Personnel
- 5.1.7.5 Analyst View
- 5.1.8 Digital Diagnostics, Inc
- 5.1.8.1 Overview
- 5.1.8.2 Top Products
- 5.1.8.3 Target Customers
- 5.1.8.4 Key Personnel
- 5.1.8.5 Analyst View
- 5.1.9 Riverain Technologies
- 5.1.9.1 Overview
- 5.1.9.2 Top Products
- 5.1.9.3 Target Customers
- 5.1.9.4 Key Personnel
- 5.1.9.5 Analyst View
- 5.1.10 Healthy.io
- 5.1.10.1 Overview
- 5.1.10.2 Top Products
- 5.1.10.3 Target Customers
- 5.1.10.4 Key Personnel
- 5.1.10.5 Analyst View
- 5.1.11 Brainomix
- 5.1.11.1 Overview
- 5.1.11.2 Top Products
- 5.1.11.3 Target Customers
- 5.1.11.4 Key Personnel
- 5.1.11.5 Analyst View
- 5.1.12 Behold.ai
- 5.1.12.1 Overview
- 5.1.12.2 Top Products
- 5.1.12.3 Target Customers
- 5.1.12.4 Key Personnel
- 5.1.12.5 Analyst View
- 5.1.13 AliveCor, Inc.
- 5.1.13.1 Overview
- 5.1.13.2 Top Products
- 5.1.13.3 Target Customers
- 5.1.13.4 Key Personnel
- 5.1.13.5 Analyst View
- 5.1.1 General Electric Healthcare
6 Research Methodology
- 6.1 Data Sources
- 6.1.1 Primary Data Sources
- 6.1.2 Secondary Data Sources
- 6.1.3 Data Triangulation
- 6.2 Market Estimation and Forecast

