|
|
市場調査レポート
商品コード
1427000
農業用コンピュータビジョン技術市場:世界および地域別分析(2023年~2033年)Computer Vision Technology Market for Agriculture: A Global and Regional Analysis, 2023-2033 |
||||||
|
|||||||
カスタマイズ可能
|
|||||||

| 農業用コンピュータビジョン技術市場:世界および地域別分析(2023年~2033年) |
|
出版日: 2024年02月19日
発行: BIS Research
ページ情報: 英文 151 Pages
納期: 1~5営業日
|

全表示
- 概要
- 図表
- 目次
農業用コンピュータビジョン技術の市場規模は、2023年には4億3,200万米ドルとなりました。
同市場は今後、16.78%のCAGRで拡大し、2033年には20億3,750万米ドルに達すると予測されています。農業用コンピュータビジョン技術市場は現在、急速な進歩と採用の高まりによってダイナミックな成長段階にあります。同市場は、多様な参入企業が農業分野の特殊な用途に貢献することで、ある程度の断片化を示しています。Climate LLC、Granular、IBM Corporation、Ceres Imaging、Deere &Companyなどの主要企業が注目すべき市場シェアを占めており、技術に特化した新興企業と既存の大企業が混在して、農業におけるコンピュータビジョンソリューションの展望を形成していることを示しています。市場が成熟するにつれて、競争力学に影響を与え、近代的な農法へのコンピュータビジョン技術の統合をさらに促進するような統合動向が現れる可能性があります。2022年現在、農業用コンピュータビジョン技術市場では、有力企業が市場シェアの約30%を占めています。この比率は、精密農業の進化とコンピュータビジョンソリューションの広範な応用を反映し、農業分野における技術革新と技術採用の推進におけるこれらの企業の影響力を強調するものです。
| 主要市場統計 | |
|---|---|
| 予測期間 | 2023年~2033年 |
| 2023年評価 | 4億3,200万米ドル |
| 2033年予測 | 20億3,750万米ドル |
| CAGR | 16.78% |
農業用コンピュータビジョン技術市場では、農業プロセスに関連する視覚データを分析するためのコンピュータビジョン技術を活用したソフトウェア用途を開発・提供する企業を網羅しています。これらのソフトウェアプロバイダーは、農業用途に合わせたアルゴリズム、画像処理、物体検出、ディープラーニングモデルの作成を専門としています。
同市場は、農業における生物的ストレスモニタリング、収穫動態モニタリング、自律的機器制御、生物的ストレスモニタリングなどの用途向けに設計された革新的なソリューションを提供する事業体によって特徴付けられ、さまざまな画像デバイスを通じて取得された視覚データから貴重な洞察を解釈し抽出することに重点を置いています。
当レポートでは、世界の農業用コンピュータビジョン技術市場について調査し、市場の概要とともに、用途別、製品別、地域別の動向、および市場に参入する企業のプロファイルなどを提供しています。
目次
エグゼクティブサマリー
範囲と定義
第1章 市場
- 動向:現在および将来の影響評価
- サプライチェーンの概要
- 研究開発レビュー
- 規制状況
- 主要な世界的出来事の影響分析- COVID-19
- 市場力学の概要
第2章 用途
- 用途のセグメンテーション
- 用途の概要
- 世界の農業用コンピュータビジョン技術市場(用途別)
第3章 製品
- 製品のセグメンテーション
- 製品概要
- 世界の農業用コンピュータビジョン技術市場(製品別)
第4章 地域
- 地域別の概要
- 促進要因と抑制要因
- 北米
- 欧州
- アジア太平洋
- ラテンアメリカ
- 中東・アフリカ
第5章 市場-競合ベンチマーキングと企業プロファイル
- 今後の見通し
- 地理的評価
- IBM Corporation
- Climate LLC
- Deere & Company
- Gamaya
- Taranis
- Prospera Technologies
- Granular Inc.
- Ceres Imaging
- HIPHEN (SlantRange, Inc.)
- AgEagle Aerial Systems Inc (MicaSense)
- PrecisionHawk, Inc.
- Iteris, Inc.
- CropIn Technology Solutions
- DJI
- Plantix
第6章 調査手法
List of Figures
- Figure 1: Computer Vision Technology Market for Agriculture (by Region), 2022, 2026, and 2033, $Million
- Figure 2: Computer Vision Technology Market for Agriculture (by Application), 2022, 2026, and 2033
- Figure 3: Computer Vision Technology Market for Agriculture (by Product), 2022, 2026, and 2033
- Figure 4: Computer Vision Technology Market for Agriculture, Recent Developments
- Figure 5: Global Holdings of DJI Agricultural Drones, Units, 2016-2021
- Figure 6: Supply Chain and Risks within the Supply Chain
- Figure 7: Value Chain Analysis
- Figure 8: Market Map
- Figure 9: Computer Vision Technology Market for Agriculture (by Company), January 2020-January 2024
- Figure 10: Computer Vision Technology Market for Agriculture (by Country), January 2020-January 2024
- Figure 11: Impact Analysis of Market Navigating Factors, 2022-2033
- Figure 12: Major Challenges to Farmers Due to Lack of Standardization in the Agriculture Sector
- Figure 13: U.S. Computer Vision Technology Market for Agriculture, $Million, 2022-2033
- Figure 14: U.S. Computer Vision Technology Market for Agriculture (by Application), $Million, 2022, 2026, and 2033
- Figure 15: U.S. Computer Vision Technology Market for Agriculture (by Product), $Million, 2022, 2026, and 2033
- Figure 16: Canada Computer Vision Technology Market for Agriculture, $Million, 2022-2033
- Figure 17: Canada Computer Vision Technology Market for Agriculture (by Application), $Million, 2022, 2026, and 2033
- Figure 18: Canada Computer Vision Technology Market for Agriculture (by Product), $Million, 2022, 2026, and 2033
- Figure 20: France Computer Vision Technology Market for Agriculture, $Million, 2022-2033
- Figure 21: France Computer Vision Technology Market for Agriculture (by Application), $Million, 2022, 2026, and 2033
- Figure 22: France Computer Vision Technology Market for Agriculture (by Product), $Million, 2022, 2026, and 2033
- Figure 23: Germany Computer Vision Technology Market for Agriculture, $Million, 2022-2033
- Figure 24: Germany Computer Vision Technology Market for Agriculture (by Application), $Million, 2022, 2026, and 2033
- Figure 25: Germany Computer Vision Technology Market for Agriculture (by Product), $Million, 2022, 2026, and 2033
- Figure 26: U.K. Computer Vision Technology Market for Agriculture, $Million, 2022-2033
- Figure 27: U.K. Computer Vision Technology Market for Agriculture (by Application), $Million, 2022, 2026, and 2033
- Figure 28: U.K. Computer Vision Technology Market for Agriculture (by Product), $Million, 2022, 2026, and 2033
- Figure 29: Spain Computer Vision Technology Market for Agriculture, $Million, 2022-2033
- Figure 30: Spain Computer Vision Technology Market for Agriculture (by Application), $Million, 2022, 2026, and 2033
- Figure 31: Spain Computer Vision Technology Market for Agriculture (by Product), $Million, 2022, 2026, and 2033
- Figure 32: Italy Computer Vision Technology Market for Agriculture, $Million, 2022-2033
- Figure 33: Italy Computer Vision Technology Market for Agriculture (by Application), $Million, 2022, 2026, and 2033
- Figure 34: Italy Computer Vision Technology Market for Agriculture (by Product), $Million, 2022, 2026, and 2033
- Figure 35: Belgium Computer Vision Technology Market for Agriculture, $Million, 2022-2033
- Figure 36: Belgium Computer Vision Technology Market for Agriculture (by Application), $Million, 2022, 2026, and 2033
- Figure 37: Belgium Computer Vision Technology Market for Agriculture (by Product), $Million, 2022, 2026, and 2033
- Figure 38: Bulgaria Computer Vision Technology Market for Agriculture, $Million, 2022-2033
- Figure 39: Bulgaria Computer Vision Technology Market for Agriculture (by Application), $Million, 2022, 2026, and 2033
- Figure 40: Bulgaria Computer Vision Technology Market for Agriculture (by Product), $Million, 2022, 2026, and 2033
- Figure 41: Ukraine Computer Vision Technology Market for Agriculture, $Million, 2022-2033
- Figure 42: Ukraine Computer Vision Technology Market for Agriculture (by Application), $Million, 2022, 2026, and 2033
- Figure 43: Ukraine Computer Vision Technology Market for Agriculture (by Product), $Million, 2022, 2026, and 2033
- Figure 44: Rest-of-Europe Computer Vision Technology Market for Agriculture, $Million, 2022-2033
- Figure 45: Rest-of-Europe Computer Vision Technology Market for Agriculture (by Application), $Million, 2022, 2026, and 2033
- Figure 46: Rest-of-Europe Computer Vision Technology Market for Agriculture (by Product), $Million, 2022, 2026, and 2033
- Figure 47: China Computer Vision Technology Market for Agriculture, $Million, 2022-2033
- Figure 48: China Computer Vision Technology Market for Agriculture (by Application), $Million, 2022, 2026, and 2033
- Figure 49: China Computer Vision Technology Market for Agriculture (by Product), $Million, 2022, 2026, and 2033
- Figure 50: India Computer Vision Technology Market for Agriculture, $Million, 2022-2033
- Figure 51: India Computer Vision Technology Market for Agriculture (by Application), $Million, 2022, 2026, and 2033
- Figure 52: India Computer Vision Technology Market for Agriculture (by Product), $Million, 2022, 2026, and 2033
- Figure 53: Japan Computer Vision Technology Market for Agriculture, $Million, 2022-2033
- Figure 54: Japan Computer Vision Technology Market for Agriculture (by Application), $Million, 2022, 2026, and 2033
- Figure 55: Japan Computer Vision Technology Market for Agriculture (by Product), $Million, 2022, 2026, and 2033
- Figure 56: Australia Computer Vision Technology Market for Agriculture, $Million, 2022-2033
- Figure 57: Australia Computer Vision Technology Market for Agriculture (by Application), $Million, 2022, 2026, and 2033
- Figure 58: Australia Computer Vision Technology Market for Agriculture (by Product), $Million, 2022, 2026, and 2033
- Figure 59: Rest-of-Asia-Pacific Computer Vision Technology Market for Agriculture, $Million, 2022-2033
- Figure 60: Rest-of-Asia-Pacific Computer Vision Technology Market for Agriculture (by Application), $Million, 2022, 2026, and 2033
- Figure 61: Rest-of-Asia-Pacific Computer Vision Technology Market for Agriculture (by Product), $Million, 2022, 2026, and 2033
- Figure 62: Brazil Computer Vision Technology Market for Agriculture, $Million, 2022-2033
- Figure 63: Brazil Computer Vision Technology Market for Agriculture (by Application), $Million, 2022, 2026, and 2033
- Figure 64: Brazil Computer Vision Technology Market for Agriculture (by Product), $Million, 2022, 2026, and 2033
- Figure 65: Mexico Computer Vision Technology Market for Agriculture, $Million, 2022-2033
- Figure 66: Mexico Computer Vision Technology Market for Agriculture (by Application), $Million, 2022, 2026, and 2033
- Figure 67: Mexico Computer Vision Technology Market for Agriculture (by Product), $Million, 2022, 2026, and 2033
- Figure 68: Turkey Computer Vision Technology Market for Agriculture, $Million, 2022-2033
- Figure 69: Turkey Computer Vision Technology Market for Agriculture (by Application), $Million, 2022, 2026, and 2033
- Figure 70: Turkey Computer Vision Technology Market for Agriculture (by Product), $Million, 2022, 2026, and 2033
- Figure 71: South Africa Computer Vision Technology Market for Agriculture, $Million, 2022-2033
- Figure 72: South Africa Computer Vision Technology Market for Agriculture (by Application), $Million, 2022, 2026, and 2033
- Figure 73: South Africa Computer Vision Technology Market for Agriculture (by Product), $Million, 2022, 2026, and 2033
- Figure 74: Rest-of-Middle East and Africa Computer Vision Technology Market for Agriculture, $Million, 2022-2033
- Figure 75: Rest-of-Middle East and Africa Computer Vision Technology Market for Agriculture (by Application), $Million, 2022, 2026, and 2033
- Figure 76: Rest-of-Middle East and Africa Computer Vision Technology Market for Agriculture (by Product), $Million, 2022, 2026, and 2033
- Figure 77: Strategic Initiatives, 2020-2023
- Figure 78: Share of Strategic Initiatives
- Figure 79: Data Triangulation
- Figure 80: Top-Down and Bottom-Up Approach
- Figure 81: Assumptions and Limitations
List of Tables
- Table 1: Market Snapshot
- Table 2: Opportunities Across Region
- Table 3: Computer Vision Technology Market for Agriculture (by Region), $Million, 2022-2033
- Table 4: North America Computer Vision Technology Market for Agriculture (by Application), $Million, 2022-2033
- Table 5: North America Computer Vision Technology Market for Agriculture (by Product), $Million, 2022-2033
- Table 6: U.S. Computer Vision Technology Market for Agriculture (by Application), $Million, 2022-2033
- Table 7: U.S. Computer Vision Technology Market for Agriculture (by Product), $Million, 2022-2033
- Table 8: Canada Computer Vision Technology Market for Agriculture (by Application), $Million, 2022-2033
- Table 9: Canada Computer Vision Technology Market for Agriculture (by Product), $Million, 2022-2033
- Table 10: Europe Computer Vision Technology Market for Agriculture (by Application), $Million, 2022-2033
- Table 11: Europe Computer Vision Technology Market for Agriculture (by Product), $Million, 2022-2033
- Table 12: France Computer Vision Technology Market for Agriculture (by Application), $Million, 2022-2033
- Table 13: France Computer Vision Technology Market for Agriculture (by Product), $Million, 2022-2033
- Table 14: Germany Computer Vision Technology Market for Agriculture (by Application), $Million, 2022-2033
- Table 15: Germany Computer Vision Technology Market for Agriculture (by Product), $Million, 2022-2033
- Table 16: U.K. Computer Vision Technology Market for Agriculture (by Application), $Million, 2022-2033
- Table 17: U.K. Computer Vision Technology Market for Agriculture (by Product), $Million, 2022-2033
- Table 18: Spain Computer Vision Technology Market for Agriculture (by Application), $Million, 2022-2033
- Table 19: Spain Computer Vision Technology Market for Agriculture (by Product), $Million, 2022-2033
- Table 20: Italy Computer Vision Technology Market for Agriculture (by Application), $Million, 2022-2033
- Table 21: Italy Computer Vision Technology Market for Agriculture (by Product), $Million, 2022-2033
- Table 22: Belgium Computer Vision Technology Market for Agriculture (by Application), $Million, 2022-2033
- Table 23: Belgium Computer Vision Technology Market for Agriculture (by Product), $Million, 2022-2033
- Table 24: Bulgaria Computer Vision Technology Market for Agriculture (by Application), $Million, 2022-2033
- Table 25: Bulgaria Computer Vision Technology Market for Agriculture (by Product), $Million, 2022-2033
- Table 26: Ukraine Computer Vision Technology Market for Agriculture (by Application), $Million, 2022-2033
- Table 27: Ukraine Computer Vision Technology Market for Agriculture (by Product), $Million, 2022-2033
- Table 28: Rest-of-Europe Computer Vision Technology Market for Agriculture (by Application), $Million, 2022-2033
- Table 29: Rest-of-Europe Computer Vision Technology Market for Agriculture (by Product), $Million, 2022-2033
- Table 30: Asia-Pacific Computer Vision Technology Market for Agriculture (by Application), $Million, 2022-2033
- Table 31: Asia-Pacific Computer Vision Technology Market for Agriculture (by Product), $Million, 2022-2033
- Table 32: China Computer Vision Technology Market for Agriculture (by Application), $Million, 2022-2033
- Table 33: China Computer Vision Technology Market for Agriculture (by Product), $Million, 2022-2033
- Table 34: India Computer Vision Technology Market for Agriculture (by Application), $Million, 2022-2033
- Table 35: India Computer Vision Technology Market for Agriculture (by Product), $Million, 2022-2033
- Table 36: Japan Computer Vision Technology Market for Agriculture (by Application), $Million, 2022-2033
- Table 37: Japan Computer Vision Technology Market for Agriculture (by Product), $Million, 2022-2033
- Table 38: Australia Computer Vision Technology Market for Agriculture (by Application), $Million, 2022-2033
- Table 39: Australia Computer Vision Technology Market for Agriculture (by Product), $Million, 2022-2033
- Table 40: Rest-of-Asia-Pacific Computer Vision Technology Market for Agriculture (by Application), $Million, 2022-2033
- Table 41: Rest-of-Asia-Pacific Computer Vision Technology Market for Agriculture (by Product), $Million, 2022-2033
- Table 42: Latin America Computer Vision Technology Market for Agriculture (by Application), $Million, 2022-2033
- Table 43: Latin America Computer Vision Technology Market for Agriculture (by Product), $Million, 2022-2033
- Table 44: Brazil Computer Vision Technology Market for Agriculture (by Application), $Million, 2022-2033
- Table 45: Brazil Computer Vision Technology Market for Agriculture (by Product), $Million, 2022-2033
- Table 46: Mexico Computer Vision Technology Market for Agriculture (by Application), $Million, 2022-2033
- Table 47: Mexico Computer Vision Technology Market for Agriculture (by Product), $Million, 2022-2033
- Table 48: Middle East and Africa Computer Vision Technology Market for Agriculture (by Application), $Million, 2022-2033
- Table 49: Middle East and Africa Computer Vision Technology Market for Agriculture (by Product), $Million, 2022-2033
- Table 50: Turkey Computer Vision Technology Market for Agriculture (by Application), $Million, 2022-2033
- Table 51: Turkey Computer Vision Technology Market for Agriculture (by Product), $Million, 2022-2033
- Table 52: South Africa Computer Vision Technology Market for Agriculture (by Application), $Million, 2022-2033
- Table 53: South Africa Computer Vision Technology Market for Agriculture (by Product), $Million, 2022-2033
- Table 54: Rest-of-Middle East and Computer Vision Technology Market for Agriculture (by Application), $Million, 2022-2033
- Table 55: Rest-of-Middle East and Africa Computer Vision Technology Market for Agriculture (by Product), $Million, 2022-2033
- Table 56: Market Share
Computer Vision Technology Market for Agriculture Overview
The computer vision technology market for agriculture was valued at $432.0 million in 2023, and it is expected to grow at a CAGR of 16.78% and reach $2,037.5 million by 2033. The computer vision technology market for agriculture is currently in a dynamic growth phase, marked by rapid advancements and heightened adoption. The market exhibits a degree of fragmentation, with diverse players contributing to specialized applications within the agriculture sector. Key companies such as Climate LLC, Granular, IBM Corporation, Ceres Imaging, and Deere & Company hold notable market shares, indicating a mix of technology-focused startups and established giants collectively shaping the landscape of computer vision solutions in agriculture. As the market matures, consolidation trends may emerge, influencing the competitive dynamics and further fueling the integration of computer vision technologies into modern farming practices. As of 2022, significant players held around 30% of market shares in the computer vision technology market for agriculture. These percentages underscore the influence of these companies in driving innovation and technology adoption in the agricultural sector, reflecting the evolving landscape of precision farming and broader application of computer vision solutions.
Market Introduction
| KEY MARKET STATISTICS | |
|---|---|
| Forecast Period | 2023 - 2033 |
| 2023 Evaluation | $432.0 Million |
| 2033 Forecast | $2,037.5 Million |
| CAGR | 16.78% |
In the computer vision technology market for agriculture, this study encompasses companies that develop and provide software applications utilizing computer vision techniques for analyzing visual data related to agricultural processes. These software providers specialize in creating algorithms, image processing, object detection, and deep learning models tailored for agricultural applications.
The market is characterized by entities offering innovative solutions designed for the following applications such as biotic stress monitoring, harvest dynamic monitoring, autonomous equipment control, and abiotic stress monitoring in agriculture, with a focus on interpreting and extracting valuable insights from visual data captured through various imaging devices.
The products offered by the players in the market have been segmented into data processing and analytics and operational integration and automation.
Industrial Impact
During the forecast period 2023-2033, the computer vision technology market for agriculture is set to undergo substantial evolution and expansion. Persistent advancements in computer vision technologies will drive the development of more sophisticated and cost-effective solutions for analyzing agricultural data. With an increased emphasis on sustainability and adherence to circular economy principles, governments, industries, and consumers will prioritize the integration of computer vision for optimizing farming practices. A surge in investments directed toward startups specializing in computer vision for agriculture and dedicated research and development initiatives can be expected. This era presents a golden opportunity for the computer vision technology market for agriculture to mature and firmly establish itself as an indispensable component of the sustainable farming landscape. Companies that swiftly embrace technological advancements and foster effective collaborations are poised for significant growth and a leading position in this transformative market.
The key players operating in the computer vision technology market for agriculture include Climate LLC, Granular Inc., IBM Corporation, Ceres Imaging, Deere & Company, Prospera Technologies, AgEagle Aerial Systems Inc (MicaSense), Taranis, PrecisionHawk, Inc., Gamaya, Plantix, DJI, Iteris, Inc., CropIn Technology Solutions, and HIPHEN (SlantRange, Inc.), among others. These companies focus on strategic partnerships, collaborations, and product launches to enhance their product offerings and expand their market presence.
Market Segmentation:
Segmentation 1: by Application
- Biotic Stress Monitoring
- Harvest Dynamic Monitoring
- Autonomous Equipment Control
- Abiotic Stress Monitoring
Biotic Stress Monitoring to Dominate the Computer Vision Technology Market for Agriculture (by Application)
Biotic stress monitoring, encompassing disease, pest, and weed detection, stands as a cornerstone in contemporary agriculture, utilizing cameras to capture various growth stages and enhance production efficiency. This approach empowers farmers to swiftly identify subtle abnormalities in crop development caused by factors such as malnutrition, disease, or pest infestation. The integration of advanced computer vision applications, such as Taranis and Blue River Technology, has become integral to modern farming practices. These technologies analyze vast fields with high-resolution imagery and artificial intelligence algorithms, providing real-time insights. This capability enables farmers to make informed decisions, proactively manage issues such as pest infestations, and optimize resource allocation for improved crop health and productivity, ensuring a more sustainable and efficient future for agriculture.
Biotic stress monitoring through computer vision allows providers to swiftly detect and identify plant diseases or pest infestations. This proactive approach enables timely intervention, minimizes crop damage, and increases agricultural productivity. By leveraging real-time data and image analysis, computer vision providers can offer farmers precise and targeted solutions, optimizing resource utilization and contributing to sustainable farming practices. Overall, biotic stress monitoring enhances efficiency and resilience in agriculture.
Segmentation 2: by Product
- Data Processing and Analytics
- Operational Integration and Automation
Data Processing and Analytics to Dominate the Computer Vision Technology Market for Agriculture (by Product)
The data processing and analytics segment in the computer vision technology market for agriculture is rapidly growing and plays a crucial role in modern farming practices. A report on the ""Environmental Benefits of Precision Agriculture in the U.S."" highlights that adopting precision agriculture technologies has resulted in avoiding the application of an estimated 30 million pounds of herbicide. Furthermore, there is potential to avoid an additional 48 million pounds of herbicide with broader adoption of precision agriculture. This underscores the importance of raising awareness about the adoption of advanced technologies such as computer vision in agriculture. Such technologies assist farms in identifying and controlling weed growth at an early stage, preventing the unnecessary overuse of herbicides. This not only benefits the environment but also contributes to more efficient and sustainable farming practices.
Data processing and analytics empower computer vision providers by enhancing the accuracy and efficiency of image recognition algorithms. Through the analysis of vast datasets, these providers can refine their models, improving object detection and classification. Real-time processing enables quicker decision-making in applications such as autonomous vehicles and surveillance. Overall, data-driven insights contribute to the continual advancement and optimization of computer vision systems.
Segmentation 3: by Region
- North America: U.S. and Canada
- Europe: France, Germany, Spain, Italy, Belgium, Bulgaria, Ukraine, U.K., and Rest-of-Europe
- Asia-Pacific: China, India, Japan, Australia and Rest-of-Asia-Pacific
- Latin America: Brazil and Mexico
- Middle East and Africa: Turkey, South Africa, and Rest-of-Middle East and Africa
In recent years, the use of computer vision technology in agriculture has grown significantly worldwide, with North America leading the way in its adoption. Precision agriculture initiatives, such as automated crop monitoring and yield prediction, have propelled the region to the forefront, reflecting a progressive approach to enhance agricultural efficiency. For example, in 2020, the University of California, Davis, utilized drones equipped with computer vision for a study. It gathered data on crop health and growth, revealing the technology's ability to detect early signs of disease and pests. This breakthrough resulted in reduced pesticide use and increased crop yields. The integration of automated drone surveillance and AI-driven image analysis tools on farms underscores North America's dedication to leveraging advanced technologies for enhanced crop management.
The swift adoption of precision agriculture is also driving the growth of the computer vision technology market for agriculture in North American countries. The integration of AI and computer vision in precision farming is proving to be highly beneficial by optimizing planting, irrigation, and fertilization based on real-time data and can bring about significant input cost savings. According to a report from the Precision Agriculture Development Trust published in 2022, precision farming has the potential to boost crop yields by up to 30%, highlighting the substantial positive impact of technology on modern agriculture practices.
Recent Developments in the Computer Vision Technology Market for Agriculture
- In February 2020, DJI and Syngenta Korea announced an alliance for enhancement in the agriculture drone sector. The companies announced the launch of a range of aerial application standards and technical courses to promote the growth of aerial pesticide applications in South Korea.
- In February 2022, Ceres Imaging partnered with WiseConn to aid farmers in seeing soil moisture data derived from aerial imagery from Ceres, thereby making it easier for farmers to comprehend data and make informed decisions.
- In November 2019, Deere & Company partnered with Agricon GmbH, which is a provider of precision agriculture and agronomic digital solutions. Agricon GmbH would provide its FarmSight service packages through the Deere & Company dealer channels.
- In April 2019, Pheasants Forever partnered with Climate LLC to provide free technical assistance to Climate FieldView platform users who wish to identify farm-specific preservation options for low-performing areas.
- In September 2022, the first-ever commercial digital diagnosis and mapping solution by analyzing photographs taken from satellites for hazardous nematode pests was released as a result of the multi-year partnership between Gamaya and Syngenta AG. The innovative and ground-breaking technology created by Gamaya SA and Syngenta would be incorporated into the CROPWISE digital technology platform.
Demand - Drivers, Limitations, and Opportunities
Market Drivers: Advancement of Deep Learning Techniques
- Deep learning (DL), a pivotal aspect of artificial intelligence, harnesses artificial neural networks (ANNs) to glean insights from vast datasets and execute diverse tasks. Particularly impactful in computer vision (CV), which pertains to the interpretation and processing of visual information, DL's applications in agriculture are extensive.
- In this sector, it facilitates tasks such as crop monitoring, autonomous harvesting, weather analytics, animal health tracking, and plant disease diagnosis.
- For CV technology providers in agriculture, DL brings multifaceted advantages. It enhances model accuracy and complexity by assimilating insights from extensive data, reducing the risk and cost of crop failures through weather and soil condition analysis, and maximizing crop yield and quality by identifying diseases and optimizing harvesting.
Market Challenges: Navigating Data Ownership and Privacy Challenges
- The integration of artificial intelligence (AI) and computer vision in farming and breeding relies heavily on processing data from remote sensors, UAVs, and satellites. While many farmers embrace digitalization, some hesitate to share data due to the lack of clear legal frameworks on issues such as ownership, privacy, cybersecurity, and liability. Some companies have unlawfully shared farm data, raising concerns about data privacy among farmers.
- The major stakeholders in agricultural data include farmers, agricultural technology providers, input companies, and governments. Computer vision adoption raises concerns about data exposure and identity disclosure to hackers. A survey by the American Farm Bureau Federation revealed that over 75% of farmers worry about data ownership and potential regulatory use, while 60% fear companies influencing market decisions using their agricultural data.
Market Opportunities: Fostering Digital Agriculture through Global Government Initiatives
- Government initiatives to promote digital agriculture encompass public-private partnerships and the establishment of a supportive environment for companies, be they established or startups, to introduce computer vision-based products. Notably, the U.S. Department of Agriculture has launched diverse programs leveraging computer vision in agricultural facets such as production, food supply chain, sensor development, ecosystem management, and rural community support. Robotic solutions for tasks such as pollination, pesticide application, weeding, and harvesting are also promoted. The American Research Service collaborates with companies to integrate computer vision and AI in livestock monitoring, irrigation analysis, robotic harvesting, and drone-based crop health monitoring.
- In India, the state government of Karnataka entered a memorandum of understanding (MoU) with Microsoft in 2007, aiming to enhance agricultural productivity through innovative technologies, primarily computer vision. The Indian government further partnered with IBM to deploy the AI-based Watson Decision Platform for Agriculture, offering accurate weather forecasts and soil information to empower local farmers in making informed decisions on crop and water management. This trend is anticipated to proliferate globally, fostering increased opportunities in the IoT-driven agriculture industry.
How can this report add value to an organization?
Product/Innovation Strategy: The product segment helps the reader understand the different applications of computer vision technology applications (i.e., biotic stress monitoring, harvest dynamic monitoring, autonomous equipment control, and abiotic stress monitoring) and products (i.e., data processing and analytics and operational integration and automation). The market is poised for significant expansion with ongoing technological advancements, increased investments, and growing awareness of computer vision technology. Therefore, the computer vision technology business is a high-investment and high-revenue generating model.
Growth/Marketing Strategy: The computer vision technology market for agriculture has been growing at a rapid pace. The market offers enormous opportunities for existing and emerging market players. Some of the strategies covered in this segment are mergers and acquisitions, product launches, partnerships and collaborations, business expansions, and investments. The strategies preferred by companies to maintain and strengthen their market position primarily include partnerships and collaborations.
Competitive Strategy: The key players in the computer vision technology market for agriculture analyzed and profiled in the study include computer vision technology manufacturers that produce computer vision technology. Additionally, a comprehensive competitive landscape such as partnerships, agreements, and collaborations are expected to aid the reader in understanding the untapped revenue pockets in the market.
Research Methodology
Factors for Data Prediction and Modeling
- The base currency considered for the market analysis is US$. Currencies other than the US$ have been converted to the US$ for all statistical calculations, considering the average conversion rate for that particular year.
- The currency conversion rate has been taken from the historical exchange rate of the Oanda website.
- Nearly all the recent developments from January 2020 to January 2024 have been considered in this research study.
- The information rendered in the report is a result of in-depth primary interviews, surveys, and secondary analysis.
- Where relevant information was not available, proxy indicators and extrapolation were employed.
- Any economic downturn in the future has not been taken into consideration for the market estimation and forecast.
- Technologies currently used are expected to persist through the forecast with no major breakthroughs in technology.
Market Estimation and Forecast
This research study involves the usage of extensive secondary sources, such as certified publications, articles from recognized authors, white papers, annual reports of companies, directories, and major databases to collect useful and effective information for an extensive, technical, market-oriented, and commercial study of the global computer vision technology market for agriculture.
The process of market engineering involves the calculation of the market statistics, market size estimation, market forecast, market crackdown, and data triangulation (the methodology for such quantitative data processes is explained in further sections). The primary research study has been undertaken to gather information and validate the market numbers for segmentation types and industry trends of the key players in the market.
Primary Research
The primary sources involve industry experts from the computer vision technology market for agriculture and various stakeholders in the ecosystem. Respondents such as CEOs, vice presidents, marketing directors, and technology and innovation directors have been interviewed to obtain and verify both qualitative and quantitative aspects of this research study.
The key data points taken from primary sources Include:
- validation and triangulation of all the numbers and graphs
- validation of reports segmentation and key qualitative findings
- understanding the competitive landscape
- validation of the numbers of various markets for market type
- percentage split of individual markets for geographical analysis
Secondary Research
This research study involves the usage of extensive secondary research, directories, company websites, and annual reports. It also makes use of databases, such as Hoovers, Bloomberg, Businessweek, and Factiva, to collect useful and effective information for an extensive, technical, market-oriented, and commercial study of the global market. In addition to the aforementioned data sources, the study has been undertaken with the help of other data sources and websites, such as GFI and Delft University of Technology.
Secondary research was done in order to obtain crucial information about the industry's value chain, revenue models, the market's monetary chain, the total pool of key players, and the current and potential use cases and applications.
The key data points taken from secondary research include:
- segmentations and percentage shares
- data for market value
- key industry trends of the top players of the market
- qualitative insights into various aspects of the market, key trends, and emerging areas of innovation
- quantitative data for mathematical and statistical calculations
Key Market Players and Competition Synopsis
The companies that are profiled have been selected based on inputs gathered from primary experts and analyzing company coverage, product portfolio, and market penetration.
Some of the prominent companies in this market are:
- Climate LLC
- Granular Inc.
- IBM Corporation
- Ceres Imaging
- Deere & Company
- Prospera Technologies
- AgEagle Aerial Systems Inc (MicaSense)
- Taranis
- PrecisionHawk, Inc.
- Gamaya
- Plantix
- DJI
- Iteris, Inc.
- CropIn Technology Solutions
- HIPHEN (SlantRange, Inc.)
Companies that are not a part of the aforementioned pool have been well represented across different sections of the report (wherever applicable).
Table of Contents
Executive Summary
Scope and Definition
1 Markets
- 1.1 Trends: Current and Future Impact Assessment
- 1.1.1 Enhanced Utilization of AI-Enhanced Computer Vision Phenotyping
- 1.1.2 Advancement in Agriculture Automation via Vision-Based Technology
- 1.2 Supply Chain Overview
- 1.2.1 Value Chain Analysis
- 1.2.2 Market Map
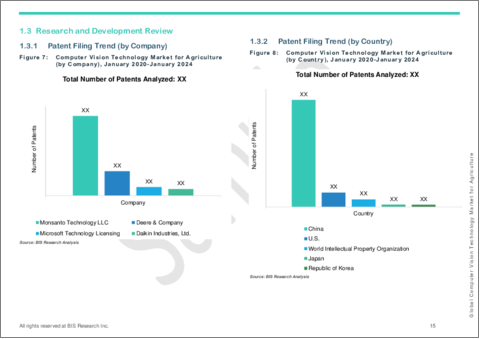
- 1.3 Research and Development Review
- 1.3.1 Patent Filing Trend (by Company)
- 1.3.2 Patent Filing Trend (by Country)
- 1.4 Regulatory Landscape
- 1.5 Impact Analysis for Key Global Events - COVID-19
- 1.6 Market Dynamics Overview
- 1.6.1 Market Drivers
- 1.6.1.1 Advancement of Deep Learning Techniques
- 1.6.1.2 Availability of Low-Cost Sensors and Cameras
- 1.6.2 Market Restraints
- 1.6.2.1 Navigating Data Ownership and Privacy Challenges
- 1.6.2.2 Lack of Standardization in Agricultural Data Governance
- 1.6.3 Market Opportunities
- 1.6.3.1 Fostering Digital Agriculture through Global Government Initiatives
- 1.6.3.2 Navigating Challenges and Unlocking Sustainable Solutions for Global Food Security
- 1.6.1 Market Drivers
2 Application
- 2.1 Application Segmentation
- 2.2 Application Summary
- 2.3 Global Computer Vision Technology Market for Agriculture Market (by Application)
- 2.4.1 Biotic Stress Monitoring
- 2.4.2 Harvest Dynamic Monitoring
- 2.4.3 Autonomous Equipment Control
- 2.4.4 Abiotic Stress Monitoring
3 Products
- 3.1 Product Segmentation
- 3.2 Product Summary
- 3.3 Global Computer Vision Technology Market for Agriculture Market (by Product)
- 3.3.1 Data Processing and Analytics
- 3.3.2 Operational Integration and Automation
4 Regions
- 4.1 Regional Summary
- 4.2 Drivers and Restraints
- 4.3 North America
- 4.3.1 Regional Overview
- 4.3.2 Driving Factors for Market Growth
- 4.3.3 Factors Challenging the Market
- 4.3.4 Application
- 4.3.5 Product
- 4.3.6 U.S.
- 4.3.7 U.S. Computer Vision Technology Market for Agriculture (by Application)
- 4.3.8 U.S. Computer Vision Technology Market for Agriculture (by Product)
- 4.3.9 Canada
- 4.3.10 Canada Computer Vision Technology Market for Agriculture (by Application)
- 4.3.11 Canada Computer Vision Technology Market for Agriculture (by Product)
- 4.4 Europe
- 4.4.1 Regional Overview
- 4.4.2 Driving Factors for Market Growth
- 4.4.3 Factors Challenging the Market
- 4.4.4 Application
- 4.4.5 Product
- 4.4.6 France
- 4.4.7 France Computer Vision Technology Market for Agriculture (by Application)
- 4.4.8 France Computer Vision Technology Market for Agriculture (by Product)
- 4.4.9 Germany
- 4.4.10 Germany Computer Vision Technology Market for Agriculture (by Application)
- 4.4.11 Germany Computer Vision Technology Market for Agriculture (by Product)
- 4.4.12 U.K.
- 4.4.13 U.K. Computer Vision Technology Market for Agriculture (by Application)
- 4.4.14 U.K. Computer Vision Technology Market for Agriculture (by Product)
- 4.4.15 Spain
- 4.4.16 Spain Computer Vision Technology Market for Agriculture (by Application)
- 4.4.17 Spain Computer Vision Technology Market for Agriculture (by Product)
- 4.4.18 Italy
- 4.4.19 Italy Computer Vision Technology Market for Agriculture (by Application)
- 4.4.20 Italy Computer Vision Technology Market for Agriculture (by Product)
- 4.4.21 Belgium
- 4.4.22 Belgium Computer Vision Technology Market for Agriculture (by Application)
- 4.4.23 Belgium Computer Vision Technology Market for Agriculture (by Product)
- 4.4.24 Bulgaria
- 4.4.25 Bulgaria Computer Vision Technology Market for Agriculture (by Application)
- 4.4.26 Bulgaria Computer Vision Technology Market for Agriculture (by Product)
- 4.4.27 Ukraine
- 4.4.28 Ukraine Computer Vision Technology Market for Agriculture (by Application)
- 4.4.29 Ukraine Computer Vision Technology Market for Agriculture (by Product)
- 4.4.30 Rest-of-Europe
- 4.4.31 Rest-of-Europe Computer Vision Technology Market for Agriculture (by Application)
- 4.4.32 Rest-of-Europe Computer Vision Technology Market for Agriculture (by Product)
- 4.5 Asia-Pacific
- 4.5.1 Regional Overview
- 4.5.2 Driving Factors for Market Growth
- 4.5.3 Factors Challenging the Market
- 4.5.4 Application
- 4.5.5 Product
- 4.5.6 China
- 4.5.7 China Computer Vision Technology Market for Agriculture (by Application)
- 4.5.8 China Computer Vision Technology Market for Agriculture (by Product)
- 4.5.9 India
- 4.5.10 India Computer Vision Technology Market for Agriculture (by Application)
- 4.5.11 India Computer Vision Technology Market for Agriculture (by Product)
- 4.5.12 Japan
- 4.5.13 Japan Computer Vision Technology Market for Agriculture (by Application)
- 4.5.14 Japan Computer Vision Technology Market for Agriculture (by Product)
- 4.5.15 Australia
- 4.5.16 Australia Computer Vision Technology Market for Agriculture (by Application)
- 4.5.17 Australia Computer Vision Technology Market for Agriculture (by Product)
- 4.5.18 Rest-of-Asia-Pacific
- 4.5.19 Rest-of-Asia-Pacific Computer Vision Technology Market for Agriculture (by Application)
- 4.5.20 Rest-of-Asia-Pacific Computer Vision Technology Market for Agriculture (by Product)
- 4.6 Latin America
- 4.6.1 Regional Overview
- 4.6.2 Driving Factors for Market Growth
- 4.6.3 Factors Challenging the Market
- 4.6.4 Application
- 4.6.5 Product
- 4.6.6 Brazil
- 4.6.7 Brazil Computer Vision Technology Market for Agriculture (by Application)
- 4.6.8 Brazil Computer Vision Technology Market for Agriculture (by Product)
- 4.6.1 Mexico
- 4.6.2 Mexico Computer Vision Technology Market for Agriculture (by Application)
- 4.6.3 Mexico Computer Vision Technology Market for Agriculture (by Product)
- 4.7 Middle East and Africa
- 4.7.1 Regional Overview
- 4.7.2 Driving Factors for Market Growth
- 4.7.3 Factors Challenging the Market
- 4.7.4 Application
- 4.7.5 Product
- 4.7.6 Turkey
- 4.7.7 Turkey Computer Vision Technology Market for Agriculture (by Application)
- 4.7.8 Turkey Computer Vision Technology Market for Agriculture (by Product)
- 4.7.9 South Africa
- 4.7.10 South Africa Computer Vision Technology Market for Agriculture (by Application)
- 4.7.11 South Africa Computer Vision Technology Market for Agriculture (by Product)
- 4.7.12 Rest-of-Middle East and Africa
- 4.7.13 Rest-of-Middle East and Africa Computer Vision Technology Market for Agriculture (by Application)
- 4.7.14 Rest-of-Middle East and Africa Computer Vision Technology Market for Agriculture (by Product)
5 Markets - Competitive Benchmarking & Company Profiles
- 5.1 Next Frontiers
- 5.2 Geographic Assessment
- 5.2.1 IBM Corporation
- 5.2.1.1 Overview
- 5.2.1.2 Top Products/Product Portfolio
- 5.2.1.3 Top Competitors
- 5.2.1.4 Target Customers
- 5.2.1.5 Key Personnel
- 5.2.1.6 Analyst View
- 5.2.1.7 Market Share
- 5.2.2 Climate LLC
- 5.2.2.1 Overview
- 5.2.2.2 Top Products/Product Portfolio
- 5.2.2.3 Top Competitors
- 5.2.2.4 Target Customers
- 5.2.2.5 Key Personnel
- 5.2.2.6 Analyst View
- 5.2.2.7 Market Share
- 5.2.3 Deere & Company
- 5.2.3.1 Overview
- 5.2.3.2 Top Products/Product Portfolio
- 5.2.3.3 Top Competitors
- 5.2.3.4 Target Customers
- 5.2.3.5 Key Personnel
- 5.2.3.6 Analyst View
- 5.2.3.7 Market Share
- 5.2.4 Gamaya
- 5.2.4.1 Overview
- 5.2.4.2 Top Products/Product Portfolio
- 5.2.4.3 Top Competitors
- 5.2.4.4 Target Customers
- 5.2.4.5 Key Personnel
- 5.2.4.6 Analyst View
- 5.2.4.7 Market Share
- 5.2.5 Taranis
- 5.2.5.1 Overview
- 5.2.5.2 Top Products/Product Portfolio
- 5.2.5.3 Top Competitors
- 5.2.5.4 Target Customers
- 5.2.5.5 Key Personnel
- 5.2.5.6 Analyst View
- 5.2.5.7 Market Share
- 5.2.6 Prospera Technologies
- 5.2.6.1 Overview
- 5.2.6.2 Top Products/Product Portfolio
- 5.2.6.3 Top Competitors
- 5.2.6.4 Target Customers
- 5.2.6.5 Key Personnel
- 5.2.6.6 Analyst View
- 5.2.6.7 Market Share
- 5.2.7 Granular Inc.
- 5.2.7.1 Overview
- 5.2.7.2 Top Products/Product Portfolio
- 5.2.7.3 Top Competitors
- 5.2.7.4 Target Customers
- 5.2.7.5 Key Personnel
- 5.2.7.6 Analyst View
- 5.2.7.7 Market Share
- 5.2.8 Ceres Imaging
- 5.2.8.1 Overview
- 5.2.8.2 Top Products/Product Portfolio
- 5.2.8.3 Top Competitors
- 5.2.8.4 Target Customers
- 5.2.8.5 Key Personnel
- 5.2.8.6 Analyst View
- 5.2.8.7 Market Share
- 5.2.9 HIPHEN (SlantRange, Inc.)
- 5.2.9.1 Overview
- 5.2.9.2 Top Products/Product Portfolio
- 5.2.9.3 Top Competitors
- 5.2.9.4 Target Customers
- 5.2.9.5 Key Personnel
- 5.2.9.6 Analyst View
- 5.2.9.7 Market Share
- 5.2.10 AgEagle Aerial Systems Inc (MicaSense)
- 5.2.10.1 Overview
- 5.2.10.2 Top Products/Product Portfolio
- 5.2.10.3 Top Competitors
- 5.2.10.4 Target Customers
- 5.2.10.5 Key Personnel
- 5.2.10.6 Analyst View
- 5.2.10.7 Market Share
- 5.2.11 PrecisionHawk, Inc.
- 5.2.11.1 Overview
- 5.2.11.2 Top Products/Product Portfolio
- 5.2.11.3 Top Competitors
- 5.2.11.4 Target Customers
- 5.2.11.5 Key Personnel
- 5.2.11.6 Analyst View
- 5.2.11.7 Market Share
- 5.2.12 Iteris, Inc.
- 5.2.12.1 Overview
- 5.2.12.2 Top Products/Product Portfolio
- 5.2.12.3 Top Competitors
- 5.2.12.4 Target Customers
- 5.2.12.5 Key Personnel
- 5.2.12.6 Analyst View
- 5.2.12.7 Market Share
- 5.2.13 CropIn Technology Solutions
- 5.2.13.1 Overview
- 5.2.13.2 Top Products/Product Portfolio
- 5.2.13.3 Top Competitors
- 5.2.13.4 Target Customers
- 5.2.13.5 Key Personnel
- 5.2.13.6 Analyst View
- 5.2.13.7 Market Share
- 5.2.14 DJI
- 5.2.14.1 Overview
- 5.2.14.2 Top Products/Product Portfolio
- 5.2.14.3 Top Competitors
- 5.2.14.4 Target Customers
- 5.2.14.5 Key Personnel
- 5.2.14.6 Analyst View
- 5.2.14.7 Market Share
- 5.2.15 Plantix
- 5.2.15.1 Overview
- 5.2.15.2 Top Products/Product Portfolio
- 5.2.15.3 Top Competitors
- 5.2.15.4 Target Customers
- 5.2.15.5 Key Personnel
- 5.2.15.6 Analyst View
- 5.2.15.7 Market Share
- 5.2.1 IBM Corporation
6 Research Methodology
- 6.1 Data Sources
- 6.1.1 Primary Data Sources
- 6.1.2 Secondary Data Sources
- 6.1.3 Data Triangulation
- 6.2 Market Estimation and Forecast

