|
|
市場調査レポート
商品コード
1399756
アジア太平洋の水素化分解植物油市場の分析・予測:2023-2032年Asia-Pacific Hydrotreated Vegetable Oil Market - Analysis and Forecast, 2023-2032 |
||||||
|
|
|||||||
カスタマイズ可能
|
|||||||


| アジア太平洋の水素化分解植物油市場の分析・予測:2023-2032年 |
|
出版日: 2023年12月28日
発行: BIS Research
ページ情報: 英文 112 Pages
納期: 1~5営業日
|

- 全表示
- 概要
- 図表
- 目次
中国を除くアジア太平洋の水素化分解植物油の市場規模は、2022年の13億7,000万米ドルから、予測期間中は19.73%の成長率で推移し、2032年には87億3,000万米ドルの規模に成長すると予測されています。 自動車、航空、海運、農業、工業などのエンドユーザー産業からの需要の増加が、再生可能ディーゼルや持続可能な航空燃料のような水素化分解植物油ベースの燃料の需要を押し上げると予想されています。
しかし一方で、原料の供給が限られているため、脂肪酸をベースとした原料の安定供給を求める市場競争が激化しており、これが水素化分解植物油市場の開拓を妨げています。
市場イントロダクション
| 主要市場統計 | |
|---|---|
| 予測期間 | 2023-2032年 |
| 2023年評価 | 17億2,000万米ドル |
| 2032年予測 | 87億3,000万米ドル |
| CAGR | 19.73% |
アジア太平洋市場は、水素化処理された植物油から製造される再生可能ディーゼルから大きな恩恵を受けると考えられています。再生可能性は、炭素排出の削減に貢献し、気候変動や温室効果ガスの大気中濃度との闘いに有益です。さらに、航空機のエンジンや給油インフラに大きな変更を加えることなく、従来のジェット燃料を持続可能な航空燃料 (SAF) に容易に置き換えることができます。航空会社は、このシンプルなインターフェースのおかげで、機材やインフラに大きな変更を加えることなくSAFを使用することができます。
当レポートでは、アジア太平洋の水素化分解植物油の市場を調査し、市場の背景・概要、市場成長への各種影響因子の分析、特許動向、エコシステムと進行中のプログラム、市場規模の推移・予測、各種区分・主要国別の詳細分析、競合情勢、主要企業の分析などをまとめています。
市場の分類
セグメンテーション1:用途別
- 再生可能ディーゼル
- 持続可能な航空燃料 (SAF)
セグメンテーション2:エンドユーザー別
- 輸送
- 農業機械
- 産業
- その他 (住宅、商業ビル、データセンター)
セグメンテーション3:原料タイプ別
- 食用植物油
- 粗パーム油
- 使用済み食用油
- トール油
- 動物性油脂
- その他 (非食用植物油、パーム油工場廃液、精製副産物)
セグメンテーション4:技術タイプ別
- 独立型水素化処理技術
- コプロセシング技術
セグメンテーション5:国別
- 日本
- インドネシア
- マレーシア
- シンガポール
- その他
目次
エグゼクティブサマリー
調査範囲
第1章 市場
- 業界の展望
- 動向:現在と未来
- サプライチェーン分析
- エコシステム/進行中のプログラム
- 主要な特許分析
- 事業力学
- 事業促進要因
- 事業の制限
- 事業戦略
- 経営戦略
- 事業機会
- 水素化分解植物油と他の持続可能な燃料の比較
- 将来の水素化植物油原料
- 生産能力分析
- 水素化分解植物油の需給分析
第2章 地域
- 中国
- 市場
- 用途
- 製品
- アジア太平洋と日本
- 市場
- 用途
- 製品
- アジア太平洋と日本:国レベルの分析
第3章 市場:競合ベンチマーキング・企業プロファイル
- 競合ベンチマーキング
- 市場シェア分析
- 企業プロファイル
- PT Pertamina
第4章 調査手法
List of Figures
- Figure 1: Hydrotreated Vegetable Oil Market Overview, Billion Liters, 2022-2032
- Figure 2: Hydrotreated Vegetable Oil Market Overview, $Billion, 2022-2032
- Figure 3: Hydrotreated Vegetable Oil Market (by Application), $Billion, 2022-2032
- Figure 4: Hydrotreated Vegetable Oil Market (by End User), $Billion, 2022-2032
- Figure 5: Hydrotreated Vegetable Oil Market (by Feedstock Type), $Billion, 2022-2032
- Figure 6: Hydrotreated Vegetable Oil Market (by Technology Type), $Billion, 2022-2032
- Figure 7: Hydrotreated Vegetable Oil Market (by Region), $Billion, 2022
- Figure 8: Hydrotreated Vegetable Oil Market Supply Chain Analysis
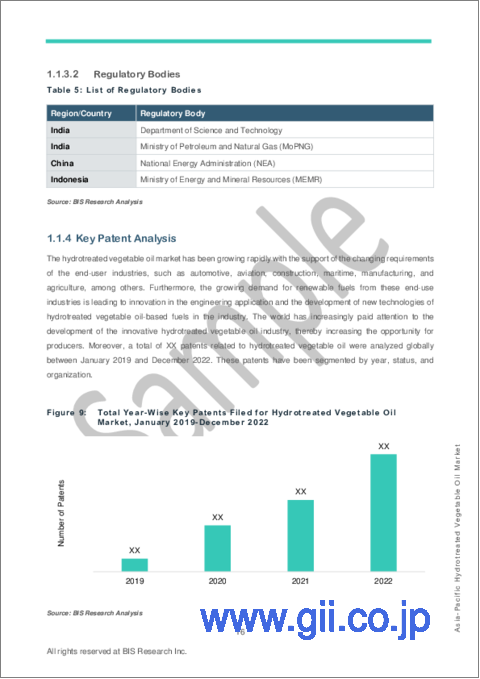
- Figure 9: Total Year-Wise Key Patents Filed for Hydrotreated Vegetable Oil Market, January 2019-December 2022
- Figure 10: Total Year-Wise Key Patents Granted for Hydrotreated Vegetable Oil Market, January 2019-December 2022
- Figure 11: Key Patent Analysis (by Status), January 2019-December 2022
- Figure 12: Key Patent Analysis (by Organization), January 2019-December 2022
- Figure 13: Business Dynamics for Hydrotreated Vegetable Oil Market
- Figure 14: Carbon Dioxide Emission by Countries in 2021
- Figure 15: Hydrotreated Vegetable Oil Production Capacities, Million Liters, 2019-2022
- Figure 16: Capacity Addition Share (by Region), 2019-2022
- Figure 17: Renewable Diesel Supply Growth by Region in 2022:
- Figure 18: Renewable Diesel Demand Growth by Region in 2021-2022:
- Figure 19: Sustainable Aviation Fuel (SAF) Supply Growth between 2018-2022:
- Figure 20: Sustainable Aviation Fuel (SAF) Demand Growth by Region in 2021-2022:
- Figure 21: Competitive Benchmarking for Hydrotreated Vegetable Oil Market
- Figure 22: Research Methodology
- Figure 23: Data Triangulation
- Figure 24: Top-Down and Bottom-Up Approach
- Figure 25: Assumptions and Limitations
List of Tables
- Table 1: Hydrotreated Vegetable Oil Market Overview
- Table 2: Comparison between HVO Diesel and Fossil Diesel
- Table 3: List of Key Startups
- Table 4: Key Consortiums and Associations
- Table 5: List of Regulatory Bodies
- Table 6: Production Capacity Expansion (by Companies)
- Table 7: Hydrotreated Vegetable Oil Market (by Region), Million Liters, 2022-2032
- Table 8: Hydrotreated Vegetable Oil Market (by Region), $Million, 2022-2032
- Table 9: China Hydrotreated Vegetable Oil Market (by Application), Million Liters, 2022-2032
- Table 10: China Hydrotreated Vegetable Oil Market (by Application), $Million, 2022-2032
- Table 11: China Hydrotreated Vegetable Oil Market (by End Users), Million Liters, 2022-2032
- Table 12: China Hydrotreated Vegetable Oil Market (by End Users), $Million, 2022-2032
- Table 13: China Hydrotreated Vegetable Oil Market (by Feedstock Type), Million Liters, 2022-2032
- Table 14: China Hydrotreated Vegetable Oil Market (by Feedstock Type), $Million, 2022-2032
- Table 15: China Hydrotreated Vegetable Oil Market (by Technology Type), Million Liters, 2022-2032
- Table 16: China Hydrotreated Vegetable Oil Market (by Technology Type), $Million, 2022-2032
- Table 17: Asia-Pacific and Japan Hydrotreated Vegetable Oil Market (by Application), Million Liters, 2022-2032
- Table 18: Asia-Pacific and Japan Hydrotreated Vegetable Oil Market (by Application), $Million, 2022-2032
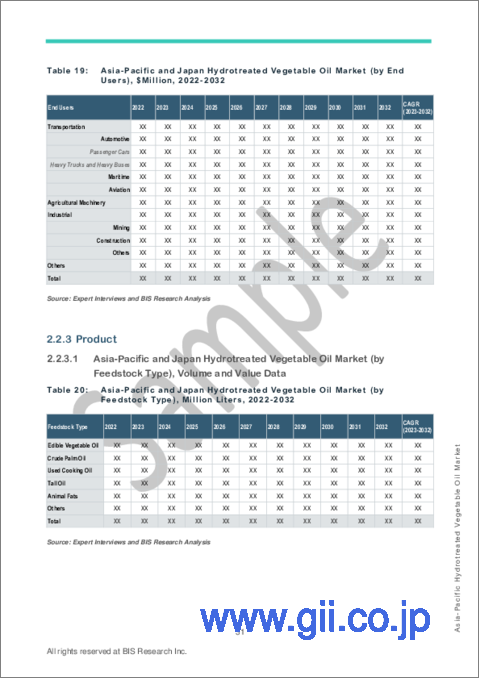
- Table 19: Asia-Pacific and Japan Hydrotreated Vegetable Oil Market (by End Users), Million Liters, 2022-2032
- Table 20: Asia-Pacific and Japan Hydrotreated Vegetable Oil Market (by End Users), $Million, 2022-2032
- Table 21: Asia-Pacific and Japan Hydrotreated Vegetable Oil Market (by Feedstock Type), Million Liters, 2022-2032
- Table 22: Asia-Pacific and Japan Hydrotreated Vegetable Oil Market (by Feedstock Type), $Million, 2022-2032
- Table 23: Asia-Pacific and Japan Hydrotreated Vegetable Oil Market (by Technology Type), Million Liters, 2022-2032
- Table 24: Asia-Pacific and Japan Hydrotreated Vegetable Oil Market (by Technology Type), $Million, 2022-2032
- Table 25: Japan Hydrotreated Vegetable Oil Market (by Application), Million Liters, 2022-2032
- Table 26: Japan Hydrotreated Vegetable Oil Market (by Application), $Million, 2022-2032
- Table 27: Japan Hydrotreated Vegetable Oil Market (by End Users), Million Liters, 2022-2032
- Table 28: Japan Hydrotreated Vegetable Oil Market (by End Users), $Million, 2022-2032
- Table 29: Japan Hydrotreated Vegetable Oil Market (by Feedstock Type), Million Liters, 2022-2032
- Table 30: Japan Hydrotreated Vegetable Oil Market (by Feedstock Type), $Million, 2022-2032
- Table 31: Japan Hydrotreated Vegetable Oil Market (by Technology Type), Million Liters, 2022-2032
- Table 32: Japan Hydrotreated Vegetable Oil Market (by Technology Type), $Million, 2022-2032
- Table 33: Indonesia Hydrotreated Vegetable Oil Market (by Application), Million Liters, 2022-2032
- Table 34: Indonesia Hydrotreated Vegetable Oil Market (by Application), $Million, 2022-2032
- Table 35: Indonesia Hydrotreated Vegetable Oil Market (by End Users), Million Liters, 2022-2032
- Table 36: Indonesia Hydrotreated Vegetable Oil Market (by End Users), $Million, 2022-2032
- Table 37: Indonesia Hydrotreated Vegetable Oil Market (by Feedstock Type), Million Liters, 2022-2032
- Table 38: Indonesia Hydrotreated Vegetable Oil Market (by Feedstock Type), $Million, 2022-2032
- Table 39: Indonesia Hydrotreated Vegetable Oil Market (by Technology Type), Million Liters, 2022-2032
- Table 40: Indonesia Hydrotreated Vegetable Oil Market (by Technology Type), $Million, 2022-2032
- Table 41: Malaysia Hydrotreated Vegetable Oil Market (by Application), Million Liters, 2022-2032
- Table 42: Malaysia Hydrotreated Vegetable Oil Market (by Application), $Million, 2022-2032
- Table 43: Malaysia Hydrotreated Vegetable Oil Market (by End Users), Million Liters, 2022-2032
- Table 44: Malaysia Hydrotreated Vegetable Oil Market (by End Users), $Million, 2022-2032
- Table 45: Malaysia Hydrotreated Vegetable Oil Market (by Feedstock Type), Million Liters, 2022-2032
- Table 46: Malaysia Hydrotreated Vegetable Oil Market (by Feedstock Type), $Million, 2022-2032
- Table 47: Malaysia Hydrotreated Vegetable Oil Market (by Technology Type), Million Liters, 2022-2032
- Table 48: Malaysia Hydrotreated Vegetable Oil Market (by Technology Type), $Million, 2022-2032
- Table 49: Singapore Hydrotreated Vegetable Oil Market (by Application), Million Liters, 2022-2032
- Table 50: Singapore Hydrotreated Vegetable Oil Market (by Application), $Million, 2022-2032
- Table 51: Singapore Hydrotreated Vegetable Oil Market (by End Users), Million Liters, 2022-2032
- Table 52: Singapore Hydrotreated Vegetable Oil Market (by End Users), $Million, 2022-2032
- Table 53: Singapore Hydrotreated Vegetable Oil Market (by Feedstock Type), Million Liters, 2022-2032
- Table 54: Singapore Hydrotreated Vegetable Oil Market (by Feedstock Type), $Million, 2022-2032
- Table 55: Singapore Hydrotreated Vegetable Oil Market (by Technology Type), Million Liters, 2022-2032
- Table 56: Singapore Hydrotreated Vegetable Oil Market (by Technology Type), $Million, 2022-2032
- Table 57: Rest-of-Asia-Pacific and Japan Hydrotreated Vegetable Oil Market (by Application), Million Liters, 2022-2032
- Table 58: Rest-of-Asia-Pacific and Japan Hydrotreated Vegetable Oil Market (by Application), $Million, 2022-2032
- Table 59: Rest-of-Asia-Pacific and Japan Hydrotreated Vegetable Oil Market (by End Users), Million Liters, 2022-2032
- Table 60: Rest-of-Asia-Pacific and Japan Hydrotreated Vegetable Oil Market (by End Users), $Million, 2022-2032
- Table 61: Rest-of-Asia-Pacific and Japan Hydrotreated Vegetable Oil Market (by Feedstock Type), Million Liters, 2022-2032
- Table 62: Rest-of-Asia-Pacific and Japan Hydrotreated Vegetable Oil Market (by Feedstock Type), $Million, 2022-2032
- Table 63: Rest-of-Asia-Pacific and Japan Hydrotreated Vegetable Oil Market (by Technology Type), Million Liters, 2022-2032
- Table 64: Rest-of-Asia-Pacific and Japan Hydrotreated Vegetable Oil Market (by Technology Type), $Million, 2022-2032
- Table 65: Market Share Analysis: Hydrotreated Vegetable Oil Market, 2022
Introduction to Asia-Pacific (APAC) Hydrotreated Vegetable Oil Market
The Asia-Pacific hydrotreated vegetable oil market (excluding China) is estimated to reach $8.73 billion by 2032 from $1.37 billion in 2022, at a growth rate of 19.73% during the forecast period 2023-2032. The growing demand from end-user industries like automotive, aviation, maritime, agriculture, and industrial, among others, is expected to drive up demand for hydrotreated vegetable oil-based fuels like renewable diesel and sustainable aviation fuel. Moreover, it is expected that the APAC hydrotreated vegetable oil market will continue to grow throughout the projected period of 2023-2032, as the automotive and aviation industries in several advanced economies, to adopt more sustainable aviation fuel and renewable diesel. But the limited supply of feed stocks is making businesses more competitive in the market for a steady supply of raw materials based on fatty acids, which is impeding the development of of the hydrotreated vegetable oil market.
Market Introduction
| KEY MARKET STATISTICS | |
|---|---|
| Forecast Period | 2023 - 2032 |
| 2023 Evaluation | $1.72 Billion |
| 2032 Forecast | $8.73 Billion |
| CAGR | 19.73% |
The APAC market would greatly benefit from the renewable diesel produced from hydrotreated vegetable oil, which has a number of advantages. The fact that it is renewable contributes to the reduction of carbon emissions, which is beneficial in the fight against climate change and the atmospheric concentration of greenhouse gases. It is also a good option for usage in areas with high temperatures because of its superior performance in cold weather. Because of this, it is the best choice for the APAC market's automotive, aviation, maritime, industrial, and other industries. Furthermore, conventional jet fuel may be easily replaced with sustainable aviation fuel (SAF) without requiring significant changes to aircraft engines or refueling infrastructure. Airlines may use SAF without having to make major modifications to their fleets or infrastructure thanks to this simple interface. As the use of hydrotreated vegetable oil continues to grow in various industries across the APAC market, its impact is expected to rise significantly in the near future.
Market Segmentation:
Segmentation 1: by Application
- Renewable Diesel
- Sustainable Aviation Fuel (SAF)
Segmentation 2: by End User
- Transportation
- Agricultural Machinery
- Industrial
- Others (Residential Buildings, Commercial Buildings, and Data Centers)
Segmentation 3: by Feedstock Type
- Edible Vegetable Oils
- Crude Palm Oil
- Used Cooking Oil
- Tall Oil
- Animal Fats
- Others (Non-Edible Vegetable Oil, Sludge Palm Oil Mill Effluent, and Refining Byproducts)
Segmentation 4: by Technology Type
- Standalone Hydrotreating Technology
- Co-Processing Technology
Segmentation 5: by Country
- Japan
- Indonesia
- Malaysia
- Singapore
- Rest-of-Asia-Pacific and Japan
How can this report add value to an organization?
Product/Innovation Strategy: The product segment helps the reader understand the different hydrotreated vegetable oil-based fuels, i.e., renewable diesel and sustainable aviation fuel, various end users, technology type, and feedstock types involved in the production of hydrotreated vegetable oils. Moreover, the study provides the reader with a detailed understanding of the APAC hydrotreated vegetable oil market based on the end user (transportation, agricultural machinery, industrial, and others).
Growth/Marketing Strategy: The APAC hydrotreated vegetable oil market has seen major development by key players operating in the market, such as business expansions, partnerships, collaborations, mergers and acquisitions, and joint ventures. The favored strategy for the companies has been product developments, business expansions, and acquisitions to strengthen their position in the APAC hydrotreated vegetable oil market.
Competitive Strategy: Key players in the APAC hydrotreated vegetable oil market analyzed and profiled in the study involve HVO-based fuel manufacturers and the overall ecosystem. Moreover, a detailed competitive benchmarking of the players operating in the APAC hydrotreated vegetable oil market has been done to help the reader understand how players stack against each other, presenting a clear market landscape. Additionally, comprehensive competitive strategies such as partnerships, agreements, acquisitions, and collaborations will aid the reader in understanding the untapped revenue pockets in the market.
Table of Contents
Executive Summary
Scope of the Study
1. Markets
- 1.1. Industry Outlook
- 1.1.1. Trends: Current and Future
- 1.1.1.1. Hydrotreated Vegetable Oil as Second-Generation Biofuel
- 1.1.1.2. Hydrotreated Vegetable Oil as a Sustainable Replacement for Fossil Fuels
- 1.1.2. Supply Chain Analysis
- 1.1.2.1. Key Startups in the Ecosystem
- 1.1.3. Ecosystem/Ongoing Programs
- 1.1.3.1. Consortiums and Associations
- 1.1.3.2. Regulatory Bodies
- 1.1.4. Key Patent Analysis
- 1.1.4.1. Key Patent Analysis (by Status)
- 1.1.4.2. Key Patent Analysis (by Organization)
- 1.1.1. Trends: Current and Future
- 1.2. Business Dynamics
- 1.2.1. Business Drivers
- 1.2.1.1. Government Regulations toward Low Carbon Emissions
- 1.2.1.2. Applicability in Existing Energy Infrastructure
- 1.2.1.3. Increasing Investment in Hydrotreated Vegetable Oil Production
- 1.2.2. Business Restraints
- 1.2.2.1. Lower Density and Energy Content than Fossil Fuels
- 1.2.2.2. Continuous Supply of Renewable Feedstock
- 1.2.3. Business Strategies
- 1.2.3.1. Market Developments
- 1.2.4. Corporate Strategies
- 1.2.4.1. Mergers, Acquisitions, Partnerships, and Joint Ventures
- 1.2.5. Business Opportunities
- 1.2.5.1. Growing Applications of Hydrotreated Vegetable Oil
- 1.2.5.2. Advancements in Hydrotreated Vegetable Oil Technologies
- 1.2.1. Business Drivers
- 1.3. Comparison between Hydrotreated Vegetable Oil and other Sustainable Fuels
- 1.4. Future Raw Materials for Hydrotreated Vegetable Oil
- 1.5. Production Capacity Analysis
- 1.6. Supply and Demand Analysis for Hydrotreated Vegetable Oil
2. Regions
- 2.1. China
- 2.1.1. Market
- 2.1.1.1. Buyer Attributes
- 2.1.1.2. Key Manufacturers/Suppliers in China
- 2.1.1.3. Business Challenges
- 2.1.1.4. Business Drivers
- 2.1.2. Application
- 2.1.2.1. China Hydrotreated Vegetable Oil Market (by Application), Volume and Value Data
- 2.1.2.2. China Hydrotreated Vegetable Oil Market (by End Users), Volume and Value Data
- 2.1.3. Product
- 2.1.3.1. China Hydrotreated Vegetable Oil Market (by Feedstock Type), Volume and Value Data
- 2.1.3.2. China Hydrotreated Vegetable Oil Market (by Technology Type), Volume and Value Data
- 2.1.1. Market
- 2.2. Asia-Pacific and Japan
- 2.2.1. Market
- 2.2.1.1. Key Manufacturers/Suppliers in Asia-Pacific and Japan
- 2.2.1.2. Business Challenges
- 2.2.1.3. Business Drivers
- 2.2.2. Application
- 2.2.2.1. Asia-Pacific and Japan Hydrotreated Vegetable Oil Market (by Application), Volume and Value Data
- 2.2.2.2. Asia-Pacific and Japan Hydrotreated Vegetable Oil Market (by End Users), Volume and Value Data
- 2.2.3. Product
- 2.2.3.1. Asia-Pacific and Japan Hydrotreated Vegetable Oil Market (by Feedstock Type), Volume and Value Data
- 2.2.3.2. Asia-Pacific and Japan Hydrotreated Vegetable Oil Market (by Technology Type), Volume and Value Data
- 2.2.4. Asia-Pacific and Japan: Country-Level Analysis
- 2.2.4.1. Japan
- 2.2.4.1.1. Market
- 2.2.4.1.1.1. Buyer Attributes
- 2.2.4.1.1.2. Key Manufacturers/Suppliers in Japan
- 2.2.4.1.1.3. Business Challenges
- 2.2.4.1.1.4. Business Drivers
- 2.2.4.1.2. Application
- 2.2.4.1.2.1. Japan Hydrotreated Vegetable Oil Market (by Application), Volume and Value Data
- 2.2.4.1.2.2. Japan Hydrotreated Vegetable Oil Market (by End Users), Volume and Value Data
- 2.2.4.1.3. Product
- 2.2.4.1.3.1. Japan Hydrotreated Vegetable Oil Market (by Feedstock Type), Volume and Value Data
- 2.2.4.1.3.2. Japan Hydrotreated Vegetable Oil Market (by Technology Type), Volume and Value Data
- 2.2.4.1.1. Market
- 2.2.4.2. Indonesia
- 2.2.4.2.1. Market
- 2.2.4.2.1.1. Buyer Attributes
- 2.2.4.2.1.2. Key Manufacturers/Suppliers in Indonesia
- 2.2.4.2.1.3. Business Challenges
- 2.2.4.2.1.4. Business Drivers
- 2.2.4.2.2. Application
- 2.2.4.2.2.1. Indonesia Hydrotreated Vegetable Oil Market (by Application), Volume and Value Data
- 2.2.4.2.2.2. Indonesia Hydrotreated Vegetable Oil Market (by End Users), Volume and Value Data
- 2.2.4.2.3. Product
- 2.2.4.2.3.1. Indonesia Hydrotreated Vegetable Oil Market (by Feedstock Type), Volume and Value Data
- 2.2.4.2.3.2. Indonesia Hydrotreated Vegetable Oil Market (by Technology Type), Volume and Value Data
- 2.2.4.2.1. Market
- 2.2.4.3. Malaysia
- 2.2.4.3.1. Market
- 2.2.4.3.1.1. Buyer Attributes
- 2.2.4.3.1.2. Key Manufacturers/Suppliers in Malaysia
- 2.2.4.3.1.3. Business Challenges
- 2.2.4.3.1.4. Business Drivers
- 2.2.4.3.2. Application
- 2.2.4.3.2.1. Malaysia Hydrotreated Vegetable Oil Market (by Application), Volume and Value Data
- 2.2.4.3.2.2. Malaysia Hydrotreated Vegetable Oil Market (by End Users), Volume and Value Data
- 2.2.4.3.3. Product
- 2.2.4.3.3.1. Malaysia Hydrotreated Vegetable Oil Market (by Feedstock Type), Volume and Value Data
- 2.2.4.3.3.2. Malaysia Hydrotreated Vegetable Oil Market (by Technology Type), Volume and Value Data
- 2.2.4.3.1. Market
- 2.2.4.4. Singapore
- 2.2.4.4.1. Market
- 2.2.4.4.1.1. Buyer Attributes
- 2.2.4.4.1.2. Key Manufacturers/Suppliers in Singapore
- 2.2.4.4.1.3. Business Challenges
- 2.2.4.4.1.4. Business Drivers
- 2.2.4.4.2. Application
- 2.2.4.4.2.1. Singapore Hydrotreated Vegetable Oil Market (by Application), Volume and Value Data
- 2.2.4.4.2.2. Singapore Hydrotreated Vegetable Oil Market (by End Users), Volume and Value Data
- 2.2.4.4.3. Product
- 2.2.4.4.3.1. Singapore Hydrotreated Vegetable Oil Market (by Feedstock Type), Volume and Value Data
- 2.2.4.4.3.2. Singapore Hydrotreated Vegetable Oil Market (by Technology Type), Volume and Value Data
- 2.2.4.4.1. Market
- 2.2.4.5. Rest-of-Asia-Pacific and Japan
- 2.2.4.5.1. Market
- 2.2.4.5.1.1. Buyer Attributes
- 2.2.4.5.1.2. Key Manufacturers/Suppliers in the Rest-of-Asia-Pacific and Japan
- 2.2.4.5.1.3. Business Drivers
- 2.2.4.5.1.4. Business Challenges
- 2.2.4.5.2. Application
- 2.2.4.5.2.1. Rest-of-Asia-Pacific and Japan Hydrotreated Vegetable Oil Market (by Application), Volume and Value Data
- 2.2.4.5.2.2. Rest-of-Asia-Pacific and Japan Hydrotreated Vegetable Oil Market (by End Users), Volume and Value Data
- 2.2.4.5.3. Product
- 2.2.4.5.3.1. Rest-of-Asia-Pacific and Japan Hydrotreated Vegetable Oil Market (by Feedstock Type), Volume and Value Data
- 2.2.4.5.3.2. Rest-of-Asia-Pacific and Japan Hydrotreated Vegetable Oil Market (by Technology Type), Volume and Value Data
- 2.2.4.5.1. Market
- 2.2.4.1. Japan
- 2.2.1. Market
3. Markets - Competitive Benchmarking & Company Profiles
- 3.1. Competitive Benchmarking
- 3.2. Market Share Analysis
- 3.3. Company Profiles
- 3.3.1. PT Pertamina
- 3.3.1.1. Company Overview
- 3.3.1.1.1. Role of PT Pertamina in the Hydrotreated Vegetable Oil Market
- 3.3.1.1.2. Product Portfolio
- 3.3.1.2. Business Strategies
- 3.3.1.2.1. Market Developments
- 3.3.1.3. Analyst View
- 3.3.1.1. Company Overview
- 3.3.1. PT Pertamina
4. Research Methodology
- 4.1. Data Sources
- 4.1.1. Primary Data Sources
- 4.1.2. Secondary Data Sources
- 4.2. Data Triangulation
- 4.3. Market Estimation and Forecast
- 4.3.1. Factors for Data Prediction and Modelling
