|
|
市場調査レポート
商品コード
1389585
アジア太平洋のTOPCon太陽電池市場 - 分析と予測(2023年~2032年)Asia-Pacific TOPCon Solar Cells Market - Analysis and Forecast, 2023-2032 |
||||||
|
|
|||||||
カスタマイズ可能
|
|||||||


| アジア太平洋のTOPCon太陽電池市場 - 分析と予測(2023年~2032年) |
|
出版日: 2023年12月01日
発行: BIS Research
ページ情報: 英文 125 Pages
納期: 1~5営業日
|

- 全表示
- 概要
- 図表
- 目次
アジア太平洋のTOPCon太陽電池の市場規模(中国を除く)は、2022年に16億米ドルと評価され、2023年~2032年の予測期間中に20.3%のCAGRで拡大し、2032年までに89億5,000万米ドルに達すると予測されています。
TOPCon太陽電池産業はアジア太平洋で大きく成長すると予測されています。TOPCon技術によって可能になった、柔軟な製造プロセスと優れた効率を持つ太陽電池へのニーズの高まりが、この拡大を後押しします。
| 主要市場統計 | |
|---|---|
| 予測期間 | 2023年~2032年 |
| 2023年評価 | 17億米ドル |
| 2032年予測 | 89億5,000万米ドル |
| CAGR | 20.3% |
アジア太平洋市場におけるTOPCon太陽電池産業の力強い成長には、いくつかの要因が寄与しています。第一に、TOPConセルを提供する企業が増えており、潜在的な市場があることを示唆しています。さらに、TOPCon太陽電池は、太陽光発電技術の向上、特に住宅や商業分野でのユーティリティプロジェクトの増加により、世界中でますます普及しています。さらに、この地域は再生可能エネルギー分野での支出が多く、太陽電池産業の一般的な成長を支えています。再生可能エネルギーに関連する低カーボンフットプリントと競争力のある製造コストにより、世界的に多額の投資が行われています。TOPCon太陽電池の需要は、従来の太陽電池技術と比較した場合、その高い有効性によってさらに促進されています。公益事業、住宅、商業部門からの高い需要が予想されることから、アジア太平洋市場では既存および新興のTOPCon太陽電池プロバイダー間の競争が激化すると予想されます。
当レポートでは、アジア太平洋のTOPCon太陽電池市場について調査し、市場の概要とともに、エンドユーザー別、タイプ別、設置別、地域別の動向、および市場に参入する企業のプロファイルなどを提供しています。
目次
第1章 市場
- 業界の展望
- ビジネスダイナミクス
- スタートアップの情勢
第2章 地域
- 中国
- アジア太平洋と日本
第3章 市場-競合ベンチマーキングと企業プロファイル
- 競合ベンチマーキング
- 競争力マトリックス
- 主要企業の製品マトリックス(タイプ別)
- 主要企業の市場シェア分析、2021年
- 企業プロファイル
- Wuxi Suntech Power Co., Ltd.
- Trina Solar Co., Ltd.
- JA SOLAR Technology Co., Ltd.
- LONGi
- Websol Energy System Limited
- Sharp Energy Solutions Corporation
- Jolywood
第4章 調査手法
List of Figures
- Figure 1: TOPCon Solar Cells Market, $Billion, 2022, 2023, and 2032
- Figure 2: TOPCon Solar Cells Market (by End User), $Billion, 2022 and 2032
- Figure 3: TOPCon Solar Cells Market (by Type), $Billion, 2022 and 2032
- Figure 4: TOPCon Solar Cells Market (by Installation), $Billion, 2022 and 2032
- Figure 5: TOPCon Solar Cells Market (by region), $Billion, 2022 and 2032
- Figure 6: Estimated Efficiency Level of TOPCon Solar Cells, 2022-2024
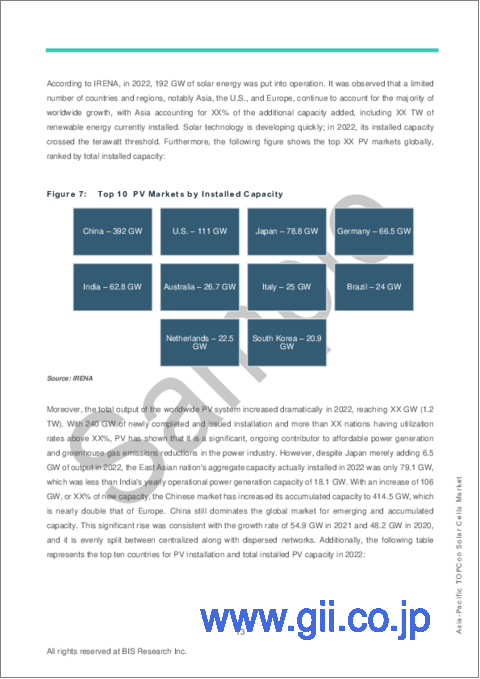
- Figure 7: Top 10 PV Markets by Installed Capacity
- Figure 8: Top Ten Countries for PV Installation and Total Installed PV Capacity in 2022
- Figure 9: Supply Chain Analysis of the TOPCon Solar Cells Market
- Figure 10: Clean Energy Investment in the Net Zero Pathway, $Trillion, 2016-2050
- Figure 11: Renewable Power Generation Based on Technology (Solar) in the Net-Zero Scenario, 2016-2030
- Figure 12: Wuxi Suntech Power Co., Ltd.: R&D Expenditure, $Million, 2019-2021
- Figure 13: Trina Solar Co., Ltd.: R&D Expenditure, $Million, 2019-2021
- Figure 14: LONGi: R&D Expenditure, $Million, 2019-2021
- Figure 15: Research Methodology
- Figure 16: Top-Down and Bottom-Up Approach
- Figure 17: TOPCon Solar Cells Market: Influencing Factors
- Figure 18: Assumptions and Limitations
List of Tables
- Table 1: Comparative Analysis of Different Types of Solar Cells
- Table 2: List of Regulatory/Certification Bodies
- Table 3: List of Government Programs for TOPCon Solar Cells Market
- Table 4: List of Programs by Research Institutions and Universities
- Table 5: Key Product Developments
- Table 6: Key Market Developments
- Table 7: Key Mergers and Acquisitions, Partnerships, Collaborations, and Joint Ventures
- Table 8: TOPCon Solar Cells Market (by region), GW, 2022-2032
- Table 9: TOPCon Solar Cells Market (by region), $Billion, 2022-2032
- Table 10: China TOPCon Solar Cells Market (by End User), GW, 2022-2032
- Table 11: China TOPCon Solar Cells Market (by End User), $Billion, 2022-2032
- Table 12: China TOPCon Solar Cells Market (by Type), GW, 2022-2032
- Table 13: China TOPCon Solar Cells Market (by Type), $Billion, 2022-2032
- Table 14: China TOPCon Solar Cells Market (by Installation), GW, 2022-2032
- Table 15: China TOPCon Solar Cells Market (by Installation), $Billion, 2022-2032
- Table 16: Asia-Pacific and Japan TOPCon Solar Cells Market (by End User), GW, 2022-2032
- Table 17: Asia-Pacific and Japan TOPCon Solar Cells Market (by End User), $Billion, 2022-2032
- Table 18: Asia-Pacific and Japan TOPCon Solar Cells Market (by Type), GW, 2022-2032
- Table 19: Asia-Pacific and Japan TOPCon Solar Cells Market (by Type), $Billion, 2022-2032
- Table 20: Asia-Pacific and Japan TOPCon Solar Cells Market (by Installation), GW, 2022-2032
- Table 21: Asia-Pacific and Japan TOPCon Solar Cells Market (by Installation), $Billion, 2022-2032
- Table 22: Japan TOPCon Solar Cells Market (by End User), GW, 2022-2032
- Table 23: Japan TOPCon Solar Cells Market (by End User), $Billion, 2022-2032
- Table 24: Japan TOPCon Solar Cells Market (by Type), GW, 2022-2032
- Table 25: Japan TOPCon Solar Cells Market (by Type), $Billion, 2022-2032
- Table 26: Japan TOPCon Solar Cells Market (by Installation), GW, 2022-2032
- Table 27: Japan TOPCon Solar Cells Market (by Installation), $Billion, 2022-2032
- Table 28: South Korea TOPCon Solar Cells Market (by End User), GW, 2022-2032
- Table 29: South Korea TOPCon Solar Cells Market (by End User), $Billion, 2022-2032
- Table 30: South Korea TOPCon Solar Cells Market (by Type), GW, 2022-2032
- Table 31: South Korea TOPCon Solar Cells Market (by Type), $Billion, 2022-2032
- Table 32: South Korea TOPCon Solar Cells Market (by Installation), GW, 2022-2032
- Table 33: South Korea TOPCon Solar Cells Market (by Installation), $Billion, 2022-2032
- Table 34: India TOPCon Solar Cells Market (by End User), GW, 2022-2032
- Table 35: India TOPCon Solar Cells Market (by End User), $Billion, 2022-2032
- Table 36: India TOPCon Solar Cells Market (by Type), GW, 2022-2032
- Table 37: India TOPCon Solar Cells Market (by Type), $Billion, 2022-2032
- Table 38: India TOPCon Solar Cells Market (by Installation), GW, 2022-2032By
- Table 39: India TOPCon Solar Cells Market (by Installation), $Billion, 2022-2032
- Table 40: Vietnam TOPCon Solar Cells Market (by End User), GW, 2022-2032
- Table 41: Vietnam TOPCon Solar Cells Market (by End User), $Billion, 2022-2032
- Table 42: Vietnam TOPCon Solar Cells Market (by Type), GW, 2022-2032
- Table 43: Vietnam TOPCon Solar Cells Market (by Type), $Billion, 2022-2032
- Table 44: Vietnam TOPCon Solar Cells Market (by Installation), GW, 2022-2032
- Table 45: Vietnam TOPCon Solar Cells Market (by Installation), $Billion, 2022-2032
- Table 46: Rest-of-Asia-Pacific and Japan TOPCon Solar Cells Market (by End User), GW, 2022-2032
- Table 47: Rest-of-Asia-Pacific and Japan TOPCon Solar Cells Market (by End User), $Billion, 2022-2032
- Table 48: Rest-of-Asia-Pacific and Japan TOPCon Solar Cells Market (by Type), GW, 2022-2032
- Table 49: Rest-of-Asia-Pacific and Japan TOPCon Solar Cells Market (by Type), $Billion, 2022-2032
- Table 50: Rest-of-Asia-Pacific and Japan TOPCon Solar Cells Market (by Installation), GW, 2022-2032
- Table 51: Rest-of-Asia-Pacific and Japan TOPCon Solar Cells Market (by Installation), $Billion, 2022-2032
- Table 52: Product Matrix for Key Companies (by Type)
- Table 53: Market Shares of Key Companies, 2021
“The Asia-Pacific TOPCon Solar Cells Market (excluding China) Expected to Reach $8.95 Billion by 2032.”
Introduction to Asia-Pacific TOPCon Solar Cells Market
The Asia-Pacific TOPCon solar cells market (excluding China) was valued at $1.60 billion in 2022 and is anticipated to reach $8.95 billion by 2032, witnessing a CAGR of 20.3% during the forecast period 2023-2032. The TOPCon solar cells industry is anticipated to grow significantly in the APAC region. The rising need for solar cells with flexible manufacturing processes and great efficiency-made possible by TOPCon technology-will drive this expansion.
Market Introduction
| KEY MARKET STATISTICS | |
|---|---|
| Forecast Period | 2023 - 2032 |
| 2023 Evaluation | $1.70 Billion |
| 2032 Forecast | $8.95 Billion |
| CAGR | 20.3% |
A number of factors are contributing to the TOPCon solar cells industry's strong growth in the APAC market. First, a growing number of businesses are providing TOPCon cells, suggesting a potential market. Furthermore, TOPCon solar cells are becoming more and more popular throughout the world due to improvements in photovoltaic technologies, particularly with the rise in utility projects in the residential and commercial sectors. Additionally, the region exhibits higher spending in the sector of renewable energy, which supports the general growth of the solar industry. Significant investments have been made globally due to the low carbon footprint and competitive manufacturing costs connected with renewable energy. The demand for TOPCon solar cells is further fueled by its higher effectiveness when compared to conventional solar cell technologies. Given the anticipated high demand from the utility, residential, and commercial sectors, the competition among established and emerging TOPCon solar cell providers is expected to intensify in the APAC market.
Market Segmentation:
Segmentation 1: by End User
- Residential
- Commercial
- Utility
- Agriculture
- Others
Segmentation 2: by Type
- N-Type
- P-Type
Segmentation 3: by Installation
- Ground-Mounted
- Rooftop
Segmentation 4: by Region
- China
- Asia-Pacific and Japan: Japan, South Korea, India, Vietnam, and Rest-of-Asia-Pacific and Japan
How can this report add value to an organization?
Product/Innovation Strategy: The product segment helps the reader to understand the different types involved in TOPCon solar cells. Moreover, the study provides the reader with a detailed understanding of the Asia-Pacific TOPCon solar cells market based on the end user (residential, commercial, utility, agriculture, and others). TOPCon solar cells are gaining traction in end-user industries on the back of sustainability concerns and their higher efficiency properties. They are also being used for controlling GHG emissions. Moreover, partnerships and collaborations are expected to play a crucial role in strengthening market position over the coming years, with the companies focusing on bolstering their technological capabilities and gaining a dominant market share in the TOPCon solar cells industry.
Growth/Marketing Strategy: The Asia-Pacific TOPCon solar cells market has been growing at a rapid pace. The market offers enormous opportunities for existing and emerging market players. Some of the strategies covered in this segment are mergers and acquisitions, product launches, partnerships and collaborations, business expansions, and investments. The strategies preferred by companies to maintain and strengthen their market position primarily include partnerships, agreements, and collaborations.
Competitive Strategy: The key players in the Asia-Pacific TOPCon solar cells market analyzed and profiled in the study include TOPCon solar cells providers that develop, maintain, and market TOPCon solar cells. Moreover, a detailed competitive benchmarking of the players operating in the Asia-Pacific TOPCon solar cells market has been done to help the reader understand the ways in which players stack against each other, presenting a clear market landscape. Additionally, comprehensive competitive strategies such as partnerships, agreements, and collaborations will aid the reader in understanding the untapped revenue pockets in the market.
Key Market Players and Competition Synopsis
The companies that are profiled have been selected based on inputs gathered from primary experts and analysing company coverage, product portfolio, and market penetration.
Some of the prominent names established in this market are:
|
|
Table of Contents
1 Markets
- 1.1 Industry Outlook
- 1.1.1 Trends: Current and Future
- 1.1.1.1 Emergence of TOPCon Solar Cells as New PV Module Technology in the Solar Industry
- 1.1.1.2 Rising Photovoltaics Demand in Emerging Markets
- 1.1.2 Supply Chain Analysis
- 1.1.3 Ecosystem of TOPCon Solar Cells Market
- 1.1.3.1 Consortiums and Associations
- 1.1.3.2 Regulatory/Certification Bodies
- 1.1.3.3 Government Programs
- 1.1.3.4 Programs by Research Institutions and Universities
- 1.1.4 Impact of COVID-19 on the TOPCon Solar Cells Market
- 1.1.5 Comparative Analysis between TOPCon, Heterojunction, and Perovskite Solar Cells
- 1.1.6 Comparative Analysis between TOPCon and PERC Cells
- 1.1.7 Potential Efficiency of Solar Cells and Panels
- 1.1.8 Significant Advancements in TOPCon Solar Cells
- 1.1.9 Recent Investments Made in TOPCon Solar Cells Market
- 1.1.10 Emerging Start-Up Companies of TOPCon Solar Cells Market
- 1.1.1 Trends: Current and Future
- 1.2 Business Dynamics
- 1.2.1 Business Drivers
- 1.2.1.1 Increasing Investment in Renewable Energy Sources for Power Generation
- 1.2.1.2 Flexible Manufacturing Process with TOPCon Technology
- 1.2.1.3 Growing Demand for TOPCON Solar Cells Due to Increased Upper Level of Efficiency
- 1.2.2 Business Challenges
- 1.2.2.1 Increased Need for Silver to Print the Contacts on the Cell
- 1.2.2.2 Constrained Market Acceptance and High Competition
- 1.2.3 Business Strategies
- 1.2.3.1 Product Developments
- 1.2.3.2 Market Developments
- 1.2.4 Corporate Strategies
- 1.2.4.1 Mergers and Acquisitions, Partnerships, Collaborations, and Joint Ventures
- 1.2.5 Business Opportunities
- 1.2.5.1 Growing Research and Development Activities for TOPCon Solar Cells
- 1.2.5.2 Growing Concern for the Environment and Carbon Neutrality Targets
- 1.2.1 Business Drivers
- 1.3 Start-Up Landscape
- 1.3.1 Key Start-Ups in the Ecosystem
2 Regions
- 2.1 China
- 2.1.1 Market
- 2.1.1.1 Buyer Attributes
- 2.1.1.2 Key Producers and Suppliers in China
- 2.1.1.3 Regulatory Landscape
- 2.1.1.4 Business Drivers
- 2.1.1.5 Business Challenges
- 2.1.2 Application
- 2.1.2.1 China TOPCon Solar Cells Market (by End User), Volume and Value Data
- 2.1.3 Product
- 2.1.3.1 China TOPCon Solar Cells Market (by Type), Volume and Value Data
- 2.1.3.2 China TOPCon Solar Cells Market (by Installation), Volume and Value Data
- 2.1.1 Market
- 2.2 Asia-Pacific and Japan
- 2.2.1 Markets
- 2.2.1.1 Key Producers and Suppliers in Asia-Pacific and Japan
- 2.2.1.2 Business Drivers
- 2.2.1.3 Business Challenges
- 2.2.2 Application
- 2.2.2.1 Asia-Pacific and Japan TOPCon Solar Cells Market (by End User), Volume and Value Data
- 2.2.3 Product
- 2.2.3.1 Asia-Pacific and Japan TOPCon Solar Cells Market (by Type), Volume and Value Data
- 2.2.3.2 Asia-Pacific and Japan TOPCon Solar Cells Market (by Installation), Volume and Value Data
- 2.2.4 Asia-Pacific and Japan (by Country)
- 2.2.4.1 Japan
- 2.2.4.1.1 Markets
- 2.2.4.1.1.1 Buyer Attributes
- 2.2.4.1.1.2 Key Producers and Suppliers in Japan
- 2.2.4.1.1.3 Regulatory Landscape
- 2.2.4.1.1.4 Business Drivers
- 2.2.4.1.1.5 Business Challenges
- 2.2.4.1.2 Application
- 2.2.4.1.2.1 Japan TOPCon Solar Cells Market (by End User), Volume and Value Data
- 2.2.4.1.3 Product
- 2.2.4.1.3.1 Japan TOPCon Solar Cells Market (by Type), Volume and Value Data
- 2.2.4.1.3.2 Japan TOPCon Solar Cells Market (by Installation), Volume and Value Data
- 2.2.4.1.1 Markets
- 2.2.4.2 South Korea
- 2.2.4.2.1 Markets
- 2.2.4.2.1.1 Buyer Attributes
- 2.2.4.2.1.2 Key Producers and Suppliers in South Korea
- 2.2.4.2.1.3 Regulatory Landscape
- 2.2.4.2.1.4 Business Drivers
- 2.2.4.2.1.5 Business Challenges
- 2.2.4.2.2 Application
- 2.2.4.2.2.1 South Korea TOPCon Solar Cells Market (by End User), Volume and Value Data
- 2.2.4.2.3 Product
- 2.2.4.2.3.1 South Korea TOPCon Solar Cells Market (by Type), Volume and Value Data
- 2.2.4.2.3.2 South Korea TOPCon Solar Cells Market (by Installation), Volume and Value Data
- 2.2.4.2.1 Markets
- 2.2.4.3 India
- 2.2.4.3.1 Markets
- 2.2.4.3.1.1 Buyer Attributes
- 2.2.4.3.1.2 Key Producers and Suppliers in India
- 2.2.4.3.1.3 Regulatory Landscape
- 2.2.4.3.1.4 Business Drivers
- 2.2.4.3.1.5 Business Challenges
- 2.2.4.3.2 Application
- 2.2.4.3.2.1 India TOPCon Solar Cells Market (by End User), Volume and Value Data
- 2.2.4.3.3 Product
- 2.2.4.3.3.1 India TOPCon Solar Cells Market (by Type), Volume and Value Data
- 2.2.4.3.3.2 India TOPCon Solar Cells Market (by Installation), Volume and Value Data
- 2.2.4.3.1 Markets
- 2.2.4.4 Vietnam
- 2.2.4.4.1 Markets
- 2.2.4.4.1.1 Buyer Attributes
- 2.2.4.4.1.2 Key Producers and Suppliers in Vietnam
- 2.2.4.4.1.3 Regulatory Landscape
- 2.2.4.4.1.4 Business Drivers
- 2.2.4.4.1.5 Business Challenges
- 2.2.4.4.2 Application
- 2.2.4.4.2.1 Vietnam TOPCon Solar Cells Market (by End User), Volume and Value Data
- 2.2.4.4.3 Product
- 2.2.4.4.3.1 Vietnam TOPCon Solar Cells Market (by Type), Volume and Value Data
- 2.2.4.4.3.2 Vietnam TOPCon Solar Cells Market (by Installation), Volume and Value Data
- 2.2.4.4.1 Markets
- 2.2.4.5 Rest-of-Asia-Pacific and Japan
- 2.2.4.5.1 Markets
- 2.2.4.5.1.1 Buyer Attributes
- 2.2.4.5.1.2 Key Producers and Suppliers in the Rest-of-Asia-Pacific and Japan
- 2.2.4.5.1.3 Business Drivers
- 2.2.4.5.1.4 Business Challenges
- 2.2.4.5.2 Application
- 2.2.4.5.2.1 Rest-of-Asia-Pacific and Japan TOPCon Solar Cells Market (by End User), Volume and Value Data
- 2.2.4.5.3 Product
- 2.2.4.5.3.1 Rest-of-Asia-Pacific and Japan TOPCon Solar Cells Market (by Type), Volume and Value Data
- 2.2.4.5.3.2 Rest-of-Asia-Pacific and Japan TOPCon Solar Cells Market (by Installation), Volume and Value Data
- 2.2.4.5.1 Markets
- 2.2.4.1 Japan
- 2.2.1 Markets
3 Markets - Competitive Benchmarking & Company Profiles
- 3.1 Competitive Benchmarking
- 3.1.1 Competitive Position Matrix
- 3.1.2 Product Matrix for Key Companies (by Type)
- 3.1.3 Market Share Analysis of Key Companies, 2021
- 3.2 Company Profiles
- 3.2.1 Wuxi Suntech Power Co., Ltd.
- 3.2.1.1 Company Overview
- 3.2.1.2 Role of Wuxi Suntech Power Co., Ltd. in the TOPCon Solar Cells Market
- 3.2.1.2.1 Product Portfolio
- 3.2.1.2.2 Production Sites
- 3.2.1.2.3 Business Strategies
- 3.2.1.2.3.1 Product Developments
- 3.2.1.2.3.2 Market Developments
- 3.2.1.2.4 Corporate Strategies
- 3.2.1.2.4.1 Mergers, Acquisitions, Partnerships, and Joint Ventures
- 3.2.1.2.5 R&D Analysis
- 3.2.1.3 Analyst View
- 3.2.2 Trina Solar Co., Ltd.
- 3.2.2.1 Company Overview
- 3.2.2.2 Role of Trina Solar Co., Ltd. in the TOPCon Solar Cells Market
- 3.2.2.2.1 Product Portfolio
- 3.2.2.2.2 Production Sites
- 3.2.2.2.3 Business Strategies
- 3.2.2.2.3.1 Product Developments
- 3.2.2.2.3.2 Market Developments
- 3.2.2.2.4 Corporate Strategies
- 3.2.2.2.4.1 Mergers, Acquisitions, Partnerships, and Joint Ventures
- 3.2.2.2.5 R&D Analysis
- 3.2.2.3 Analyst View
- 3.2.3 JA SOLAR Technology Co., Ltd.
- 3.2.3.1 Company Overview
- 3.2.3.2 Role of JA SOLAR Technology Co., Ltd. in the TOPCon Solar Cell Market
- 3.2.3.2.1 Product Portfolio
- 3.2.3.2.2 Production Sites
- 3.2.3.2.3 Business Strategies
- 3.2.3.2.3.1 Product Developments
- 3.2.3.3 Analyst View
- 3.2.4 LONGi
- 3.2.4.1 Company Overview
- 3.2.4.2 Role of LONGi in the TOPCon Solar Cells Market
- 3.2.4.2.1 Product Portfolio
- 3.2.4.2.2 Production Sites
- 3.2.4.2.3 R&D Analysis
- 3.2.4.3 Analyst View
- 3.2.5 Websol Energy System Limited
- 3.2.5.1 Company Overview
- 3.2.5.2 Role of Websol Energy System Limited in the TOPCon Solar Cell Market
- 3.2.5.2.1 Product Portfolio
- 3.2.5.2.2 Production Sites
- 3.2.5.2.3 Business Strategies
- 3.2.5.2.3.1 Market Developments
- 3.2.5.3 Analyst View
- 3.2.6 Sharp Energy Solutions Corporation
- 3.2.6.1 Company Overview
- 3.2.6.2 Role of Sharp Energy Solutions Corporation in the TOPCon Solar Cell Market
- 3.2.6.2.1 Product Portfolio
- 3.2.6.2.2 Production Sites
- 3.2.6.2.3 Business Strategies
- 3.2.6.2.3.1 Product Developments
- 3.2.6.3 Analyst View
- 3.2.7 Jolywood
- 3.2.7.1 Company Overview
- 3.2.7.2 Role of Jolywood in the TOPCon Solar Cell Market
- 3.2.7.2.1 Product Portfolio
- 3.2.7.2.2 Production Sites
- 3.2.7.2.3 Business Strategies
- 3.2.7.2.3.1 Market Developments
- 3.2.7.3 Analyst View
- 3.2.1 Wuxi Suntech Power Co., Ltd.
4 Research Methodology
- 4.1 Primary Data Sources
- 4.2 BIS Data Sources
- 4.3 Assumptions and Limitations