|
|
市場調査レポート
商品コード
1385521
バイオ複合材料市場- 世界および地域別分析:用途別、製品タイプ別、材料タイプ別、加工技術別、地域別 - 分析と予測(2023年~2032年)Bio-Composite Materials Market - A Global and Regional Analysis: Focus on Application, Product Type, Material Type, Processing Technique, and Region - Analysis and Forecast, 2023-2032 |
||||||
|
|
|||||||
カスタマイズ可能
|
|||||||

| バイオ複合材料市場- 世界および地域別分析:用途別、製品タイプ別、材料タイプ別、加工技術別、地域別 - 分析と予測(2023年~2032年) |
|
出版日: 2023年11月23日
発行: BIS Research
ページ情報: 英文 263 Pages
納期: 1~5営業日
|

- 全表示
- 概要
- 図表
- 目次
| 主要市場統計 | |
|---|---|
| 予測期間 | 2023年~2032年 |
| 2023年評価 | 135億9,000万米ドル |
| 2032年予測 | 559億3,000万米ドル |
| CAGR | 17.03% |
世界のバイオ複合材料の市場規模は、2022年に119億米ドルと評価され、CAGR 17.03%で拡大し、2032年には559億3,000万米ドルに達すると予測されています。
世界のバイオ複合材料市場の成長は、主に自動車、建設、包装、消費財などの様々な産業における環境に優しい生分解性材料の意識の高まりと採用に牽引され、複合的な要因によって牽引されると予想されます。
バイオ複合材料は、複合材料業界の中でも特殊な分野であり、革新的で環境的に持続可能な複合材料を作るために、農業副産物、木材、バイオベースポリマーなどの再生可能な資源に由来する天然繊維やマトリックスの利用を強調しています。これらのバイオ複合材料は、環境負荷の低減、炭素排出量の削減、生分解性の向上など、従来の合成複合材料と比較して複数の利点を提供します。さらに、政府や産業界が持続可能性を世界的に重視することで、バイオ複合材料市場は大幅な拡大の兆しを見せています。さらに、今後数年間で、バイオ複合材料は既存の配合や設計では限界に近づく可能性があり、特性が強化されたバイオ複合材料への需要が高まることが予想されます。これらの新しいバイオ複合材料は、優れた機械的特性、熱特性、および持続可能性に関連する特性を提供することを目的として、現在研究が進められています。
世界のバイオ複合材料市場は成長段階にあり、バイオ複合材料を提供する企業の数は急速に増加しています。天然繊維や木質繊維などのバイオ複合材料における最新の技術進歩や、建設プロジェクトの増加、自動車産業、再生可能エネルギー需要、エレクトロニクスや消費財部門などが、世界中でバイオ複合材料市場の採用を後押ししています。さらに、環境に優しく持続可能な材料に対する需要の高まりから、数多くの利害関係者がバイオ複合材料市場の将来を熱望しています。環境に優しい材料への世界の投資の急増は、主にその環境負荷の低さと費用対効果によってもたらされています。さらに、バイオ複合材料が持続可能性と性能の面で従来の代替材料を上回る可能性があることは、環境に優しい材料の進化における重要な利点となっています。さらに、予測期間(2023~2032年)には、主に輸送、エネルギー貯蔵、エレクトロニクスなどの分野からバイオ複合材料に対する大きな需要が見込まれるため、バイオ複合材料市場における既存および新興のバイオ複合材料サプライヤー間の市場競争は大幅に拡大すると予想されます。
当レポートでは、世界のバイオ複合材料市場について調査し、市場の概要とともに、用途別、製品タイプ別、材料タイプ別、加工技術別、地域別の動向、および市場に参入する企業のプロファイルなどを提供しています。
目次
第1章 市場
- 業界の見通し
- ビジネスダイナミクス
第2章 用途
- 世界のバイオ複合材料市場(用途別):仕様と需要分析、価値と量のデータ
第3章 製品
- 世界のバイオ複合材料市場(製品タイプ別):仕様と需要分析、価値と量のデータ
- 世界のバイオ複合材料市場(材料タイプ別):仕様と需要分析、価値と量のデータ
- 世界のバイオ複合材料市場(加工技術別):仕様と需要分析、価値と量のデータ
- 製品ベンチマーク:成長率- 市場シェアマトリックス(製品タイプ別)、2022年
- 特許分析
- 価格分析
第4章 地域
- 北米
- 欧州
- 英国
- 中国
- アジア太平洋と日本
- その他の地域
第5章 市場-競合ベンチマーキングと企業プロファイル
- 競合ベンチマーキング
- 競争力マトリックス
- 主要企業の製品マトリックス(材料タイプ別)
- 企業プロファイル
- Anhui Guofeng Wood-Plastic Composite Co., Ltd
- Bcomp Ltd.
- BioComposites Group
- Celanese Corporation
- Eastman Chemical Company
- Fiberon
- FlexForm Technologies
- INCA Renewtech
- Lingrove Inc.
- Meshlin Composites Zrt.
- Nanjing Xuhua Sundi New Building Materials Co., Ltd
- Trex Company, Inc.
- Tecnaro GmbH
- UFP Industries, Inc.
- UPM
第6章 調査手法
List of Figures
- Figure 1: Global Bio-Composite Materials Market, $Billion, 2022, 2023, and 2032
- Figure 2: Global Bio-Composite Materials Market (by Application), $Billion, 2022 and 2032
- Figure 3: Global Bio-Composite Materials Market (by Material Type), $Billion, 2022 and 2032
- Figure 4: Global Bio-Composite Materials Market (by Product Type), $Billion, 2022 and 2032
- Figure 5: Global Bio-Composite Materials Market (by Processing Technique), $Billion, 2022 and 2032
- Figure 6: Global Bio-Composite Materials Market (by Region), $Billion, 2022 and 2032
- Figure 7: Global Bio-Composite Materials Market Coverage
- Figure 8: Supply Chain Analysis of the Global Bio-Composite Materials Market
- Figure 9: Global Bio-Composite Materials Market (by Application), Volume, 2022, 2023, and 2032
- Figure 10: Global Bio-Composite Materials Market (by Application), Value, 2022, 2023, and 2032
- Figure 11: Global Bio-Composite Materials Market (by Product Type), Volume, 2022, 2023, and 2032
- Figure 12: Global Bio-Composite Materials Market (by Product Type), Value, 2022, 2023, and 2032
- Figure 13: Global Bio-Composite Materials Market (by Material Type), Volume, 2022, 2023, and 2032
- Figure 14: Global Bio-Composite Materials Market (by Material Type), Value, 2022, 2023, and 2032
- Figure 15: Global Bio-Composite Materials Market (by Processing Technique), Volume, 2022, 2023, and 2032
- Figure 16: Global Bio-Composite Materials Market (by Processing Technique), Value, 2022, 2023, and 2032
- Figure 17: Number of Patents Filed for Global Bio-Composite Materials Market, January 2020- October 2023
- Figure 18: Number of Patents Granted for Global Bio-Composite Materials Market, January 2020-October 2023
- Figure 19: Global Bio-Composite Materials Market, Patent Analysis (by Status), January 2020-October 2023
- Figure 20: Global Bio-Composite Materials Market, Patent Analysis (by Organization), January 2020-October 2023
- Figure 21: North America Bio-Composite Materials Market, $Million, 2022-2032
- Figure 22: North America Bio-Composite Materials Market (by Application), Volume, 2022, 2023, and 2032
- Figure 23: North America Bio-Composite Materials Market (by Application), Value, 2022, 2023, and 2032
- Figure 24: North America Bio-Composite Materials Market (by Material Type), Volume, 2022, 2023, and 2032
- Figure 25: North America Bio-Composite Materials Market (by Material Type), Value, 2022, 2023, and 2032
- Figure 26: North America Bio-Composite Materials Market (by Product Type), Volume, 2022, 2023, and 2032
- Figure 27: North America Bio-Composite Materials Market (by Product Type), Value, 2022, 2023, and 2032
- Figure 28: North America Bio-Composite Materials Market (by Processing Technique), Volume, 2022, 2023, and 2032
- Figure 29: North America Bio-Composite Materials Market (by Processing Technique), Value, 2022, 2023, and 2032
- Figure 30: U.S. Bio-Composite Materials Market, $Million, 2022-2032
- Figure 31: U.S. Bio-Composite Materials Market (by Application), Volume, 2022, 2023, and 2032
- Figure 32: U.S. Bio-Composite Materials Market (by Application), Value, 2022, 2023, and 2032
- Figure 33: U.S. Bio-Composite Materials Market (by Material Type), Volume, 2022, 2023, and 2032
- Figure 34: U.S. Bio-Composite Materials Market (by Material Type), Value, 2022, 2023, and 2032
- Figure 35: U.S. Bio-Composite Materials Market (by Product Type), Volume, 2022, 2023, and 2032
- Figure 36: U.S. Bio-Composite Materials Market (by Product Type), Value, 2022, 2023, and 2032
- Figure 37: U.S. Bio-Composite Materials Market (by Processing Technique), Volume, 2022, 2023, and 2032
- Figure 38: U.S. Bio-Composite Materials Market (by Processing Technique), Value, 2022, 2023, and 2032
- Figure 39: Canada Bio-Composite Materials Market, $Million, 2022-2032
- Figure 40: Canada Bio-Composite Materials Market (by Application), Volume, 2022, 2023, and 2032
- Figure 41: Canada Bio-Composite Materials Market (by Application), Value, 2022, 2023, and 2032
- Figure 42: Canada Bio-Composite Materials Market (by Material Type), Volume, 2022, 2023, and 2032
- Figure 43: Canada Bio-Composite Materials Market (by Material Type), Value, 2022, 2023, and 2032
- Figure 44: Canada Bio-Composite Materials Market (by Product Type), Volume, 2022, 2023, and 2032
- Figure 45: Canada Bio-Composite Materials Market (by Product Type), Value, 2022, 2023, and 2032
- Figure 46: Canada Bio-Composite Materials Market (by Processing Technique), Volume, 2022, 2023, and 2032
- Figure 47: Canada Bio-Composite Materials Market (by Processing Technique), Value, 2022, 2023, and 2032
- Figure 48: Mexico Bio-Composite Materials Market, $Million, 2022-2032
- Figure 49: Mexico Bio-Composite Materials Market (by Application), Volume, 2022, 2023, and 2032
- Figure 50: Mexico Bio-Composite Materials Market (by Application), Value, 2022, 2023, and 2032
- Figure 51: Mexico Bio-Composite Materials Market (by Material Type), Volume, 2022, 2023, and 2032
- Figure 52: Mexico. Bio-Composite Materials Market (by Material Type), Value, 2022, 2023, and 2032
- Figure 53: Mexico Bio-Composite Materials Market (by Product Type), Volume, 2022, 2023, and 2032
- Figure 54: Mexico Bio-Composite Materials Market (by Product Type), Value, 2022, 2023, and 2032
- Figure 55: Mexico Bio-Composite Materials Market (by Processing Technique), Volume, 2022, 2023, and 2032
- Figure 56: Mexico Bio-Composite Materials Market (by Processing Technique), Value, 2022, 2023, and 2032
- Figure 57: Europe Bio-Composite Materials Market, $Million, 2022-2032
- Figure 58: Europe Bio-Composite Materials Market (by Application), Volume, 2022, 2023, and 2032
- Figure 59: Europe Bio-Composite Materials Market (by Application), Value, 2022, 2023, and 2032
- Figure 60: Europe Bio-Composite Materials Market (by Material Type), Volume, 2022, 2023, and 2032
- Figure 61: Europe Bio-Composite Materials Market (by Material Type), Value, 2022, 2023, and 2032
- Figure 62: Europe Bio-Composite Materials Market (by Product Type), Volume, 2022, 2023, and 2032
- Figure 63: Europe Bio-Composite Materials Market (by Product Type), Value, 2022, 2023, and 2032
- Figure 64: Europe Bio-Composite Materials Market (by Processing Technique), Volume, 2022, 2023, and 2032
- Figure 65: Europe Bio-Composite Materials Market (by Processing Technique), Value, 2022, 2023, and 2032
- Figure 66: Germany Bio-Composite Materials Market, $Million, 2022-2032
- Figure 67: Germany Bio-Composite Materials Market (by Application), Volume, 2022, 2023, and 2032
- Figure 68: Germany Bio-Composite Materials Market (by Application), Value, 2022, 2023, and 2032
- Figure 69: Germany Bio-Composite Materials Market (by Material Type), Volume, 2022, 2023, and 2032
- Figure 70: Germany Bio-Composite Materials Market (by Material Type), Value, 2022, 2023, and 2032
- Figure 71: Germany Bio-Composite Materials Market (by Product Type), Volume, 2022, 2023, and 2032
- Figure 72: Germany Bio-Composite Materials Market (by Product Type), Value, 2022, 2023, and 2032
- Figure 73: Germany Bio-Composite Materials Market (by Processing Technique), Volume, 2022, 2023, and 2032
- Figure 74: Germany Bio-Composite Materials Market (by Processing Technique), Value, 2022, 2023, and 2032
- Figure 75: France Bio-Composite Materials Market, $Million, 2022-2032
- Figure 76: France Bio-Composite Materials Market (by Application), Volume, 2022, 2023, and 2032
- Figure 77: France Bio-Composite Materials Market (by Application), Value, 2022, 2023, and 2032
- Figure 78: France Bio-Composite Materials Market (by Material Type), Volume, 2022, 2023, and 2032
- Figure 79: France Bio-Composite Materials Market (by Material Type), Value, 2022, 2023, and 2032
- Figure 80: France Bio-Composite Materials Market (by Product Type), Volume, 2022, 2023, and 2032
- Figure 81: France Bio-Composite Materials Market (by Product Type), Value, 2022, 2023, and 2032
- Figure 82: France Bio-Composite Materials Market (by Processing Technique), Volume, 2022, 2023, and 2032
- Figure 83: France Bio-Composite Materials Market (by Processing Technique), Value, 2022, 2023, and 2032
- Figure 84: Italy Bio-Composite Materials Market, $Million, 2022-2032
- Figure 85: Italy Bio-Composite Materials Market (by Application), Volume, 2022, 2023, and 2032
- Figure 86: Italy Bio-Composite Materials Market (by Application), Value, 2022, 2023, and 2032
- Figure 87: Italy Bio-Composite Materials Market (by Material Type), Volume, 2022, 2023, and 2032
- Figure 88: Italy Bio-Composite Materials Market (by Material Type), Value, 2022, 2023, and 2032
- Figure 89: Italy Bio-Composite Materials Market (by Product Type), Volume, 2022, 2023, and 2032
- Figure 90: Italy Bio-Composite Materials Market (by Product Type), Value, 2022, 2023, and 2032
- Figure 91: Italy Bio-Composite Materials Market (by Processing Technique), Volume, 2022, 2023, and 2032
- Figure 92: Italy Bio-Composite Materials Market (by Processing Technique), Value, 2022, 2023, and 2032
- Figure 93: Spain Bio-Composite Materials Market, $Million, 2022-2032
- Figure 94: Spain Bio-Composite Materials Market (by Application), Volume, 2022, 2023, and 2032
- Figure 95: Spain Bio-Composite Materials Market (by Application), Value, 2022, 2023, and 2032
- Figure 96: Spain Bio-Composite Materials Market (by Material Type), Volume, 2022, 2023, and 2032
- Figure 97: Spain Bio-Composite Materials Market (by Material Type), Value, 2022, 2023, and 2032
- Figure 98: Spain Bio-Composite Materials Market (by Product Type), Volume, 2022, 2023, and 2032
- Figure 99: Spain Bio-Composite Materials Market (by Product Type), Value, 2022, 2023, and 2032
- Figure 100: Spain Bio-Composite Materials Market (by Processing Technique), Volume, 2022, 2023, and 2032
- Figure 101: Spain Bio-Composite Materials Market (by Processing Technique), Value, 2022, 2023, and 2032
- Figure 102: Rest-of-Europe Bio-Composite Materials Market, $Million, 2022-2032
- Figure 103: Rest-of-Europe Bio-Composite Materials Market (by Application), Volume, 2022, 2023, and 2032
- Figure 104: Rest-of-Europe Bio-Composite Materials Market (by Application), Value, 2022, 2023, and 2032
- Figure 105: Rest-of-Europe Bio-Composite Materials Market (by Material Type), Volume, 2022, 2023, and 2032
- Figure 106: Rest-of-Europe Bio-Composite Materials Market (by Material Type), Value, 2022, 2023, and 2032
- Figure 107: Rest-of-Europe Bio-Composite Materials Market (by Product Type), Volume, 2022, 2023, and 2032
- Figure 108: Rest-of-Europe Bio-Composite Materials Market (by Product Type), Value, 2022, 2023, and 2032
- Figure 109: Rest-of-Europe Bio-Composite Materials Market (by Processing Technique), Volume, 2022, 2023, and 2032
- Figure 110: Rest-of-Europe Bio-Composite Materials Market (by Processing Technique), Value, 2022, 2023, and 2032
- Figure 111: U.K. Bio-Composite Materials Market, $Million, 2022-2032
- Figure 112: U.K. Bio-Composite Materials Market (by Application), Volume, 2022, 2023, and 2032
- Figure 113: U.K. Bio-Composite Materials Market (by Application), Value, 2022, 2023, and 2032
- Figure 114: U.K. Bio-Composite Materials Market (by Material Type), Volume, 2022, 2023, and 2032
- Figure 115: U.K. Bio-Composite Materials Market (by Material Type), Value, 2022, 2023, and 2032
- Figure 116: U.K. Bio-Composite Materials Market (by Product Type), Volume, 2022, 2023, and 2032
- Figure 117: U.K. Bio-Composite Materials Market (by Product Type), Value, 2022, 2023, and 2032
- Figure 118: U.K. Bio-Composite Materials Market (by Processing Technique), Volume, 2022, 2023, and 2032
- Figure 119: U.K. Bio-Composite Materials Market (by Processing Technique), Value, 2022, 2023, and 2032
- Figure 120: China Bio-Composite Materials Market, $Million, 2022-2032
- Figure 121: China Bio-Composite Materials Market (by Application), Volume, 2022, 2023, and 2032
- Figure 122: China Bio-Composite Materials Market (by Application), Value, 2022, 2023, and 2032
- Figure 123: China Bio-Composite Materials Market (by Material Type), Volume, 2022, 2023, and 2032
- Figure 124: China Bio-Composite Materials Market (by Material Type), Value, 2022, 2023, and 2032
- Figure 125: China Bio-Composite Materials Market (by Product Type), Volume, 2022, 2023, and 2032
- Figure 126: China Bio-Composite Materials Market (by Product Type), Value, 2022, 2023, and 2032
- Figure 127: China Bio-Composite Materials Market (by Processing Technique), Volume, 2022, 2023, and 2032
- Figure 128: China Bio-Composite Materials Market (by Processing Technique), Value, 2022, 2023, and 2032
- Figure 129: Asia-Pacific and Japan Bio-Composite Materials Market, $Million, 2022-2032
- Figure 130: Asia-Pacific and Japan Bio-Composite Materials Market (by Application), Volume, 2022, 2023, and 2032
- Figure 131: Asia-Pacific and Japan Bio-Composite Materials Market (by Application), Value, 2022, 2023, and 2032
- Figure 132: Asia-Pacific and Japan Bio-Composite Materials Market (by Material Type), Volume, 2022, 2023, and 2032
- Figure 133: Asia-Pacific and Japan Bio-Composite Materials Market (by Material Type), Value, 2022, 2023, and 2032
- Figure 134: Asia-Pacific and Japan Bio-Composite Materials Market (by Product Type), Volume, 2022, 2023, and 2032
- Figure 135: Asia-Pacific and Japan Bio-Composite Materials Market (by Product Type), Value, 2022, 2023, and 2032
- Figure 136: Asia-Pacific and Japan Bio-Composite Materials Market (by Processing Technique), Volume, 2022, 2023, and 2032
- Figure 137: Asia-Pacific and Japan Bio-Composite Materials Market (by Processing Technique), Value, 2022, 2023, and 2032
- Figure 138: Japan Bio-Composite Materials Market, $Million, 2022-2032
- Figure 139: Japan Bio-Composite Materials Market (by Application), Volume, 2022, 2023, and 2032
- Figure 140: Japan Bio-Composite Materials Market (by Application), Value, 2022, 2023, and 2032
- Figure 141: Japan Bio-Composite Materials Market (by Material Type), Volume, 2022, 2023, and 2032
- Figure 142: Japan Bio-Composite Materials Market (by Material Type), Value, 2022, 2023, and 2032
- Figure 143: Japan Bio-Composite Materials Market (by Product Type), Volume, 2022, 2023, and 2032
- Figure 144: Japan Bio-Composite Materials Market (by Product Type), Value, 2022, 2023, and 2032
- Figure 145: Japan Bio-Composite Materials Market (by Processing Technique), Volume, 2022, 2023, and 2032
- Figure 146: Japan Bio-Composite Materials Market (by Processing Technique), Value, 2022, 2023, and 2032
- Figure 147: South Korea Bio-Composite Materials Market, $Million, 2022-2032
- Figure 148: South Korea Bio-Composite Materials Market (by Application), Volume, 2022, 2023, and 2032
- Figure 149: South Korea Bio-Composite Materials Market (by Application), Value, 2022, 2023, and 2032
- Figure 150: South Korea Bio-Composite Materials Market (by Material Type), Volume, 2022, 2023, and 2032
- Figure 151: South Korea Bio-Composite Materials Market (by Material Type), Value, 2022, 2023, and 2032
- Figure 152: South Korea Bio-Composite Materials Market (by Product Type), Volume, 2022, 2023, and 2032
- Figure 153: South Korea Bio-Composite Materials Market (by Product Type), Value, 2022, 2023, and 2032
- Figure 154: South Korea Bio-Composite Materials Market (by Processing Technique), Volume, 2022, 2023, and 2032
- Figure 155: South Korea Bio-Composite Materials Market (by Processing Technique), Value, 2022, 2023, and 2032
- Figure 156: India Bio-Composite Materials Market, $Million, 2022-2032
- Figure 157: India Bio-Composite Materials Market (by Application), Volume, 2022, 2023, and 2032
- Figure 158: India Bio-Composite Materials Market (by Application), Value, 2022, 2023, and 2032
- Figure 159: India Bio-Composite Materials Market (by Material Type), Volume, 2022, 2023, and 2032
- Figure 160: India Bio-Composite Materials Market (by Material Type), Value, 2022, 2023, and 2032
- Figure 161: India Bio-Composite Materials Market (by Product Type), Volume, 2022, 2023, and 2032
- Figure 162: India Bio-Composite Materials Market (by Product Type), Value, 2022, 2023, and 2032
- Figure 163: India Bio-Composite Materials Market (by Processing Technique), Volume, 2022, 2023, and 2032
- Figure 164: India Bio-Composite Materials Market (by Processing Technique), Value, 2022, 2023, and 2032
- Figure 165: Rest-of-Asia-Pacific and Japan Bio-Composite Materials Market, $Million, 2022-2032
- Figure 166: Rest-of-Asia-Pacific and Japan Bio-Composite Materials Market (by Application), Volume, 2022, 2023, and 2032
- Figure 167: Rest-of-Asia-Pacific and Japan Bio-Composite Materials Market (by Application), Value, 2022, 2023, and 2032
- Figure 168: Rest-of-Asia-Pacific and Japan Bio-Composite Materials Market (by Material Type), Volume, 2022, 2023, and 2032
- Figure 169: Rest-of-Asia-Pacific and Japan Bio-Composite Materials Market (by Material Type), Value, 2022, 2023, and 2032
- Figure 170: Rest-of-Asia-Pacific and Japan Bio-Composite Materials Market (by Product Type), Volume, 2022, 2023, and 2032
- Figure 171: Rest-of-Asia-Pacific and Japan Bio-Composite Materials Market (by Product Type), Value, 2022, 2023, and 2032
- Figure 172: Rest-of-Asia-Pacific and Japan Bio-Composite Materials Market (by Processing Technique), Volume, 2022, 2023, and 2032
- Figure 173: Rest-of-Asia-Pacific and Japan Bio-Composite Materials Market (by Processing Technique), Value, 2022, 2023, and 2032
- Figure 174: Rest-of-the-World Bio-Composite Materials Market, $Million, 2022-2032
- Figure 175: Rest-of-the-World Bio-Composite Materials Market (by Application), Volume, 2022, 223, and 2032
- Figure 176: Rest-of-the-World Bio-Composite Materials Market (by Application), Value, 2022, 2023, and 2032
- Figure 177: Rest-of-the-World Bio-Composite Materials Market (by Material Type), Volume, 2022, 2023, and 2032
- Figure 178: Rest-of-the-World Bio-Composite Materials Market (by Material Type), Value, 2022, 2023, and 2032
- Figure 179: Rest-of-the-World Bio-Composite Materials Market (by Product Type), Volume, 2022, 2023, and 2032
- Figure 180: Rest-of-the-World Bio-Composite Materials Market (by Product Type), Value, 2022, 2023, and 2032
- Figure 181: Rest-of-the-World Bio-Composite Materials Market (by Processing Technique), Volume, 2022, 2023, and 2032
- Figure 182: Rest-of-the-World Bio-Composite Materials Market (by Processing Technique), Value, 2022, 2023, and 2032
- Figure 183: Middle East and Africa Bio-Composite Materials Market, $Million, 2022-2032
- Figure 184: Middle East and Africa Bio-Composite Materials Market (by Application), Volume, 2022, 2023, and 2032
- Figure 185: Middle East and Africa Bio-Composite Materials Market (by Application), Value, 2022, 2023, and 2032
- Figure 186: Middle East and Africa Bio-Composite Materials Market (by Material Type), Volume, 2022, 2023, and 2032
- Figure 187: Middle East and Africa Bio-Composite Materials Market (by Material Type), Value, 2022, 2023, and 2032
- Figure 188: Middle East and Africa Bio-Composite Materials Market (by Product Type), Volume, 2022, 2023, and 2032
- Figure 189: Middle East and Africa Bio-Composite Materials Market (by Product Type), Value, 2022, 2023, and 2032
- Figure 190: Middle East and Africa Bio-Composite Materials Market (by Processing Technique), Volume, 2022, 2023, and 2032
- Figure 191: Middle East and Africa Bio-Composite Materials Market (by Processing Technique), Value, 2022, 2023, and 2032
- Figure 192: South America Bio-Composite Materials Market, $Million, 2022-2032
- Figure 193: South America Bio-Composite Materials Market (by Application), Volume, 2022, 2023, and 2032
- Figure 194: South America Bio-Composite Materials Market (by Application), Value, 2022, 2023, and 2032
- Figure 195: South America Bio-Composite Materials Market (by Material Type), Volume, 2022, 2023, and 2032
- Figure 196: South America Bio-Composite Materials Market (by Material Type), Value, 2022, 2023, and 2032
- Figure 197: South America Bio-Composite Materials Market (by Product Type), Volume, 2022, 2023, and 2032
- Figure 198: South America Bio-Composite Materials Market (by Product Type), Value, 2022, 2023, and 2032
- Figure 199: South America Bio-Composite Materials Market (by Processing Technique), Volume, 2022, 2023, and 2032
- Figure 200: South America Bio-Composite Materials Market (by Processing Technique), Value, 2022, 2023, and 2032
- Figure 201: Research Methodology
- Figure 202: Top-Down/Bottom-Up Approach
- Figure 203: Global Bio-Composite Materials Market: Influencing Factors
- Figure 204: Assumptions and Limitations
List of Tables
- Table 1: Stakeholders of the Bio-Composite Materials Market
- Table 2: Key Biomass Sources
- Table 3: Key Product and Market Development
- Table 4: Key Mergers and Acquisitions, Partnerships, Collaborations, and Joint Ventures
- Table 5: Key Bio Source Composite's Proportion Fortification for Different Applications
- Table 6: Technology Comparison
- Table 7: Average Global Pricing Analysis of Bio-Composite Materials Market, $/kg, 2022-2032
- Table 8: Average Pricing Analysis, Bio-Composite Materials Market (by Region), $/kg, 2022-2032
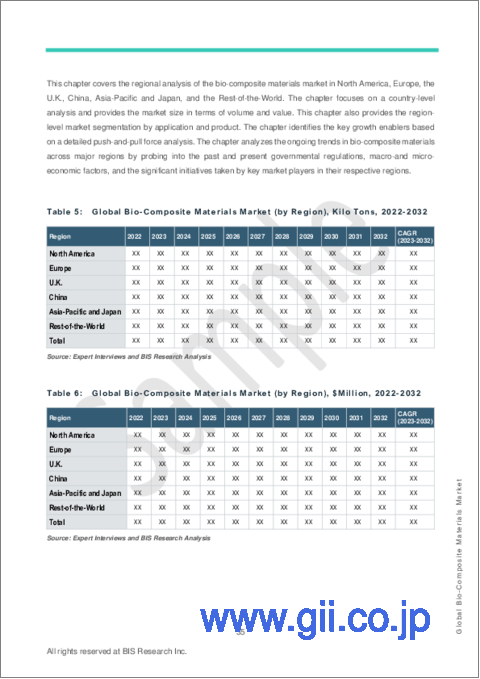
- Table 9: Global Bio-Composite Materials Market (by Region), Kilo Tons, 2022-2032
- Table 10: Global Bio-Composite Materials Market (by Region), $Million, 2022-2032
- Table 11: Product Matrix of Key Companies (by Material Type)
“Global Bio-Composite Materials Market Expected to Reach $55.93 Billion by 2032.”
Global Bio-Composite Materials Market Overview
| KEY MARKET STATISTICS | |
|---|---|
| Forecast Period | 2023 - 2032 |
| 2023 Evaluation | $13.59 Billion |
| 2032 Forecast | $55.93 Billion |
| CAGR | 17.03% |
The global bio-composite materials market was valued at $11.90 billion in 2022, and it is expected to grow at a CAGR of 17.03% and reach $55.93 billion by 2032. The growth in the global bio-composite materials market is expected to be driven by a combination of factors, primarily led by the rising awareness and adoption of eco-friendly and biodegradable materials in various industries, including automotive, construction, packaging, and consumer goods, among others.
Introduction of Bio-Composite Materials
Bio-composites represent a specialized sector within the composite materials industry, highlighting the utilization of natural fibers and matrices derived from renewable sources such as agricultural byproducts, wood, and bio-based polymers to create innovative and environmentally sustainable composite materials. These bio-composites offer multiple advantages over traditional synthetic composites, including a reduction in environmental impact, lower carbon emissions, and increased biodegradability. Furthermore, the global emphasis on sustainability by governments and industries is placing the bio-composite materials market on the cusp of substantial expansion. Additionally, in the coming years, there is an anticipation that bio-composite materials may approach their limits in their existing formulations and designs, leading to a growing demand for bio-composite materials with enhanced properties. These new bio-composite materials are currently under exploration with the aim of providing superior mechanical, thermal, and sustainability-related characteristics.
Market Introduction
The global bio-composite materials market is in a growth phase, wherein the number of companies offering bio-composite materials is increasing rapidly. Latest technological advancements in bio-composite materials, such as natural fibers and wood fibers, and the growing number of construction projects, the automotive industry, renewable energy demand, as well as electronics and consumer goods sectors, are boosting the adoption of the bio-composite materials market across the globe. Furthermore, numerous industry stakeholders are eagerly anticipating the future of the bio-composite materials market due to the escalating demand for environment-friendly and sustainable materials. The surge in global investments in eco-friendly materials is primarily driven by their low environmental impact and cost-effectiveness. Moreover, the potential of bio-composite materials to surpass traditional alternatives in terms of sustainability and performance stands as a significant advantage in the evolution of eco-friendly materials. Additionally, with significant demand for bio-composite materials during the forecast period (2023-2032), primarily from transportation, energy storage, and electronics, among other sectors, the market competition is expected to grow considerably among established and emerging bio-composite materials suppliers in the bio-composite materials market.
Industrial Impact
The global bio-composite materials market is experiencing significant growth due to several key factors. This growth is driven by increased research and development efforts aimed at improving sustainable materials, rising demand for environment-friendly alternatives, and growing focus on achieving carbon neutrality objectives. The popularity of bio-composite materials is on the rise because they offer numerous benefits, including enhanced durability, reduced environmental impact, and compatibility with a wide range of applications. Furthermore, the synergistic compatibility of bio-composite components with various structural elements can result in the creation of high-performance and environmentally responsible materials with a reduced ecological footprint. These materials provide long-term sustainable solutions that align with environmentally conscious practices, contributing to a greener future. Additionally, the increased energy efficiency of bio-composite materials can lead to the production of lightweight and eco-friendly products, which is particularly important in industries such as automotive manufacturing, where efficiency and sustainability are paramount.
Additionally, companies are increasingly focusing on delivering cutting-edge and eco-friendly solutions, expanding their customer base globally, and investing in research and development. The growth of the global bio-composite materials market depends on its ability to gain traction across major industries and effectively address sustainability concerns. In the current market landscape, there are challenges, such as scaling up the production of high-quality bio-composite materials and addressing specific application limitations. However, it is expected that the market conditions will become more favorable in the projected period from 2023 to 2032, paving the way for further expansion in the bio-composite materials market.
Market Segmentation:
Segmentation 1: By Application
- Automotive
- Construction
- Aerospace
- Consumer Goods
- Packaging
- Electronics
- Renewable Energy
- Others
Automotive Segment to Dominate the Global Bio-Composite Materials Market (by Application)
The automotive sector is anticipated to claim the largest market share by 2032. This projection is underpinned by the increasing utilization of bio-composites in the production of a wide array of trucks and cars. Furthermore, the use of bio-composites in crafting interior panels is also projected to witness substantial growth. These materials are expected to gain prominence due to their ability to reduce vehicle weight and enhance overall efficiency. Notably, the adoption of bio-composites is likely to yield significant cost savings in vehicle manufacturing processes. According to the International Energy Agency (IEA), more than 10 million electric vehicles have been sold by 2022. The growing popularity of electric vehicles is driving up demand for bio-composite materials.
Segmentation 2: By Material Type
- Natural Fibers
- Wood Fibers
- Bio-Polymers
- Next-Generation Materials
- Recycled Materials
- Synthetic Polymers
- Others
Wood Fibers to Dominate the Global Bio-Composite Materials Market (by Material Type)
Wood fiber composites led the bio-composite materials market in 2022. These bio-composites are manufactured in various forms, including decking, railings, balusters, fences, and more. Wood fiber composites are generally more cost-effective when compared to non-wood fiber composites. They find applications in various settings, such as residential properties, commercial establishments, pool-side areas, observatory decks, and jetties. These factors contribute to the increasing demand for wood fiber composites during the forecast period.
Segmentation 3: by Product Type
- Green Composites
- Hybrid Composites
Hybrid Composites to Dominate the Global Bio-Composite Materials Market (by Product Type)
In the global bio-composite materials market, the hybrid composites segment claimed a leading market share in 2022. This strong market presence can be attributed to the widespread global demand for bio-composites. The popularity of hybrid composites is due to their excellent fiber-polymer adhesion, which leads to low moisture absorption, high strength, and exceptional dimensional stability.
Segmentation 4: by Processing Technique
- Compression Molding
- Injection Molding
- Resin Transfer Molding
- Extrusion
- Others
Extrusion to Dominate the Global Bio-Composite Materials Market (by Processing Technique)
The extrusion segment was the major processing technique in the bio-composite materials market in 2022 and is expected to be the fastest-growing segment from 2023 to 2032. This growth is driven by the increasing demand for vehicles, which is expected to stimulate the need for extrusion. On the other hand, injection molding is projected to be the fastest-growing category throughout the forecast period. This growth can be attributed to the increasing demand for mass production of thousands of identical components at lower costs, along with the advantages of design flexibility and precision, which are particularly beneficial for various end-user industries such as packaging, medical, and electronics, contributing positively to market expansion.
Segmentation 5: by Region
- North America: U.S., Canada, and Mexico
- Europe: Germany, France, Italy, Spain, and Rest-of-Europe
- U.K.
- China
- Asia-Pacific and Japan: Japan, South Korea, India, and Rest-of-Asia-Pacific and Japan
- Rest-of-the-World: Middle East and Africa and South America
The global bio-composite materials market is expected to witness significant growth in the coming years, with major contributions from China, Asia-Pacific and Japan, Europe, and North America regional markets. In terms of revenue generation, Asia-Pacific and Japan is anticipated to maintain its position as the largest market for bio-composite materials until 2032. This is primarily attributed to the upsurge in construction activities, population growth, thriving automotive industry, and an increase in disposable income, all of which are major driving factors for the growth of the bio-composite materials market in the Asia-Pacific region. Furthermore, China's rapidly rising economy and the presence of key industry players along the supply chain of bio-composite material components are having a significant impact on the market's growth.
Recent Developments in the Global Bio-Composite Materials Market
- In February 2023, AZEK Company introduced a range of fresh outdoor living products under the TimberTech brand, featuring two stylish composite deck board colors, French White Oak and Dark Cocoa. Renowned as an industry leader, AZEK Company is known for its exceptional design and production of aesthetically pleasing, low-maintenance, and environmentally sustainable outdoor living products, including TimberTech decking, Versatex, and AZEK Trim.
- In July 2022, BASF SE unveiled a novel biopolymer derived from rice for use in mattifying skin care products. This innovative cosmetic ingredient, known as Verdessence RiceTouch, is created from non-GMO rice cultivated in the European Union as part of BASF SE's care creation business. It is designed to effectively absorb different oils, thus helping to eliminate any oily or greasy sensations in cosmetic products and on the skin.
- In August 2022, DSM Engineering Materials introduced StanylB-MB (bio-based mass balanced), an eco-friendly iteration of its primary polyamide (PA) product. StanylB-MB contains up to 100% bio-based material and allows DSM Engineering Materials to reduce the carbon footprint of this product line by half.
- In June 2022, SoluBlue, a leading polymer manufacturer based in Germany, unveiled Verdessence RiceTouch, a new biopolymer for use in various personal care products. Additionally, the company offers a natural polymer derived from FDA-approved seaweed-based ingredients, contributing to sustainable and eco-friendly solutions in the industry.
- In February 2023, Loop Industries, SUEZ, and SK geo-centric selected the Grand Est region of France as the designated manufacturing site for producing virgin-quality polyethylene terephthalate (PET) plastic made entirely from 100% recycled content. The collaborative effort between these three partners is set to commence construction work in early 2025, with the plant expected to become operational in 2027.
Demand - Drivers, Challenges, and Opportunities
Market Drivers: Growing Demand for Lightweight Materials across Various End-Use Industries
The persistent need for lightweight materials in a wide array of applications across sectors such as construction, aerospace, and automotive has driven advancements in bio-composites. Various industry players have consistently innovated bio-based composites to fulfill the demand for lightweight materials. For instance, in 2022, several automotive manufacturers, such as BMW, Volvo, and Porsche, collectively invested $35.9 million in the sustainable lightweighting specialist, Bcomp. Furthermore, in 2021, the Retrac Group planned to introduce an extensive range of natural bio-composites. These novel products combine the characteristics of both carbon fiber and natural fiber, making them suitable for crafting lightweight structures. As a result, the increasing need for lightweight materials in diverse industries highlights the significant influence of bio-composites in shaping the future of materials engineering.
Market Challenges: Thermal Instability and Comparatively Low Strength as Compared to Conventional Composite Materials
Natural fiber composites often exhibit a limited interfacial bond between the fibers and matrix, leading to subpar mechanical performance and relatively weaker strength when compared to synthetic fibers such as glass and carbon fiber. One important factor of comparison is that all plant-based fibers are inherently hydrophilic and polar, absorbing water due to their composition, primarily hemicellulose and pectins. In contrast, both thermoplastics and thermoset polymers are nonpolar and hydrophobic, creating compatibility challenges between the fibers and matrix. However, it's worth noting that the mechanical strength can be improved through chemical pre-treatment of the fibers. Furthermore, similar to synthetic fibers, natural fibers suffer from thermal instability, with thermal degradation initiating at approximately 392°F, rendering them incompatible with certain manufacturing processes. Additionally, inadequate fiber separation and dispersion represent significant drawbacks in the application of bio-composites, limiting their widespread use. All these factors are expected to hinder the growth of the bio-composite materials market during the forecast period (2023-2032).
Market Opportunities: Potential for Price Reduction through Economies of Scale
The energy required to manufacture bio-composites is significantly lower compared to the energy needed for producing glass fiber composites and carbon fiber composites. Nevertheless, bio-composites are currently available at a higher cost than glass fiber composites. However, due to the potential for economies of scale and their widespread applications, there is an opportunity for price reduction. Developing countries such as India and China, with abundant raw materials such as flax, jute, Kenaf, and hemp, can produce bio-composites at a lower cost, contributing to an overall reduction in the price of natural fiber-based bio-composites. Furthermore, it is anticipated that these bio-composites will become more affordable as the technology matures and production benefits from economies of scale. Additionally, expanded production capacity can empower bio-composite manufacturers to provide more competitive pricing, rendering their products more attractive to a broader spectrum of industries and applications. Consequently, this can catalyze the adoption and growth of the bio-composite materials industry.
How can this report add value to an organization?
Product/Innovation Strategy: The product segment helps the reader to understand the different types involved in the bio-composite materials market. Moreover, the study provides the reader with a detailed understanding of the global bio-composite materials market based on the application (automotive, construction, aerospace, consumer goods, packaging, electronics, renewable energy, and others). The bio-composite materials market is gaining traction in applications on the back of sustainability concerns and their higher tensile strength and toughness, among others. Bio-composite materials are also being used for controlling greenhouse gas (GHG) emissions. Moreover, partnerships and collaborations are expected to play a crucial role in strengthening market position over the coming years, with the companies focusing on bolstering their technological capabilities and gaining a dominant market share in the bio-composite materials industry.
Growth/Marketing Strategy: The global bio-composite materials market has been growing at a rapid pace. The market offers enormous opportunities for existing and emerging market players. Some of the strategies covered in this segment are mergers and acquisitions, product launches, partnerships and collaborations, business expansions, and investments. The strategies preferred by companies to maintain and strengthen their market position primarily include partnerships, agreements, and collaborations.
Competitive Strategy: The key players in the global bio-composite materials market analyzed and profiled in the study include bio-composite materials suppliers that develop, maintain, and market bio-composite materials. Moreover, a detailed competitive benchmarking of the players operating in the global bio-composite materials market has been done to help the reader understand the ways in which players stack against each other, presenting a clear market landscape. Additionally, comprehensive competitive strategies such as partnerships, agreements, and collaborations will aid the reader in understanding the untapped revenue pockets in the market.
Research Methodology
Factors for Data Prediction and Modeling
- The scope of this report has been focused on bio-composite materials.
- The market volume has been calculated based on the composite materials production and share of the bio-composite materials market in overall composite material production.
- Based on the classification, the average selling price (ASP) has been calculated by the weighted average method. ASP calculations are completely based on the number of data points considered while conducting the research.
- The base currency considered for the market analysis is the US$. Currencies other than the US$ have been converted to the US$ for all statistical calculations, considering the average conversion rate for that particular year.
- The currency conversion rate has been taken from the historical exchange rate of the Oanda website.
- Nearly all the recent developments from January 2020 to March 2023 have been considered in this research study.
- The study of the market is limited to bio-composite materials type and does not include other types.
- The information rendered in the report is a result of in-depth primary interviews, surveys, and secondary analysis.
- Where relevant information was not available, proxy indicators and extrapolation were employed.
- Any economic downturn in the future has not been taken into consideration for the market estimation and forecast.
- Technologies currently used are expected to persist through the forecast with no major technological breakthroughs.
Market Estimation and Forecast
The market size for the global bio-composite materials market has been calculated through a mix of secondary research and primary inputs. A combination of top-down and bottom-up approaches has been followed to derive the quantitative information. The steps involved in the bottom-up approach are as follows:
- Overall composite materials production for each country has been calculated separately.
- Further, based on past data and future scenarios, each country's bio-composite materials have been estimated till the forecast timeframe.
- For each country, the bio-composite materials penetration is calculated based on different secondary sources, and the same information has been validated from primary sources across the ecosystem of the bio-composite materials market.
- Once the penetration of the bio-composite materials has been estimated in the composite materials production, the penetration for each level is estimated based on the parameters such as:
- Major end-users, such as electric vehicle developments, construction projects, and renewable energy projects in the country
- A regulatory scenario of each country
- The presence of bio-composite materials manufacturers in the country
- The economic condition of the country
- The estimated numbers of bio-composite materials have been derived based on the demand for different types of bio-composite materials.
- From different secondary sources and primary respondents, the penetration of bio-composite materials is estimated for each product and application.
- Further, based on past end-user trends, primary interviews, and future scenarios, region shares have been estimated till the forecast timeframe.
- For each country, the bio-composite materials penetration was calculated based on different secondary sources, and the same information has been validated from primary sources across the ecosystem of the bio-composite materials market.
- Based on the penetration of bio-composite materials under each product and application, the total estimated number of bio-composite materials was derived for each country. After calculating the same data for each country, the numbers are summed up to get regional-level demand, and regional-level demand is summed up to get global demand from 2022 to 2032.
- All the factors, such as penetration levels in each country, are validated from different primaries throughout the duration of the study.
Primary Research
The primary sources involve the bio-composite materials industry experts and stakeholders such as data suppliers, platform developers, and service providers. Respondents such as vice presidents, CEOs, marketing directors, and technology and innovation directors have been interviewed to verify this research study's qualitative and quantitative aspects.
The key data points taken from primary sources include:
- validation and triangulation of all the numbers and graphs
- validation of reports segmentation and key qualitative findings
- understanding the competitive landscape
- validation of the numbers of various markets for market type
- percentage split of individual markets for region-wise analysis
Secondary Research
This research study involves the usage of extensive secondary research, directories, company websites, and annual reports. It also makes use of databases, such as Hoovers, Bloomberg, Businessweek, and Factiva, to collect useful and effective information for an extensive, technical, market-oriented, and commercial study of the global market. In addition to the aforementioned data sources, the study has been undertaken with the help of other data sources and websites.
Secondary research was done to obtain crucial information about the industry's value chain, revenue models, the market's monetary chain, the total pool of key players, and the current and potential use cases and applications.
Key Market Players and Competition Synopsis
The companies that are profiled have been selected based on inputs gathered from primary experts and analyzing company coverage, product portfolio, and market penetration.
Among the top players profiled in the report, the private companies operating in the global bio-composite materials market accounted for around 80% of the market share in 2022, while the public companies operating in the market captured around 20% of the market share.
Some of the prominent names in this market are:
Private Companies
|
Public Companies
|
Table of Contents
1 Markets
- 1.1 Industry Outlook
- 1.1.1 Trends: Current and Future
- 1.1.1.1 Growing Utilization of Bio-Composite in the Packaging Industry
- 1.1.1.2 Utilization of Lignocellulosic Biomass in Biofuel Production
- 1.1.2 Supply Chain Analysis
- 1.1.3 Comparison Analysis between Bio-Composite and Conventional Composite Materials
- 1.1.4 Emerging Biomass Sources for Bio-Composite Materials
- 1.1.1 Trends: Current and Future
- 1.2 Business Dynamics
- 1.2.1 Business Drivers
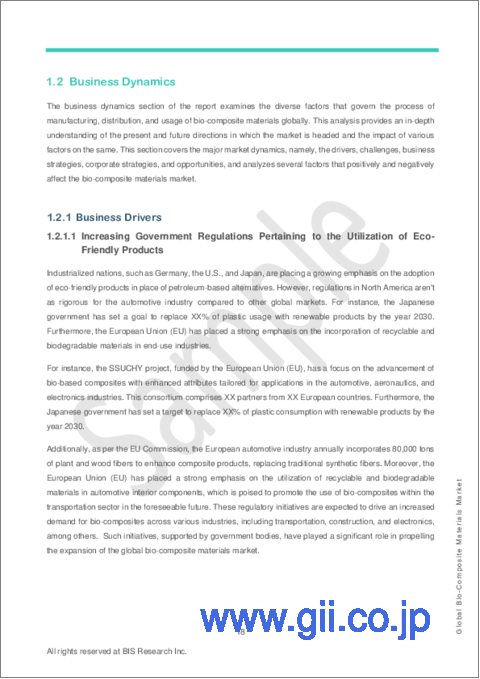
- 1.2.1.1 Increasing Government Regulations Pertaining to the Utilization of Eco-Friendly Products
- 1.2.1.2 Growing Demand for lightweight Materials across Various End-Use Industries
- 1.2.1.3 Advancements in Manufacturing Processes and Rising Initiatives by Key Market Players
- 1.2.2 Business Restraints
- 1.2.2.1 Thermal Instability and Comparatively Low Strength as Compared to Conventional Composite Materials
- 1.2.2.2 Elevated Production Costs Associated with Bio-Composites
- 1.2.2.3 Availability of Low-Cost and High-Performing Alternatives
- 1.2.3 Business Strategies
- 1.2.3.1 Product and Market Development
- 1.2.4 Corporate Strategies
- 1.2.4.1 Mergers and Acquisitions, Partnerships, Collaborations, and Joint Ventures
- 1.2.5 Business Opportunities
- 1.2.5.1 Potential for Price Reduction through Economies of Scale
- 1.2.5.2 Increasing Demand for Lightweight and Environment-Friendly Materials in the Automotive Sector in China
- 1.2.5.3 Rising Trend of Sustainable Construction Practices Worldwide
- 1.2.1 Business Drivers
2 Application
- 2.1 Global Bio-Composite Materials Market (by Application): Specifications and Demand Analysis, Value and Volume Data
- 2.1.1 Global Bio-Composite Materials Market (by Application)
- 2.1.1.1 Automotive
- 2.1.1.2 Construction
- 2.1.1.3 Aerospace
- 2.1.1.4 Consumer Goods
- 2.1.1.5 Packaging
- 2.1.1.6 Electronics
- 2.1.1.7 Renewable Energy
- 2.1.1.8 Others
- 2.1.1 Global Bio-Composite Materials Market (by Application)
3 Products
- 3.1 Global Bio-Composite Materials Market (by Product Type): Specifications and Demand Analysis, Value and Volume Data
- 3.1.1 Global Bio-Composite Materials Market (by Product Type)
- 3.1.1.1 Green Composites
- 3.1.1.2 Hybrid Composites
- 3.1.1 Global Bio-Composite Materials Market (by Product Type)
- 3.2 Global Bio-Composite Materials Market (by Material Type): Specifications and Demand Analysis, Value and Volume Data
- 3.2.1 Global Bio-Composite Materials Market (by Material Type)
- 3.2.1.1 Natural Fibers
- 3.2.1.1.1 Hemp
- 3.2.1.1.2 Flax Fiber
- 3.2.1.1.3 Jute Fiber
- 3.2.1.1.4 Others
- 3.2.1.2 Wood Fibers
- 3.2.1.2.1 Wood Flour
- 3.2.1.2.2 Sawdust
- 3.2.1.3 Bio-Polymers
- 3.2.1.3.1 PLA
- 3.2.1.3.2 PHA
- 3.2.1.3.3 Starch Polymers
- 3.2.1.3.4 Others
- 3.2.1.4 Next-Generation Materials
- 3.2.1.4.1 Nanocellulose
- 3.2.1.4.2 Lignin
- 3.2.1.4.3 Others
- 3.2.1.5 Recycled Materials
- 3.2.1.5.1 Recycled Plastics
- 3.2.1.5.2 Recycled Paper and Cardboard
- 3.2.1.5.3 Others
- 3.2.1.6 Synthetic Polymers
- 3.2.1.7 Others
- 3.2.1.1 Natural Fibers
- 3.2.1 Global Bio-Composite Materials Market (by Material Type)
- 3.3 Global Bio-Composite Materials Market (by Processing Technique): Specifications and Demand Analysis, Value and Volume Data
- 3.3.1 Global Bio-Composite Materials Market (by Processing Technique)
- 3.3.1.1 Compression Molding
- 3.3.1.2 Injection Molding
- 3.3.1.3 Resin Transfer Molding
- 3.3.1.4 Extrusion
- 3.3.1.5 Others
- 3.3.1 Global Bio-Composite Materials Market (by Processing Technique)
- 3.4 Product Benchmarking: Growth Rate - Market Share Matrix (by Product Type), 2022
- 3.5 Patent Analysis
- 3.5.1 Patent Analysis (by Status)
- 3.5.2 Patent Analysis (by Organization)
- 3.6 Pricing Analysis
- 3.6.1 Global and Regional Level: Average Pricing Analysis of Bio-Composite Materials, $/kg
4 Regions
- 4.1 North America
- 4.1.1 Market
- 4.1.1.1 Business Drivers
- 4.1.1.2 Business Challenges
- 4.1.2 Application, Value and Volume Data
- 4.1.3 Product, Value and Volume Data
- 4.1.3.1 Material Type
- 4.1.3.2 Product Type
- 4.1.3.3 Processing Technique
- 4.1.4 North America (by Country)
- 4.1.4.1 U.S.
- 4.1.4.1.1 Market
- 4.1.4.1.2 Application, Value and Volume Data
- 4.1.4.1.3 Product, Value and Volume Data
- 4.1.4.1.3.1 Material Type
- 4.1.4.1.3.2 Product Type
- 4.1.4.1.3.3 Processing Technique
- 4.1.4.2 Canada
- 4.1.4.2.1 Market
- 4.1.4.2.2 Application, Value and Volume Data
- 4.1.4.2.3 Product, Value and Volume Data
- 4.1.4.2.3.1 Material Type
- 4.1.4.2.3.2 Product Type
- 4.1.4.2.3.3 Processing Technique
- 4.1.4.3 Mexico
- 4.1.4.3.1 Market
- 4.1.4.3.2 Application, Value and Volume Data
- 4.1.4.3.3 Product, Value and Volume Data
- 4.1.4.3.3.1 Material Type
- 4.1.4.3.3.2 Product Type
- 4.1.4.3.3.3 Processing Technique
- 4.1.4.1 U.S.
- 4.1.1 Market
- 4.2 Europe
- 4.2.1 Market
- 4.2.1.1 Business Drivers
- 4.2.1.2 Business Challenges
- 4.2.2 Application, Value and Volume Data
- 4.2.3 Product, Value and Volume Data
- 4.2.3.1 Material Type
- 4.2.3.2 Product Type
- 4.2.3.3 Processing Technique
- 4.2.4 Europe (by Country)
- 4.2.4.1 Germany
- 4.2.4.1.1 Market
- 4.2.4.1.2 Application, Value and Volume Data
- 4.2.4.1.3 Product, Value and Volume Data
- 4.2.4.1.3.1 Material Type
- 4.2.4.1.3.2 Product Type
- 4.2.4.1.3.3 Processing Technique
- 4.2.4.2 France
- 4.2.4.2.1 Market
- 4.2.4.2.2 Application, Value and Volume Data
- 4.2.4.2.3 Product, Value and Volume Data
- 4.2.4.2.3.1 Material Type
- 4.2.4.2.3.2 Product Type
- 4.2.4.2.3.3 Processing Technique
- 4.2.4.3 Italy
- 4.2.4.3.1 Market
- 4.2.4.3.2 Application, Value and Volume Data
- 4.2.4.3.3 Product, Value and Volume Data
- 4.2.4.3.3.1 Material Type
- 4.2.4.3.3.2 Product Type
- 4.2.4.3.3.3 Processing Technique
- 4.2.4.4 Spain
- 4.2.4.4.1 Market
- 4.2.4.4.2 Application, Value and Volume Data
- 4.2.4.4.3 Product, Value and Volume Data
- 4.2.4.4.3.1 Material Type
- 4.2.4.4.3.2 Product Type
- 4.2.4.4.3.3 Processing Technique
- 4.2.4.5 Rest-of-Europe
- 4.2.4.5.1 Market
- 4.2.4.5.2 Application, Value and Volume Data
- 4.2.4.5.3 Product, Value and Volume Data
- 4.2.4.5.3.1 Material Type
- 4.2.4.5.3.2 Product Type
- 4.2.4.5.3.3 Processing Technique
- 4.2.4.1 Germany
- 4.2.1 Market
- 4.3 U.K.
- 4.3.1 Market
- 4.3.1.1 Business Drivers
- 4.3.1.2 Business Challenges
- 4.3.2 Application, Value and Volume Data
- 4.3.3 Product, Value and Volume Data
- 4.3.3.1 Material Type
- 4.3.3.2 Product Type
- 4.3.3.3 Processing Technique
- 4.3.1 Market
- 4.4 China
- 4.4.1 Market
- 4.4.1.1 Business Drivers
- 4.4.1.2 Business Challenges
- 4.4.2 Application, Value and Volume Data
- 4.4.3 Product, Value and Volume Data
- 4.4.3.1 Material Type
- 4.4.3.2 Product Type
- 4.4.3.3 Processing Technique
- 4.4.1 Market
- 4.5 Asia-Pacific and Japan
- 4.5.1 Market
- 4.5.1.1 Business Drivers
- 4.5.1.2 Business Challenges
- 4.5.2 Application, Value and Volume Data
- 4.5.3 Product, Value and Volume Data
- 4.5.3.1 Material Type
- 4.5.3.2 Product Type
- 4.5.3.3 Processing Technique
- 4.5.4 Asia-Pacific and Japan (by Country)
- 4.5.4.1 Japan
- 4.5.4.1.1 Market
- 4.5.4.1.2 Application, Value and Volume Data
- 4.5.4.1.3 Product, Value and Volume Data
- 4.5.4.1.3.1 Material Type
- 4.5.4.1.3.2 Product Type
- 4.5.4.1.3.3 Processing Technique
- 4.5.4.2 South Korea
- 4.5.4.2.1 Market
- 4.5.4.2.2 Application, Value and Volume Data
- 4.5.4.2.3 Product, Value and Volume Data
- 4.5.4.2.3.1 Material Type
- 4.5.4.2.3.2 Product Type
- 4.5.4.2.3.3 Processing Technique
- 4.5.4.3 India
- 4.5.4.3.1 Market
- 4.5.4.3.2 Application, Value and Volume Data
- 4.5.4.3.3 Product, Value and Volume Data
- 4.5.4.3.3.1 Material Type
- 4.5.4.3.3.2 Product Type
- 4.5.4.3.3.3 Processing Technique
- 4.5.4.4 Rest-of-Asia-Pacific and Japan
- 4.5.4.4.1 Market
- 4.5.4.4.2 Application, Value and Volume Data
- 4.5.4.4.3 Product, Value and Volume Data
- 4.5.4.4.3.1 Material Type
- 4.5.4.4.3.2 Product Type
- 4.5.4.4.3.3 Processing Technique
- 4.5.4.1 Japan
- 4.5.1 Market
- 4.6 Rest-of-the-World
- 4.6.1 Market
- 4.6.1.1 Business Drivers
- 4.6.1.2 Business Challenges
- 4.6.2 Application, Value and Volume Data
- 4.6.3 Product, Value and Volume Data
- 4.6.3.1 Material Type
- 4.6.3.2 Product Type
- 4.6.3.3 Processing Technique
- 4.6.4 Rest-of-the-World (by Region)
- 4.6.4.1 Middle East and Africa
- 4.6.4.1.1 Market
- 4.6.4.1.2 Application, Value and Volume Data
- 4.6.4.1.3 Product, Value and Volume Data
- 4.6.4.1.3.1 Material Type
- 4.6.4.1.3.2 Product Type
- 4.6.4.1.3.3 Processing Technique
- 4.6.4.2 South America
- 4.6.4.2.1 Market
- 4.6.4.2.2 Application, Value and Volume Data
- 4.6.4.2.3 Product, Value and Volume Data
- 4.6.4.2.3.1 Material Type
- 4.6.4.2.3.2 Product Type
- 4.6.4.2.3.3 Processing Technique
- 4.6.4.1 Middle East and Africa
- 4.6.1 Market
5 Markets - Competitive Benchmarking & Company Profiles
- 5.1 Competitive Benchmarking
- 5.1.1 Competitive Position Matrix
- 5.1.2 Product Matrix of Key Companies (by Material Type)
- 5.2 Company Profiles
- 5.2.1 Anhui Guofeng Wood-Plastic Composite Co., Ltd
- 5.2.1.1 Overview
- 5.2.1.2 Top Products / Product Portfolio
- 5.2.1.3 Top Competitors
- 5.2.1.4 Target Customers/End-Users
- 5.2.1.5 Key Personnel
- 5.2.1.6 Analyst View
- 5.2.1.7 Market Share
- 5.2.2 Bcomp Ltd.
- 5.2.2.1 Overview
- 5.2.2.2 Top Products / Product Portfolio
- 5.2.2.3 Top Competitors
- 5.2.2.4 Target Customers/End-Users
- 5.2.2.5 Key Personnel
- 5.2.2.6 Analyst View
- 5.2.2.7 Market Share
- 5.2.3 BioComposites Group
- 5.2.3.1 Overview
- 5.2.3.2 Top Products / Product Portfolio
- 5.2.3.3 Top Competitors
- 5.2.3.4 Target Customers/End-Users
- 5.2.3.5 Key Personnel
- 5.2.3.6 Analyst View
- 5.2.3.7 Market Share
- 5.2.4 Celanese Corporation
- 5.2.4.1 Overview
- 5.2.4.2 Top Products / Product Portfolio
- 5.2.4.3 Top Competitors
- 5.2.4.4 Target Customers/End-Users
- 5.2.4.5 Key Personnel
- 5.2.4.6 Analyst View
- 5.2.4.7 Market Share
- 5.2.5 Eastman Chemical Company
- 5.2.5.1 Overview
- 5.2.5.2 Top Products / Product Portfolio
- 5.2.5.3 Top Competitors
- 5.2.5.4 Target Customers/End-Users
- 5.2.5.5 Key Personnel
- 5.2.5.6 Analyst View
- 5.2.5.7 Market Share
- 5.2.6 Fiberon
- 5.2.6.1 Overview
- 5.2.6.2 Top Products / Product Portfolio
- 5.2.6.3 Top Competitors
- 5.2.6.4 Target Customers/End-Users
- 5.2.6.5 Key Personnel
- 5.2.6.6 Analyst View
- 5.2.6.7 Market Share
- 5.2.7 FlexForm Technologies
- 5.2.7.1 Overview
- 5.2.7.2 Top Products / Product Portfolio
- 5.2.7.3 Top Competitors
- 5.2.7.4 Target Customers/End-Users
- 5.2.7.5 Key Personnel
- 5.2.7.6 Analyst View
- 5.2.7.7 Market Share
- 5.2.8 INCA Renewtech
- 5.2.8.1 Overview
- 5.2.8.2 Top Products / Product Portfolio
- 5.2.8.3 Top Competitors
- 5.2.8.4 Target Customers/End-Users
- 5.2.8.5 Key Personnel
- 5.2.8.6 Analyst View
- 5.2.8.7 Market Share
- 5.2.9 Lingrove Inc.
- 5.2.9.1 Overview
- 5.2.9.2 Top Products / Product Portfolio
- 5.2.9.3 Top Competitors
- 5.2.9.4 Target Customers/End-Users
- 5.2.9.5 Key Personnel
- 5.2.9.6 Analyst View
- 5.2.9.7 Market Share
- 5.2.10 Meshlin Composites Zrt.
- 5.2.10.1 Overview
- 5.2.10.2 Top Products / Product Portfolio
- 5.2.10.3 Top Competitors
- 5.2.10.4 Target Customers/End-Users
- 5.2.10.5 Key Personnel
- 5.2.10.6 Analyst View
- 5.2.10.7 Market Share
- 5.2.11 Nanjing Xuhua Sundi New Building Materials Co., Ltd
- 5.2.11.1 Overview
- 5.2.11.2 Top Products / Product Portfolio
- 5.2.11.3 Top Competitors
- 5.2.11.4 Target Customers/End-Users
- 5.2.11.5 Key Personnel
- 5.2.11.6 Analyst View
- 5.2.11.7 Market Share
- 5.2.12 Trex Company, Inc.
- 5.2.12.1 Overview
- 5.2.12.2 Top Products / Product Portfolio
- 5.2.12.3 Top Competitors
- 5.2.12.4 Target Customers/End-Users
- 5.2.12.5 Key Personnel
- 5.2.12.6 Analyst View
- 5.2.12.7 Market Share
- 5.2.13 Tecnaro GmbH
- 5.2.13.1 Overview
- 5.2.13.2 Top Products / Product Portfolio
- 5.2.13.3 Top Competitors
- 5.2.13.4 Target Customers/End-Users
- 5.2.13.5 Key Personnel
- 5.2.13.6 Analyst View
- 5.2.13.7 Market Share
- 5.2.14 UFP Industries, Inc.
- 5.2.14.1 Overview
- 5.2.14.2 Top Products / Product Portfolio
- 5.2.14.3 Top Competitors
- 5.2.14.4 Target Customers/End-Users
- 5.2.14.5 Key Personnel
- 5.2.14.6 Analyst View
- 5.2.14.7 Market Share
- 5.2.15 UPM
- 5.2.15.1 Overview
- 5.2.15.2 Top Products / Product Portfolio
- 5.2.15.3 Top Competitors
- 5.2.15.4 Target Customers/End-Users
- 5.2.15.5 Key Personnel
- 5.2.15.6 Analyst View
- 5.2.15.7 Market Share
- 5.2.1 Anhui Guofeng Wood-Plastic Composite Co., Ltd
6 Research Methodology
- 6.1 Primary Data Sources
- 6.2 BIS Data Sources
- 6.3 Assumptions and Limitations

