|
|
市場調査レポート
商品コード
1218347
米国の整形外科用画像モダリティと整形外科手術用ナビゲーションシステム市場 - 世界および地域別分析:モダリティ別、製品別、用途別、エンドユーザー別 - 分析と予測(2022年~2031年)U.S. Orthopedic Imaging Modalities and Orthopedic Surgical Navigation Systems Market: Focus on Modality, Application, and End User - Analysis and Forecast, 2022-2031 |
||||||
|
|
|||||||
|
● お客様のご希望に応じて、既存データの加工や未掲載情報(例:国別セグメント)の追加などの対応が可能です。 詳細はお問い合わせください。 |
|||||||


| 米国の整形外科用画像モダリティと整形外科手術用ナビゲーションシステム市場 - 世界および地域別分析:モダリティ別、製品別、用途別、エンドユーザー別 - 分析と予測(2022年~2031年) |
|
出版日: 2023年02月02日
発行: BIS Research
ページ情報: 英文 184 Pages
納期: 1~5営業日
|
- 全表示
- 概要
- 図表
- 目次
米国の整形外科用画像モダリティと整形外科手術用ナビゲーションシステムの市場規模は、2022年に26億9,780万米ドルとなりました。
同市場は今後、2022年~2031年にかけて4.44%のCAGRで拡大し、2031年には39億8,990万米ドルに達すると予測されています。
当レポートでは、米国の整形外科用画像モダリティと整形外科手術用ナビゲーションシステム市場について調査し、市場の概要とともに、モダリティ別、製品別、用途別、エンドユーザー別の動向、および市場に参入する企業のプロファイルなどを提供しています。
目次
第1章 市場
- 市場の見通し
- 業界の見通し
- COVID-19が米国の整形外科用画像モダリティと整形外科手術用ナビゲーションシステム市場に与える影響
- ビジネスダイナミクス
第2章 米国の整形外科用画像モダリティ市場(用途別)
- 概要
- 成長 - シェアマトリクス
- 股関節
- 膝関節
- 脊椎
- その他の四肢
第3章 米国の整形外科用画像モダリティ市場(モダリティ別)
- 概要
- 成長 - シェアマトリクス
- X線
- コンピューター断層撮影(CT)スキャナー
- 磁気共鳴画像(MRI)システム
- 超音波システム
第4章 米国の整形外科用画像モダリティ市場(エンドユーザー別)
- 概要
- 成長 - シェアマトリクス
- 病院
- 外来手術センター
- その他
第5章 米国の整形外科用ナビゲーションシステム市場(用途別)
- 概要
- 成長 - シェアマトリクス
- 関節
- 脊椎
第6章 市場-競合ベンチマーキングと企業プロファイル
- 競合ベンチマーキング
- 競合情勢
- 主要開発分析
- 企業プロファイル
- Canon Inc.
- FUJIFILM Holdings Corporation
- General Electric Company
- Johnson & Johnson
- Konica Minolta, Inc.
- Koninklijke Philips N.V.
- Medtronic plc
- OrthAlign, Inc.
- Shimadzu Corporation
- Siemens Healthineers AG
- Smith & Nephew plc
- SonoScape Medical Corp.
- Stryker Corporation
- United Imaging Healthcare Co., Ltd.
- Zimmer Biomet Holdings, Inc.
List of Figures
- Figure 1: U.S. Orthopedic Imaging Modalities Market, $Million, 2020-2031
- Figure 2: U.S. Orthopedic Imaging Modalities Market Dynamics, Impact Analysis
- Figure 3: U.S. Orthopedic Surgical Navigation Systems Market, $Million, 2020-2031
- Figure 4: U.S. Orthopedic Surgical Navigation Systems Market Dynamics, Impact Analysis
- Figure 5: Segmentation of U.S. Orthopedic Imaging Modalities Market, $Million, 2020-2031
- Figure 6: Segmentation of U.S. Orthopedic Surgical Navigation Systems Market, $Million, 2020-2031
- Figure 7: U.S. Orthopedic Imaging Modalities and Surgical Navigation Systems Market, Research Methodology
- Figure 8: Primary Research
- Figure 9: Secondary Research
- Figure 10: Data Triangulation
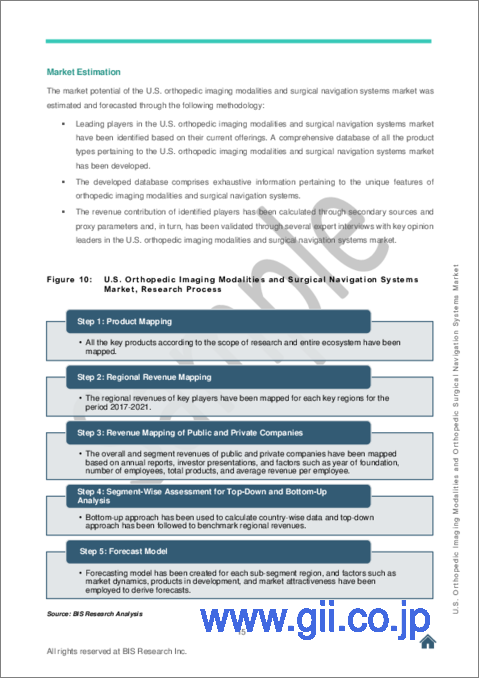
- Figure 11: U.S. Orthopedic Imaging Modalities and Surgical Navigation Systems Market, Research Process
- Figure 12: Assumptions and Limitations
- Figure 13: U.S. Orthopedic Imaging Modalities Market, Potential Forecast Scenarios
- Figure 14: U.S. Orthopedic Imaging Modalities Market Size and Growth Potential (Realistic Scenario), $Million, 2020-2031
- Figure 15: U.S. Orthopedic Imaging Modalities Market Size and Growth Potential (Optimistic Scenario), $Million, 2020-2031
- Figure 16: U.S. Orthopedic Imaging Modalities Market Size and Growth Potential (Pessimistic Scenario), $Million, 2020-2031
- Figure 17: U.S. Orthopedic Surgical Navigation Systems Market, Potential Forecast Scenarios
- Figure 18: U.S. Orthopedic Surgical Navigation Systems Market Size and Growth Potential (Realistic Scenario), $Million, 2020-2031
- Figure 19: U.S. Orthopedic Surgical Navigation Systems Market Size and Growth Potential (Optimistic Scenario), $Million, 2020-2031
- Figure 20: U.S. Orthopedic Surgical Navigation Systems Market Size and Growth Potential (Pessimistic Scenario), $Million, 2020-2031
- Figure 21: U.S. Orthopedic Imaging Modalities Market, Patent Analysis (by Year), January 2018-September 2022
- Figure 22: U.S. Orthopedic Surgical Navigation Systems Market, Patent Analysis (by Year), January 2018-September 2022
- Figure 23: U.S. Orthopedic Imaging Modalities and Surgical Navigation Systems Market, Orthopedic Imaging Modalities (by Modality), Product Benchmarking
- Figure 24: U.S. Orthopedic Imaging Modalities Market, Impact Analysis
- Figure 25: Recent Advances in Imaging and Radiology in Orthopedics
- Figure 26: U.S. Orthopedic Imaging Modalities Market, Business Trends
- Figure 27: U.S. Orthopedic Surgical Navigation Systems Market, Impact Analysis
- Figure 28: Total Knee Arthroplasty, Procedure Volume, Unit, 2020-2040
- Figure 29: Total Hip Arthroplasty, Procedure Volume, Unit, 2020-2040
- Figure 30: Post-Operative Complications, Minimally Invasive Surgeries (MIS) vs. Open Procedure, 2019
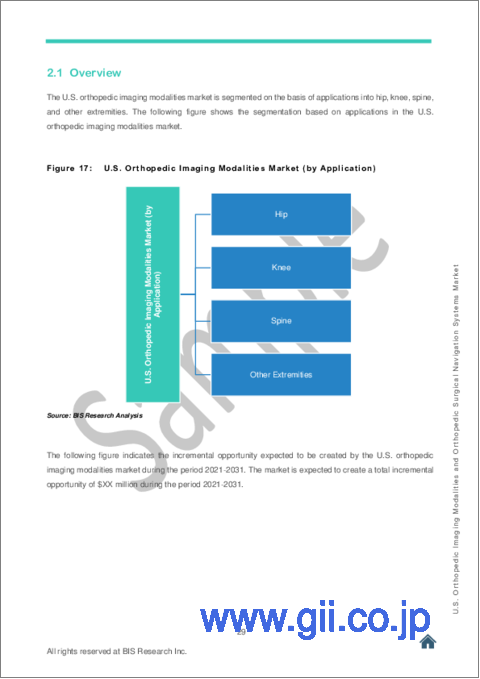
- Figure 31: U.S. Orthopedic Imaging Modalities Market (by Application)
- Figure 32: U.S. Orthopedic Imaging Modalities Market, Incremental Opportunity (by Application), 2021-2031
- Figure 33: U.S. Orthopedic Imaging Modalities Market, Growth-Share Matrix (by Application), 2021-2031
- Figure 34: U.S. Orthopedic Imaging Modalities Market (Hip), $Million, 2020-2031
- Figure 35: U.S. Orthopedic Imaging Modalities Market (Knee), $Million, 2020-2031
- Figure 36: U.S. Orthopedic Imaging Modalities Market (Spine), $Million, 2020-2031
- Figure 37: U.S. Orthopedic Imaging Modalities Market (Other Extremities), $Million, 2020-2031
- Figure 38: U.S. Orthopedic Imaging Modalities Market (by Modality)
- Figure 39: U.S. Orthopedic Imaging Modalities Market, Incremental Opportunity (by Modality), 2021-2031
- Figure 40: U.S. Orthopedic Imaging Modalities Market, Growth-Share Matrix (by Modality), 2021-2031
- Figure 41: U.S. Orthopedic Imaging Modalities Market (X-Ray), Market Dynamics
- Figure 42: Key Trends in X-Ray
- Figure 43: U.S. Orthopedic Imaging Modalities Market (X-Ray), Procedure Volume, 2020-2031
- Figure 44: U.S. Orthopedic Imaging Modalities Market, X-Ray (by Application), Procedure Volume, 2020-2031
- Figure 45: U.S. Orthopedic Imaging Modalities Market X-Ray (by State), Procedure Volume, 2021
- Figure 46: U.S. Orthopedic Imaging Modalities Market (X-Ray), $Million, 2020-2031
- Figure 47: U.S. Orthopedic Imaging Modalities Market, X-Ray (by Application), $Million, 2020-2031
- Figure 48: U.S. Orthopedic Imaging Modalities Market, Computed Tomography (CT) Scanners, Market Dynamics
- Figure 49: Key Trends in Computed Tomography (CT) Scanners
- Figure 50: U.S. Orthopedic Imaging Modalities Market (Computed Tomography (CT) Scanners), Procedure Volume, 2020-2031
- Figure 51: U.S. Orthopedic Imaging Modalities Market, Computed Tomography Scanners (by Application), Procedure Volume, 2020-2031
- Figure 52: U.S. Orthopedic Imaging Modalities Market, Computed Tomography (CT) Scanner (by State), Procedure Volume, 2021
- Figure 53: U.S. Orthopedic Imaging Modalities Market (Computed Tomography (CT) Scanners), $Million, 2020-2031
- Figure 54: U.S. Orthopedic Imaging Modalities Market, Computed Tomography (CT) Scanners (by Application), $Million, 2020-2031
- Figure 55: Types of Magnetic Resonance Imaging (MRI) Systems
- Figure 56: U.S. Orthopedic Imaging Modalities Market (Magnetic Resonance Imaging (MRI) Systems), Market Dynamics
- Figure 57: U.S. Orthopedic Imaging Modalities Market (Magnetic Resonance Imaging (MRI ) Systems), Market Trends
- Figure 58: U.S. Orthopedic Imaging Modalities Market (Magnetic Resonance Imaging (MRI) Systems), Procedure Volume, 2020-2031
- Figure 59: U.S. Orthopedic Imaging Modalities Market, MRI Systems (by Application), Procedure Volume, 2020-2031
- Figure 60: U.S. Orthopedic Imaging Modalities Market, Magnetic Resonance Imaging (MRI) Systems (by State), Procedure Volume, 2021
- Figure 61: U.S. Orthopedic Imaging Modalities Market (Magnetic Resonance Imaging (MRI) Systems), $Million, 2020-2031
- Figure 62: U.S. Orthopedic Imaging Modalities Market, Magnetic Resonance Imaging (MRI) Systems (by Application), $Million, 2020-2031
- Figure 63: U.S. Orthopedic Imaging Modalities Market (Ultrasound Systems), Market Dynamics
- Figure 64: U.S. Orthopedic Imaging Modalities Market (Ultrasound Systems), Procedure Volume, 2020-2031
- Figure 65: U.S. Orthopedic Imaging Modalities Market, Ultrasound Systems (by Application), Procedure Volume, 2020-2031
- Figure 66: U.S. Orthopedic Imaging Modalities Market, Ultrasound Systems (by State), Procedure Volume, 2021
- Figure 67: U.S. Orthopedic Imaging Modalities Market (Ultrasound Systems), $Million, 2020-2031
- Figure 68: U.S. Orthopedic Imaging Modalities Market, Ultrasound Systems (by Application), $Million, 2020-2031
- Figure 69: U.S. Orthopedic Imaging Modalities Market (by End User)
- Figure 70: U.S. Orthopedic Imaging Modalities Market, Incremental Opportunity (by End User), 2021-2031
- Figure 71: U.S. Orthopedic Imaging Modalities Market, Growth-Share Matrix (by End User), 2021-2031
- Figure 72: U.S. Orthopedic Imaging Modalities Market (Hospitals), $Million, 2020-2031
- Figure 73: U.S. Orthopedic Imaging Modalities Market (Ambulatory Surgery Centers), $Million, 2020-2031
- Figure 74: U.S. Orthopedic Imaging Modalities Market (Others), $Million, 2020-2031
- Figure 75: U.S. Orthopedic Surgical Navigation Systems Market (by Application)
- Figure 76: U.S. Orthopedic Surgical Navigation Systems Market, Incremental Opportunity (by Application), 2021-2031
- Figure 77: U.S. Orthopedic Surgical Navigation Systems Market, Growth-Share Matrix (by Application), 2021-2031
- Figure 78: U.S. Orthopedic Surgical Navigation Systems Market (Joints), $Million, 2020-2031
- Figure 79: U.S. Orthopedic Surgical Navigation Systems Market (Joints), $Million, 2020-2031
- Figure 80: U.S. Orthopedic Surgical Navigation Systems Market (Spine), $Million, 2020-2022
- Figure 81: U.S. Orthopedic Imaging Modalities and Surgical Navigation Systems Market, Total Number of Key Developments, January 2012-September 2022
- Figure 82: Regulatory and Legal Activities, January 2019- September 2022
- Figure 83: New Offerings, January 2019-September 2022
- Figure 84: Mergers and Acquisitions, January 2019-September 2022
- Figure 85: Partnerships, Alliances, and Business Expansion Activities, January 2019-September 2022
- Figure 86: U.S. Orthopedic Imaging Modalities and Surgical Navigation Systems Market, Key Development Analysis, January 2012-September 2022
- Figure 87: Canon Inc.: Some of the Product Portfolio
- Figure 88: Canon, Inc.: Overall Financials, $Million, 2019-2021
- Figure 89: Canon, Inc.: Net Revenue (by Segment), $Million, 2019-2021
- Figure 90: Canon, Inc.: Revenue (by Region), 2019-2021
- Figure 91: Canon, Inc.: R&D Expenditure, $Million, 2019-2021
- Figure 92: FUJIFILM Holdings Corporation: Some of the Product Portfolio
- Figure 93: FUJIFILM Holdings Corporation: Overall Financials, $Million, 2019-2021
- Figure 94: FUJIFILM Holdings Corporation: Net Revenue (by Segment), $Million, 2020-2021
- Figure 95: FUJIFILM Holdings Corporation: Net Revenue (by Region), $Million, 2018-2020
- Figure 96: FUJIFILM Holdings Corporation: R&D Expenditure, $Million, 2018-2020
- Figure 97: General Electric Company: Some of the Product Portfolio
- Figure 98: General Electric Company.: Overall Financials, $Million, 2019-2021
- Figure 99: General Electric Company: Net Revenue (by Segment), $Million, 2019-2021
- Figure 100: General Electric Company: Net Revenue (by Region), $Million, 2019-2021
- Figure 101: General Electric Company: R&D Expenditure, $Million, 2019-2021
- Figure 102: Johnson & Johnson: Overall Product Portfolio
- Figure 103: Johnson & Johnson: Overall Financials, $Million, 2019-2021
- Figure 104: Johnson & Johnson: Revenue (by Segment), $Million, 2019-2021
- Figure 105: Johnson & Johnson: Revenue (by Region), $Million 2019-2021
- Figure 106: Johnson & Johnson: R&D Expenditure, $Million, 2019-2021
- Figure 107: Konica Minolta, Inc.: Overall Product Portfolio
- Figure 108: Konica Minolta, Inc.: Overall Financials 2019-2021
- Figure 109: Konica Minolta, Inc.: Net Revenue (by Segment), $Million, 2019-2021
- Figure 110: Konica Minolta, Inc.: Net Revenue (by Region), $Million, 2019-2021
- Figure 111: Konica Minolta, Inc.: R&D Expenditure, $Million, 2019-2021
- Figure 112: Koninklijke Philips N.V.: Some of the Product Portfolio
- Figure 113: Koninklijke Philips N.V.: Overall Financials, $Million, 2019-2021
- Figure 114: Koninklijke Philips N.V.: Revenue (by Segment), $Million, 2019-2021
- Figure 115: Koninklijke Philips N.V.: Revenue (by Region), $Million, 2019-2021
- Figure 116: Koninklijke Philips N.V.: R&D Expenditure, $Million, 2019-2021
- Figure 117: Medtronic plc: Overall Product Portfolio
- Figure 118: Medtronic plc: Overall Financials, $Million, 2020-2022
- Figure 119: Medtronic plc: Revenue (by Segment), $Million, 2020-2022
- Figure 120: Medtronic plc: Revenue (by Region), $Million 2020-2022
- Figure 121: Medtronic plc: R&D Expenditure, $Million, 2020-2022
- Figure 122: OrthAlign, Inc.: Some of the Product Portfolio
- Figure 123: Shimadzu Corporation: Some of the Product Portfolio
- Figure 124: Shimadzu Corporation: Overall Financials, $Million, 2019-2021
- Figure 125: Shimadzu Corporation: Net Revenue (by Segment), $Million, 2019-2021
- Figure 126: Shimadzu Corporation: R&D Expenditure, $Million, 2019-2021
- Figure 127: Siemens Healthineers AG: Some of the Product Portfolio
- Figure 128: Siemens Healthineers AG: Overall Financials, $Million, 2019-2021
- Figure 129: Siemens Healthineers AG: Net Revenue (by Segment), $Million, 2019-2021
- Figure 130: Siemens Healthineers AG: Net Revenue (by Region), $Million, 2019-2021
- Figure 131: Siemens Healthineers AG: R&D Expenditure, $Million, 2019-2021
- Figure 132: Smith & Nephew plc: Overall Product Portfolio
- Figure 133: Smith & Nephew plc: Overall Financials, $Million, 2019-2021
- Figure 134: Smith & Nephew plc: Revenue (by Segment), $Million, 2019-2021
- Figure 135: Smith & Nephew plc: Revenue (by Region), $Million 2019-2021
- Figure 136: Smith & Nephew plc: R&D Expenditure, $Million, 2019-2021
- Figure 137: SonoScape Medical Corp.: Overall Product Portfolio
- Figure 138: Stryker Corporation: Overall Product Portfolio
- Figure 139: Stryker Corporation: Overall Financials, $Million, 2019-2021
- Figure 140: Stryker Corporation: Revenue (by Segment), $Million, 2019-2021
- Figure 141: Stryker Corporation: Sub-Segment Revenues (MedSurg and Neurotechnology), $Million 2019-2021
- Figure 142: Stryker Corporation: Revenue (by Region), $Million 2019-2021
- Figure 143: Stryker Corporation: R&D Expenditure, $Million, 2019-2021
- Figure 144: United Imaging Healthcare Co., Ltd.: Overall Product Portfolio
- Figure 145: Zimmer Biomet Holdings, Inc.: Product Portfolio
- Figure 146: Zimmer Biomet Holdings, Inc.: Overall Financials, $Million, 2019-2021
- Figure 147: Zimmer Biomet Holdings, Inc.: Revenue (by Segment), $Million, 2020-2021
- Figure 148: Zimmer Biomet Holdings, Inc.: Revenue (by Region), $Million, 2019-2021
- Figure 149: Zimmer Biomet Holdings, Inc.: R&D Expenditure, $Million, 2019-2021
List of Tables
- Table 1: Key Questions Answered in this Report
- Table 2: Parameters for Realistic, Optimistic, and Realistic Growth Scenarios
- Table 3: Parameters for Realistic, Optimistic, and Realistic Growth Scenarios
- Table 4: U.S. Orthopedic Imaging Modalities Market, Awaited Technologies
- Table 5: U.S. Orthopedic Surgical Navigation Systems Market, Awaited Technologies
- Table 6: Types of X-Rays (by Modality)
- Table 7: Types of Ultrasound Systems (by Technology)
- Table 8: Canon Inc.: Key Products and Features
- Table 9: FUJIFILM Holdings Corporation: Key Products and Features
- Table 10: General Electric Company: Key Products and Features
- Table 11: Johnson & Johnson: Key Products and Features
- Table 12: Konica Minolta, Inc.: Key Products and Features
- Table 13: Koninklijke Philips N.V.: Key Products and Features
- Table 14: Medtronic plc: Key Products and Features
- Table 15: OrthAlign, Inc.: Key Products and Features
- Table 16: Shimadzu Corporation: Key Products and Features
- Table 17: Siemens Healthineers AG: Key Products and Features
- Table 18: Smith & Nephew plc: Key Products and Features
- Table 19: SonoScape Medical Corp.: Key Products and Features
- Table 20: Stryker Corporation: Key Products and Features
- Table 21: United Imaging Healthcare Co., Ltd.: Key Products and Features
- Table 22: Zimmer Biomet Holdings, Inc.: Key Products and Features
“BIS Research Study Highlights U.S. Orthopedic Imaging Modalities and Orthopedic Surgical Navigation Systems Market.”
Industry Overview
The U.S. orthopedic imaging modalities and U.S. orthopedic surgical navigation systems market is segmented into U.S. orthopedic imaging modalities market and U.S. orthopedic surgical navigation systems market. The report highlights that the U.S. orthopedic imaging modalities market was valued at $2,697.8 million in 2022 and is expected to reach $3,989.9 million by the end of 2031. The market is expected to grow at a CAGR of 4.44% during the forecast period 2022-2031. The market is driven by factors such as technological advancements in the imaging field, the increasing incidences of orthopedic diseases and bone injuries, and the growing demand for point of care (POC) ultrasound systems in orthopedic applications. In addition to this, the report also highlights that the U.S. orthopedic surgical navigation systems market was valued at $262.9 million in 2022 and is expected to reach $460.9 million by the end of 2031. The market is expected to grow at a CAGR of 6.43% during the forecast period 2022-2031. The market is driven by factors such as the increasing number of joint replacement surgery and the increasing preference for minimally invasive surgery.
Market Lifecycle Stage
The U.S. orthopedic imaging modalities market is in the developed phase. The rising incidence of orthopedic indications and the upsurge in technological advancements are some of the major opportunities in the U.S. orthopedic imaging modalities market. Furthermore, some of the current key trends in the market are the inclination toward magnetic resonance imaging (MRI) systems and the integration of artificial intelligence (AI) in imaging modalities.
On the other hand, the U.S. orthopedic surgical navigation systems market is in the developing phase. The increasing preference for minimally invasive surgeries (MIS) and rising numbers of joint replacement surgeries are some of the major opportunities in the U.S. orthopedic surgical navigation systems market.
Impact of COVID-19
The COVID-19 pandemic has impacted practically all sectors and social functions worldwide, including the U.S. orthopedic imaging modalities and U.S. orthopedic surgical navigation systems market. The COVID-19 pandemic led to a decline in the U.S. orthopedic imaging modalities and U.S. orthopedic surgical navigation systems devices market, as screening, elective, and surgical procedures were stopped during the lockdown.
Overall, the supply side was negatively impacted, especially during the peak of the COVID-19 pandemic. The significantly high number of screening, elective, and surgical procedures resumed after the restrictions were lifted, which offset the negative impact and led to the growth of the market in 2021.
In addition to this, the COVID-19 pandemic also helped in the adoption of disposable access devices and hand instruments. Single-use devices eliminate the risk of cross-contamination, which turned out to be a favorable condition for their adoption during the COVID-19 pandemic.
Market Segmentation:
U.S. Orthopedic Imaging Modalities Market
Segmentation 1: by Application
- Hip
- Knee
- Spine
- Other Extremities
The U.S. orthopedic imaging modalities devices market (by application) is expected to be dominated by the spine segment.
Segmentation 2: by Modality
- X-Ray
- Computed Tomography (CT) Scanners
- Magnetic Resonance Imaging (MRI) Systems
- Ultrasound Systems
The U.S. orthopedic imaging modalities devices market (by modality) is expected to be dominated by the X-Ray segment.
Segmentation 3: by End User
- Hospitals
- Ambulatory Surgery Centers
- Others
The U.S. orthopedic imaging modalities devices market (by end user) is dominated by the hospitals segment.
U.S. Orthopedic Surgical Navigation Systems Market
Segmentation 1: by Application
- Joints
- Spine
The U.S. orthopedic surgical navigation systems market (by application) is expected to be dominated by the spine segment.
Recent Developments in the U.S. Orthopedic Imaging Modalities and U.S. Orthopedic Surgical Navigation Systems Market
- In February 2022, FUJIFILM Holdings Corporation launched the Sonosite LX ultrasound system.
- In December 2021, DePuy Synthes, a subsidiary of Johnson & Johnson, acquired OrthoSpin Ltd. to advance its innovation in the Medtech space.
- In November 2021, FUJIFILM Holdings Corporation launched Persona CS Mobile Fluoroscopy System expanding its C-arm portfolio.
- In September 2021, GE Healthcare, a subsidiary of General Electric Company, entered into an agreement to acquire BK Medical, a company that deals in surgical visualization. Through the acquisition, GE added a real-time surgical visualization field to the company's pre- and post-operative ultrasound capabilities.
- In September 2021, Canon Inc. announced getting into a definitive agreement to acquire Redlen Technologies Inc. Through this acquisition, Canon Inc. aimed to expand and improve the medical business of the company.
Demand - Drivers and Limitations
U.S. Orthopedic Imaging Modalities Market
The following are the drivers for the U.S. orthopedic imaging modalities market:
- Technological Advancements in Imaging
- Increasing Incidences of Orthopedic Diseases and Bone Injuries
- Growing Demand for POC Ultrasound Systems in Orthopedic
The market is expected to face some limitations as well due to the following challenges:
- Health Risks and Healthcare Costs from Potentially Inappropriate High-Cost Imaging
- Recall of Imaging Systems
U.S. Orthopedic Surgical Navigation Systems Market
The following are the drivers for the U.S. orthopedic surgical navigation systems market:
- Increasing Number of Joint Replacement Surgeries
- Increasing Preference for Minimally Invasive Procedures
The market is expected to face some limitations as well due to the following challenges:
- High Cost of Robotic Navigation System
How can this report add value to an organization?
U.S. Orthopedic Imaging Modalities Market
- Application: The application segment helps readers understand the various applications of U.S. orthopedic imaging modalities in the market.
- Modality: The modality segment helps the readers understand the different types of modalities available and their significance in the U.S. orthopedic imaging modalities market. Moreover, the study provides the readers with a detailed understanding of the four main segments, namely, X-Ray, computed tomography (CT) scanners, magnetic resonance imaging (MRI) systems, and ultrasound systems.
U.S. Orthopedic Surgical Navigation Systems Market
- Application: The application segment helps readers understand the various applications of U.S. orthopedic surgical navigation systems in the market.
U.S. Orthopedic Imaging Modalities and U.S. Orthopedic Surgical Navigation Systems Market
- Growth/Marketing Strategy: The U.S. orthopedic imaging modalities and U.S. orthopedic surgical navigation systems market has witnessed major development by key players operating in the market, such as product launches, business expansions, partnerships, collaborations, and regulatory and legal approvals. The most favored strategy for the companies has been regulatory and legal activities and new offerings to strengthen their position in the market. For instance, in February 2022, FUJIFILM Holdings Corporation launched the Sonosite LX ultrasound system, and in August 2021, DePuy Synthes, a subsidiary of Johnson & Johnson, received FDA clearance for VELYS robotic-assisted solution.
- Competitive Strategy: The key players in the U.S. orthopedic imaging modalities and U.S. orthopedic surgical navigation systems market analyzed and profiled in the study involve established and emerging players that offer different products for visualization of the joints and spine for diagnostic as well as therapeutic purposes. Moreover, a detailed competitive benchmarking of the players operating in the U.S. orthopedic imaging modalities and U.S. orthopedic surgical navigation systems market has been done to help the reader understand the ways in which players stack against each other, presenting a clear market landscape. Moreover, comprehensive competitive strategies such as partnerships, agreements, collaborations, mergers, and acquisitions will help the reader understand the untapped revenue pockets in the market.
Key Market Players and Competition Synopsis
Profiled companies have been selected based on inputs gathered from primary experts and analyzing company coverage, product portfolio, and market penetration.
Key Companies Profiled:
|
|
Table of Contents
1 Market
- 1.1 Market Outlook
- 1.1.1 Product Definition
- 1.1.2 Inclusion and Exclusion Criteria
- 1.1.3 Key Findings
- 1.1.4 Assumptions and Limitations
- 1.1.5 Market Scenario
- 1.1.5.1 U.S. Orthopedic Imaging Modalities Market
- 1.1.5.1.1 Realistic Growth Scenario
- 1.1.5.1.2 Optimistic Growth Scenario
- 1.1.5.1.3 Pessimistic Growth Scenario
- 1.1.5.2 U.S. Orthopedic Surgical Navigation Systems Market
- 1.1.5.2.1 Realistic Growth Scenario
- 1.1.5.2.2 Optimistic Growth Scenario
- 1.1.5.2.3 Pessimistic Growth Scenario
- 1.1.5.1 U.S. Orthopedic Imaging Modalities Market
- 1.2 Industry Outlook
- 1.2.1 Patent Analysis
- 1.2.1.1 U.S. Orthopedic Imaging Modalities Market
- 1.2.1.1.1 Patent Analysis (by Year)
- 1.2.1.1.2 Awaited Technological Developments
- 1.2.1.2 U.S. Orthopedic Surgical Navigation Systems Market
- 1.2.1.2.1 Patent Analysis (by Year)
- 1.2.1.2.2 Awaited Technological Developments
- 1.2.1.1 U.S. Orthopedic Imaging Modalities Market
- 1.2.2 Regulatory Landscape
- 1.2.3 Product Benchmarking
- 1.2.1 Patent Analysis
- 1.3 Impact of COVID-19 on the U.S. Orthopedic Imaging Modalities and Surgical Navigation Systems Market
- 1.3.1 Impact on Facilities
- 1.3.2 Impact on Modalities Adoption
- 1.3.3 Impact on Market Size
- 1.3.3.1 Pre-COVID-19 Phase
- 1.3.3.2 During-COVID-19 Phase
- 1.3.3.3 Post-COVID-19 Phase
- 1.4 Business Dynamics
- 1.4.1 U.S. Orthopedic Imaging Modalities Market
- 1.4.1.1 Impact Analysis
- 1.4.1.2 Business Drivers
- 1.4.1.2.1 Technological Advancement in Imaging
- 1.4.1.2.2 Increasing Incidences of Orthopedic Diseases and Bone Injuries
- 1.4.1.2.3 Growing Demand for Point-of-Care Ultrasound Systems (POCUS) in Orthopedics
- 1.4.1.3 Business Restraints
- 1.4.1.3.1 Health Risks and Healthcare Costs Arising from Potentially Inappropriate High-Cost Imaging
- 1.4.1.3.2 Recall of Imaging Systems
- 1.4.1.4 Business Opportunities
- 1.4.1.4.1 Leveraging Partnerships to Expand Business Opportunities
- 1.4.1.4.2 Increase in Usage of Dual Modality Imaging or Hybrid Imaging
- 1.4.1.5 Business Trends
- 1.4.2 U.S. Orthopedic Surgical Navigation Systems Market
- 1.4.2.1 Impact Analysis
- 1.4.2.2 Business Drivers
- 1.4.2.2.1 Increasing Number of Joint Replacement Surgeries
- 1.4.2.2.2 Increasing Preference for Minimally Invasive Procedures
- 1.4.2.3 Business Restraints
- 1.4.2.3.1 High Cost of Robotic Orthopedic Surgical Navigation System
- 1.4.2.4 Business Opportunities
- 1.4.2.4.1 Leveraging Synergies to Diversify Business Portfolio
- 1.4.1 U.S. Orthopedic Imaging Modalities Market
2 U.S. Orthopedic Imaging Modalities Market (by Application)
- 2.1 Overview
- 2.2 Growth-Share Matrix
- 2.3 Hip
- 2.4 Knee
- 2.5 Spine
- 2.6 Other Extremities
3 U.S. Orthopedic Imaging Modalities Market (by Modality)
- 3.1 Overview
- 3.2 Growth-Share Matrix
- 3.3 X-Ray
- 3.3.1 Market Dynamics
- 3.3.2 Procedure Volume
- 3.3.2.1 U.S. Orthopedic Imaging Modalities Market (by Application)
- 3.3.2.2 U.S. Orthopedic Imaging Modalities Market (by State)
- 3.3.3 Market Size and Forecast
- 3.3.3.1 U.S. Orthopedic Imaging Modalities Market (by Application)
- 3.4 Computed Tomography (CT) Scanners
- 3.4.1 Market Dynamics
- 3.4.2 Procedure Volume
- 3.4.2.1 U.S. Orthopedic Imaging Modalities Market (by Application)
- 3.4.2.2 U.S. Orthopedic Imaging Modalities Market (by State)
- 3.4.3 Market Size and Forecast
- 3.4.3.1 U.S. Orthopedic Imaging Modalities Market (by Application)
- 3.5 Magnetic Resonance Imaging (MRI) Systems
- 3.5.1 Market Dynamics
- 3.5.2 Procedure Volume
- 3.5.2.1 U.S. Orthopedic Imaging Modalities Market (by Application)
- 3.5.2.2 U.S. Orthopedic Imaging Modalities Market (by State)
- 3.5.3 Market Size and Forecast
- 3.5.3.1 U.S. Orthopedic Imaging Modalities Market (by Application)
- 3.6 Ultrasound Systems
- 3.6.1 Market Dynamics
- 3.6.2 Procedure Volume
- 3.6.2.1 U.S. Orthopedic Imaging Modalities Market (by Application)
- 3.6.2.2 U.S. Orthopedic Imaging Modalities Market (by State)
- 3.6.3 Market Size and Forecast
- 3.6.3.1 U.S. Orthopedic Imaging Modalities Market (by Application)
4 U.S. Orthopedic Imaging Modalities Market (by End User)
- 4.1 Overview
- 4.2 Growth-Share Matrix
- 4.3 Hospitals
- 4.4 Ambulatory Surgical Centers
- 4.5 Others
5 U.S. Orthopedic Surgical Navigation Systems Market (by Application)
- 5.1 Overview
- 5.2 Growth-Share Matrix
- 5.3 Joints
- 5.4 Spine
6 Market - Competitive Benchmarking & Company Profiles
- 6.1 Competitive Benchmarking
- 6.1.1 Competitive Landscape
- 6.1.1.1 Key Strategies and Developments
- 6.1.1.2 Regulatory and Legal Activities
- 6.1.1.3 New Offerings
- 6.1.1.4 Mergers and Acquisitions
- 6.1.1.5 Partnerships, Collaborations, and Business Expansion Activities
- 6.1.2 Key Development Analysis
- 6.1.1 Competitive Landscape
- 6.2 Company Profiles
- 6.2.1 Canon Inc.
- 6.2.1.1 Company Overview
- 6.2.1.2 Role of Canon Inc. in the U.S. Orthopedics Imaging Modalities and Surgical Navigation Systems Market
- 6.2.1.3 Product Portfolio
- 6.2.1.4 Financials
- 6.2.1.5 Recent Developments
- 6.2.1.6 Analyst Perception
- 6.2.2 FUJIFILM Holdings Corporation
- 6.2.2.1 Company Overview
- 6.2.2.2 Role of FUJIFILM Holdings Corporation in the U.S. Orthopedics Imaging Modalities and Surgical Navigation Systems Market
- 6.2.2.3 Product Portfolio
- 6.2.2.4 Financials
- 6.2.2.5 Recent Developments
- 6.2.2.6 Analyst Perception
- 6.2.3 General Electric Company
- 6.2.3.1 Company Overview
- 6.2.3.2 Role of General Electric Company in the U.S. Orthopedic Imaging Modalities and Surgical Navigation Systems Market
- 6.2.3.3 Product Portfolio
- 6.2.3.4 Financials
- 6.2.3.5 Recent Developments
- 6.2.3.6 Analyst Perception
- 6.2.4 Johnson & Johnson
- 6.2.4.1 Company Overview
- 6.2.4.2 Role of Johnson & Johnson in the U.S. Orthopedic Imaging Modalities and Surgical Navigation Systems Market
- 6.2.4.3 Product Portfolio
- 6.2.4.4 Financials
- 6.2.4.5 Recent Developments
- 6.2.4.6 Analyst Perception
- 6.2.5 Konica Minolta, Inc.
- 6.2.5.1 Company Overview
- 6.2.5.2 Role of Konica Minolta Inc. in the U.S. Orthopedic Imaging Modalities and Surgical Navigation Systems Market
- 6.2.5.3 Product Portfolio
- 6.2.5.4 Financials
- 6.2.5.5 Analyst Perspectives
- 6.2.6 Koninklijke Philips N.V.
- 6.2.6.1 Company Overview
- 6.2.6.2 Role of Koninklijke Philips N.V. in the U.S. Orthopedic Imaging Modalities and Surgical Navigation Systems Market
- 6.2.6.3 Product Portfolio
- 6.2.6.4 Financials
- 6.2.6.5 Recent Developments
- 6.2.6.6 Analyst Perception
- 6.2.7 Medtronic plc
- 6.2.7.1 Company Overview
- 6.2.7.2 Role of Medtronic plc in the U.S. Orthopedic Imaging Modalities and Surgical Navigation Systems Market
- 6.2.7.3 Product Portfolio
- 6.2.7.4 Financials
- 6.2.7.5 Recent Developments
- 6.2.7.6 Analyst Perception
- 6.2.8 OrthAlign, Inc.
- 6.2.8.1 Company Overview
- 6.2.8.2 Role of OrthAlign, Inc. in the U.S. Orthopedic Imaging Modalities and Surgical Navigation Systems Market
- 6.2.8.3 Product Portfolio
- 6.2.8.4 Recent Developments
- 6.2.8.5 Analyst Perception
- 6.2.9 Shimadzu Corporation
- 6.2.9.1 Company Overview
- 6.2.9.2 Role of Shimadzu Corporation in the U.S. Orthopedic Imaging Modalities and Surgical Navigation Systems Market
- 6.2.9.3 Product Portfolio
- 6.2.9.4 Financials
- 6.2.9.5 Recent Developments
- 6.2.9.6 Analyst Perception
- 6.2.10 Siemens Healthineers AG
- 6.2.10.1 Company Overview
- 6.2.10.2 Role of Siemens Healthineers AG in the U.S. Orthopedic Imaging Modalities and Surgical Navigation Systems Market
- 6.2.10.3 Product Portfolio
- 6.2.10.4 Financials
- 6.2.10.5 Recent Developments
- 6.2.10.6 Analyst Perspectives
- 6.2.11 Smith & Nephew plc
- 6.2.11.1 Company Overview
- 6.2.11.2 Role of Smith & Nephew plc in the U.S. Orthopedic Imaging Modalities and Surgical Navigation Systems Market
- 6.2.11.3 Product Portfolio
- 6.2.11.4 Financials
- 6.2.11.5 Analyst Perception
- 6.2.12 SonoScape Medical Corp.
- 6.2.12.1 Company Overview
- 6.2.12.2 Role of SonoScape Medical Corp. in the U.S. Orthopedic Imaging Modalities and Surgical Navigation Systems Market
- 6.2.12.3 Product Portfolio
- 6.2.12.4 Analyst Perception
- 6.2.13 Stryker Corporation
- 6.2.13.1 Company Overview
- 6.2.13.2 Role of Stryker Corporation in the U.S. Orthopedic Imaging Modalities and Surgical Navigation Systems Market
- 6.2.13.3 Product Portfolio
- 6.2.13.4 Financials
- 6.2.13.5 Analyst Perception
- 6.2.14 United Imaging Healthcare Co., Ltd.
- 6.2.14.1 Company Overview
- 6.2.14.2 Role of United Imaging Healthcare Co., Ltd. in the U.S. Orthopedic Imaging Modalities and Surgical Navigation Systems Market
- 6.2.14.3 Product Portfolio
- 6.2.14.4 Recent Developments
- 6.2.14.5 Analyst Perception
- 6.2.15 Zimmer Biomet Holdings, Inc.
- 6.2.15.1 Company Overview
- 6.2.15.2 Role of Zimmer Biomet Holdings, Inc. in the U.S. Orthopedic Imaging Modalities and Surgical Navigation Systems Market
- 6.2.15.3 Product Portfolio
- 6.2.15.4 Financials
- 6.2.15.5 Recent Developments
- 6.2.15.6 Analyst Perception
- 6.2.1 Canon Inc.