
|
市場調査レポート
商品コード
1414761
天然石市場:タイプ別、用途別、建設タイプ別:2023年~2032年の世界機会分析と産業予測Natural Stone Market By Type (Marble, Granite, Limestone, Others), By Application (Flooring, Memorial Arts, Wall Cladding, Others), By Construction Type (New construction, Renovation): Global Opportunity Analysis and Industry Forecast, 2023-2032 |
||||||
|
|||||||

| 天然石市場:タイプ別、用途別、建設タイプ別:2023年~2032年の世界機会分析と産業予測 |
|
出版日: 2023年11月30日
発行: Allied Market Research
ページ情報: 英文 269 Pages
納期: 2~3営業日
|

- 全表示
- 概要
- 図表
- 目次
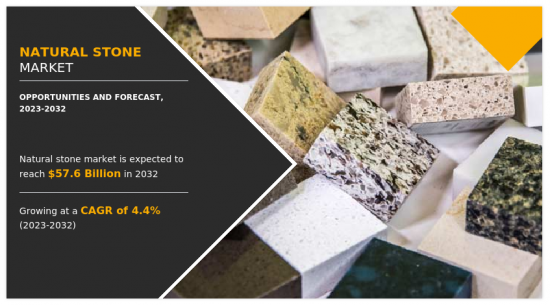
天然石市場は2020年に338億米ドルと評価され、2023年から2032年にかけてCAGR 4.4%で成長し、2032年には576億米ドルに達すると推定されます。
急速な都市化と、以下のような建築構造における屋内床材への天然石の採用の急増。
1 寺院、豪華な家屋、政府建築物、学校などの建築構造における屋内床材への天然石の採用急増が市場成長の原動力となっています。加えて、エクステリア・エンターテインメントエリアに対する意識の高まりや、家のリフォームにお金をかける傾向が、世界の天然石市場の成長を後押ししています。そのほか、世界の新築・改築活動に対する政府支出の増加が世界の天然石市場の成長を後押ししています。例えば、2021年8月、カナダ連邦政府は新しいインフラ開発を改善するために12年間で約1,800億米ドルの投資を計画しています。さらに、次のような発展途上国の人々の可処分所得の上昇もあります。
1 インド、ブラジル、アフリカ、その他の国々の人々の可処分所得の増加は、世界の天然石市場の成長を促進するリフォーム活動への支出の増加につながります。例えば、南アフリカの可処分所得は2020年から2022年にかけて1.5%以上の割合で成長しています。しかし、グリーンで環境に優しい素材の利用が重視されるようになったことが、市場成長の妨げとなっています。一方、アジア太平洋およびLAMEAの新興経済諸国は、これらの地域における住宅建設活動への投資の急増により、天然石生産者に有利な成長機会を提供し続けています。
天然石市場はタイプ、用途、建設タイプ、地域によって区分されます。タイプ別では、市場は大理石、花崗岩、石灰岩、その他に分類されます。2020年には花崗岩セグメントが市場を独占しています。用途別では、フローリング、メモリアルアート、ウォールクラッディング、その他に区分されます。2020年の市場シェアは、床材セグメントが大半を占めています。建設タイプ別では、市場は新築とリフォームに分類されます。リフォーム分野は調査期間中、最も高い成長率が見込まれています。地域別では、市場は北米、欧州、アジア太平洋、LAMEAで分析されます。2020年にはアジア太平洋地域が市場を独占しました。
世界市場で事業を展開する主要企業は、以下のような主要戦略を採用しています。
1 市場への働きかけを強化し、市場での厳しい競争を維持するための製品投入と製品開拓。
目次
第1章 イントロダクション
第2章 エグゼクティブサマリー
第3章 市場概要
- 市場の定義と範囲
- 主な調査結果
- 影響要因
- 主な投資機会
- ポーターのファイブフォース分析
- 市場力学
- 促進要因
- 住宅リフォームと改修への支出の増加
- 壁材エンドユーザーにおける屋外娯楽エリアの人気上昇
- 新興国における急速な都市化
- 建設セクターの成長
- 抑制要因
- 外貨の変動
- 機会
- インフラ部門における政府および民間投資の増加
- 促進要因
第4章 天然石市場:タイプ別
- 概要
- 大理石
- 花崗岩
- 石灰岩
- その他
第5章 天然石市場:用途別
- 概要
- 床材
- メモリアルアート
- 壁材
- その他
第6章 天然石市場:建設タイプ別
- 概要
- 新築
- リフォーム
第7章 天然石市場:地域別
- 概要
- 北米
- 米国
- カナダ
- メキシコ
- 欧州
- ドイツ
- フランス
- イタリア
- スペイン
- その他
- アジア太平洋
- 中国
- 日本
- インド
- 韓国
- その他
- ラテンアメリカ
- ラテンアメリカ
- 中東
- その他
第8章 競合情勢
- イントロダクション
- 主要成功戦略
- 主要10社の製品マッピング
- 競合ダッシュボード
- 競合ヒートマップ
- 主要企業の2020年ポジショニング
第9章 企業プロファイル
- Aro Granite Industries Ltd.
- Dimpomar
- Dermitzakis Bros S.A.
- Levantina Y Asociados de Minerales, S.A.
- MARGRAF
- Mumal Marbles Pvt. Ltd.
- Polycor Inc.
- Temmer Mermer Madencilik Insaat Sanayi ve Ticaret A.S.
- TOPALIDIS S.A.
- XISHI GROUP LTD.
LIST OF TABLES
- TABLE 01. GLOBAL NATURAL STONE MARKET, BY TYPE, 2020-2032 ($MILLION)
- TABLE 02. NATURAL STONE MARKET FOR MARBLE, BY REGION, 2020-2032 ($MILLION)
- TABLE 03. NATURAL STONE MARKET FOR GRANITE, BY REGION, 2020-2032 ($MILLION)
- TABLE 04. NATURAL STONE MARKET FOR LIMESTONE, BY REGION, 2020-2032 ($MILLION)
- TABLE 05. NATURAL STONE MARKET FOR OTHERS, BY REGION, 2020-2032 ($MILLION)
- TABLE 06. GLOBAL NATURAL STONE MARKET, BY APPLICATION, 2020-2032 ($MILLION)
- TABLE 07. NATURAL STONE MARKET FOR FLOORING, BY REGION, 2020-2032 ($MILLION)
- TABLE 08. NATURAL STONE MARKET FOR MEMORIAL ARTS, BY REGION, 2020-2032 ($MILLION)
- TABLE 09. NATURAL STONE MARKET FOR WALL CLADDING, BY REGION, 2020-2032 ($MILLION)
- TABLE 10. NATURAL STONE MARKET FOR OTHERS, BY REGION, 2020-2032 ($MILLION)
- TABLE 11. GLOBAL NATURAL STONE MARKET, BY CONSTRUCTION TYPE, 2020-2032 ($MILLION)
- TABLE 12. NATURAL STONE MARKET FOR NEW CONSTRUCTION, BY REGION, 2020-2032 ($MILLION)
- TABLE 13. NATURAL STONE MARKET FOR RENOVATION, BY REGION, 2020-2032 ($MILLION)
- TABLE 14. NATURAL STONE MARKET, BY REGION, 2020-2032 ($MILLION)
- TABLE 15. NORTH AMERICA NATURAL STONE MARKET, BY TYPE, 2020-2032 ($MILLION)
- TABLE 16. NORTH AMERICA NATURAL STONE MARKET, BY APPLICATION, 2020-2032 ($MILLION)
- TABLE 17. NORTH AMERICA NATURAL STONE MARKET, BY CONSTRUCTION TYPE, 2020-2032 ($MILLION)
- TABLE 18. NORTH AMERICA NATURAL STONE MARKET, BY COUNTRY, 2020-2032 ($MILLION)
- TABLE 19. U.S. NATURAL STONE MARKET, BY TYPE, 2020-2032 ($MILLION)
- TABLE 20. U.S. NATURAL STONE MARKET, BY APPLICATION, 2020-2032 ($MILLION)
- TABLE 21. U.S. NATURAL STONE MARKET, BY CONSTRUCTION TYPE, 2020-2032 ($MILLION)
- TABLE 22. CANADA NATURAL STONE MARKET, BY TYPE, 2020-2032 ($MILLION)
- TABLE 23. CANADA NATURAL STONE MARKET, BY APPLICATION, 2020-2032 ($MILLION)
- TABLE 24. CANADA NATURAL STONE MARKET, BY CONSTRUCTION TYPE, 2020-2032 ($MILLION)
- TABLE 25. MEXICO NATURAL STONE MARKET, BY TYPE, 2020-2032 ($MILLION)
- TABLE 26. MEXICO NATURAL STONE MARKET, BY APPLICATION, 2020-2032 ($MILLION)
- TABLE 27. MEXICO NATURAL STONE MARKET, BY CONSTRUCTION TYPE, 2020-2032 ($MILLION)
- TABLE 28. EUROPE NATURAL STONE MARKET, BY TYPE, 2020-2032 ($MILLION)
- TABLE 29. EUROPE NATURAL STONE MARKET, BY APPLICATION, 2020-2032 ($MILLION)
- TABLE 30. EUROPE NATURAL STONE MARKET, BY CONSTRUCTION TYPE, 2020-2032 ($MILLION)
- TABLE 31. EUROPE NATURAL STONE MARKET, BY COUNTRY, 2020-2032 ($MILLION)
- TABLE 32. GERMANY NATURAL STONE MARKET, BY TYPE, 2020-2032 ($MILLION)
- TABLE 33. GERMANY NATURAL STONE MARKET, BY APPLICATION, 2020-2032 ($MILLION)
- TABLE 34. GERMANY NATURAL STONE MARKET, BY CONSTRUCTION TYPE, 2020-2032 ($MILLION)
- TABLE 35. FRANCE NATURAL STONE MARKET, BY TYPE, 2020-2032 ($MILLION)
- TABLE 36. FRANCE NATURAL STONE MARKET, BY APPLICATION, 2020-2032 ($MILLION)
- TABLE 37. FRANCE NATURAL STONE MARKET, BY CONSTRUCTION TYPE, 2020-2032 ($MILLION)
- TABLE 38. ITALY NATURAL STONE MARKET, BY TYPE, 2020-2032 ($MILLION)
- TABLE 39. ITALY NATURAL STONE MARKET, BY APPLICATION, 2020-2032 ($MILLION)
- TABLE 40. ITALY NATURAL STONE MARKET, BY CONSTRUCTION TYPE, 2020-2032 ($MILLION)
- TABLE 41. SPAIN NATURAL STONE MARKET, BY TYPE, 2020-2032 ($MILLION)
- TABLE 42. SPAIN NATURAL STONE MARKET, BY APPLICATION, 2020-2032 ($MILLION)
- TABLE 43. SPAIN NATURAL STONE MARKET, BY CONSTRUCTION TYPE, 2020-2032 ($MILLION)
- TABLE 44. REST OF EUROPE NATURAL STONE MARKET, BY TYPE, 2020-2032 ($MILLION)
- TABLE 45. REST OF EUROPE NATURAL STONE MARKET, BY APPLICATION, 2020-2032 ($MILLION)
- TABLE 46. REST OF EUROPE NATURAL STONE MARKET, BY CONSTRUCTION TYPE, 2020-2032 ($MILLION)
- TABLE 47. ASIA-PACIFIC NATURAL STONE MARKET, BY TYPE, 2020-2032 ($MILLION)
- TABLE 48. ASIA-PACIFIC NATURAL STONE MARKET, BY APPLICATION, 2020-2032 ($MILLION)
- TABLE 49. ASIA-PACIFIC NATURAL STONE MARKET, BY CONSTRUCTION TYPE, 2020-2032 ($MILLION)
- TABLE 50. ASIA-PACIFIC NATURAL STONE MARKET, BY COUNTRY, 2020-2032 ($MILLION)
- TABLE 51. CHINA NATURAL STONE MARKET, BY TYPE, 2020-2032 ($MILLION)
- TABLE 52. CHINA NATURAL STONE MARKET, BY APPLICATION, 2020-2032 ($MILLION)
- TABLE 53. CHINA NATURAL STONE MARKET, BY CONSTRUCTION TYPE, 2020-2032 ($MILLION)
- TABLE 54. JAPAN NATURAL STONE MARKET, BY TYPE, 2020-2032 ($MILLION)
- TABLE 55. JAPAN NATURAL STONE MARKET, BY APPLICATION, 2020-2032 ($MILLION)
- TABLE 56. JAPAN NATURAL STONE MARKET, BY CONSTRUCTION TYPE, 2020-2032 ($MILLION)
- TABLE 57. INDIA NATURAL STONE MARKET, BY TYPE, 2020-2032 ($MILLION)
- TABLE 58. INDIA NATURAL STONE MARKET, BY APPLICATION, 2020-2032 ($MILLION)
- TABLE 59. INDIA NATURAL STONE MARKET, BY CONSTRUCTION TYPE, 2020-2032 ($MILLION)
- TABLE 60. SOUTH KOREA NATURAL STONE MARKET, BY TYPE, 2020-2032 ($MILLION)
- TABLE 61. SOUTH KOREA NATURAL STONE MARKET, BY APPLICATION, 2020-2032 ($MILLION)
- TABLE 62. SOUTH KOREA NATURAL STONE MARKET, BY CONSTRUCTION TYPE, 2020-2032 ($MILLION)
- TABLE 63. REST OF ASIA-PACIFIC NATURAL STONE MARKET, BY TYPE, 2020-2032 ($MILLION)
- TABLE 64. REST OF ASIA-PACIFIC NATURAL STONE MARKET, BY APPLICATION, 2020-2032 ($MILLION)
- TABLE 65. REST OF ASIA-PACIFIC NATURAL STONE MARKET, BY CONSTRUCTION TYPE, 2020-2032 ($MILLION)
- TABLE 66. LAMEA NATURAL STONE MARKET, BY TYPE, 2020-2032 ($MILLION)
- TABLE 67. LAMEA NATURAL STONE MARKET, BY APPLICATION, 2020-2032 ($MILLION)
- TABLE 68. LAMEA NATURAL STONE MARKET, BY CONSTRUCTION TYPE, 2020-2032 ($MILLION)
- TABLE 69. LAMEA NATURAL STONE MARKET, BY COUNTRY, 2020-2032 ($MILLION)
- TABLE 70. LATIN AMERICA NATURAL STONE MARKET, BY TYPE, 2020-2032 ($MILLION)
- TABLE 71. LATIN AMERICA NATURAL STONE MARKET, BY APPLICATION, 2020-2032 ($MILLION)
- TABLE 72. LATIN AMERICA NATURAL STONE MARKET, BY CONSTRUCTION TYPE, 2020-2032 ($MILLION)
- TABLE 73. MIDDLE EAST NATURAL STONE MARKET, BY TYPE, 2020-2032 ($MILLION)
- TABLE 74. MIDDLE EAST NATURAL STONE MARKET, BY APPLICATION, 2020-2032 ($MILLION)
- TABLE 75. MIDDLE EAST NATURAL STONE MARKET, BY CONSTRUCTION TYPE, 2020-2032 ($MILLION)
- TABLE 76. REST OF ASIA-PACIFIC NATURAL STONE MARKET, BY TYPE, 2020-2032 ($MILLION)
- TABLE 77. REST OF ASIA-PACIFIC NATURAL STONE MARKET, BY APPLICATION, 2020-2032 ($MILLION)
- TABLE 78. REST OF ASIA-PACIFIC NATURAL STONE MARKET, BY CONSTRUCTION TYPE, 2020-2032 ($MILLION)
- TABLE 79. ARO GRANITE INDUSTRIES LTD.: KEY EXECUTIVES
- TABLE 80. ARO GRANITE INDUSTRIES LTD.: COMPANY SNAPSHOT
- TABLE 81. ARO GRANITE INDUSTRIES LTD.: PRODUCT SEGMENTS
- TABLE 82. ARO GRANITE INDUSTRIES LTD.: PRODUCT PORTFOLIO
- TABLE 83. DIMPOMAR: KEY EXECUTIVES
- TABLE 84. DIMPOMAR: COMPANY SNAPSHOT
- TABLE 85. DIMPOMAR: PRODUCT SEGMENTS
- TABLE 86. DIMPOMAR: PRODUCT PORTFOLIO
- TABLE 87. DERMITZAKIS BROS S.A.: KEY EXECUTIVES
- TABLE 88. DERMITZAKIS BROS S.A.: COMPANY SNAPSHOT
- TABLE 89. DERMITZAKIS BROS S.A.: PRODUCT SEGMENTS
- TABLE 90. DERMITZAKIS BROS S.A.: PRODUCT PORTFOLIO
- TABLE 91. LEVANTINA Y ASOCIADOS DE MINERALES, S.A.: KEY EXECUTIVES
- TABLE 92. LEVANTINA Y ASOCIADOS DE MINERALES, S.A.: COMPANY SNAPSHOT
- TABLE 93. LEVANTINA Y ASOCIADOS DE MINERALES, S.A.: PRODUCT SEGMENTS
- TABLE 94. LEVANTINA Y ASOCIADOS DE MINERALES, S.A.: PRODUCT PORTFOLIO
- TABLE 95. MARGRAF: KEY EXECUTIVES
- TABLE 96. MARGRAF: COMPANY SNAPSHOT
- TABLE 97. MARGRAF: PRODUCT SEGMENTS
- TABLE 98. MARGRAF: PRODUCT PORTFOLIO
- TABLE 99. MUMAL MARBLES PVT. LTD.: KEY EXECUTIVES
- TABLE 100. MUMAL MARBLES PVT. LTD.: COMPANY SNAPSHOT
- TABLE 101. MUMAL MARBLES PVT. LTD.: PRODUCT SEGMENTS
- TABLE 102. MUMAL MARBLES PVT. LTD.: PRODUCT PORTFOLIO
- TABLE 103. POLYCOR INC.: KEY EXECUTIVES
- TABLE 104. POLYCOR INC.: COMPANY SNAPSHOT
- TABLE 105. POLYCOR INC.: PRODUCT SEGMENTS
- TABLE 106. POLYCOR INC.: PRODUCT PORTFOLIO
- TABLE 107. POLYCOR INC.: KEY STRATERGIES
- TABLE 108. TEMMER MERMER MADENCILIK INSAAT SANAYI VE TICARET A.S.: KEY EXECUTIVES
- TABLE 109. TEMMER MERMER MADENCILIK INSAAT SANAYI VE TICARET A.S.: COMPANY SNAPSHOT
- TABLE 110. TEMMER MERMER MADENCILIK INSAAT SANAYI VE TICARET A.S.: PRODUCT SEGMENTS
- TABLE 111. TEMMER MERMER MADENCILIK INSAAT SANAYI VE TICARET A.S.: PRODUCT PORTFOLIO
- TABLE 112. TOPALIDIS S.A.: KEY EXECUTIVES
- TABLE 113. TOPALIDIS S.A.: COMPANY SNAPSHOT
- TABLE 114. TOPALIDIS S.A.: PRODUCT SEGMENTS
- TABLE 115. TOPALIDIS S.A.: PRODUCT PORTFOLIO
- TABLE 116. XISHI GROUP LTD.: KEY EXECUTIVES
- TABLE 117. XISHI GROUP LTD.: COMPANY SNAPSHOT
- TABLE 118. XISHI GROUP LTD.: PRODUCT SEGMENTS
- TABLE 119. XISHI GROUP LTD.: PRODUCT PORTFOLIO
LIST OF FIGURES
- FIGURE 01. NATURAL STONE MARKET, 2020-2032
- FIGURE 02. SEGMENTATION OF NATURAL STONE MARKET,2020-2032
- FIGURE 03. TOP IMPACTING FACTORS IN NATURAL STONE MARKET (2022 TO 2032)
- FIGURE 04. TOP INVESTMENT POCKETS IN NATURAL STONE MARKET (2023-2032)
- FIGURE 05. LOW BARGAINING POWER OF SUPPLIERS
- FIGURE 06. LOW THREAT OF NEW ENTRANTS
- FIGURE 07. LOW THREAT OF SUBSTITUTES
- FIGURE 08. LOW INTENSITY OF RIVALRY
- FIGURE 09. LOW BARGAINING POWER OF BUYERS
- FIGURE 10. GLOBAL NATURAL STONE MARKET:DRIVERS, RESTRAINTS AND OPPORTUNITIES
- FIGURE 11. NATURAL STONE MARKET, BY TYPE, 2020 AND 2032(%)
- FIGURE 12. COMPARATIVE SHARE ANALYSIS OF NATURAL STONE MARKET FOR MARBLE, BY COUNTRY 2020 AND 2032(%)
- FIGURE 13. COMPARATIVE SHARE ANALYSIS OF NATURAL STONE MARKET FOR GRANITE, BY COUNTRY 2020 AND 2032(%)
- FIGURE 14. COMPARATIVE SHARE ANALYSIS OF NATURAL STONE MARKET FOR LIMESTONE, BY COUNTRY 2020 AND 2032(%)
- FIGURE 15. COMPARATIVE SHARE ANALYSIS OF NATURAL STONE MARKET FOR OTHERS, BY COUNTRY 2020 AND 2032(%)
- FIGURE 16. NATURAL STONE MARKET, BY APPLICATION, 2020 AND 2032(%)
- FIGURE 17. COMPARATIVE SHARE ANALYSIS OF NATURAL STONE MARKET FOR FLOORING, BY COUNTRY 2020 AND 2032(%)
- FIGURE 18. COMPARATIVE SHARE ANALYSIS OF NATURAL STONE MARKET FOR MEMORIAL ARTS, BY COUNTRY 2020 AND 2032(%)
- FIGURE 19. COMPARATIVE SHARE ANALYSIS OF NATURAL STONE MARKET FOR WALL CLADDING, BY COUNTRY 2020 AND 2032(%)
- FIGURE 20. COMPARATIVE SHARE ANALYSIS OF NATURAL STONE MARKET FOR OTHERS, BY COUNTRY 2020 AND 2032(%)
- FIGURE 21. NATURAL STONE MARKET, BY CONSTRUCTION TYPE, 2020 AND 2032(%)
- FIGURE 22. COMPARATIVE SHARE ANALYSIS OF NATURAL STONE MARKET FOR NEW CONSTRUCTION, BY COUNTRY 2020 AND 2032(%)
- FIGURE 23. COMPARATIVE SHARE ANALYSIS OF NATURAL STONE MARKET FOR RENOVATION, BY COUNTRY 2020 AND 2032(%)
- FIGURE 24. NATURAL STONE MARKET BY REGION, 2020 AND 2032(%)
- FIGURE 25. U.S. NATURAL STONE MARKET, 2020-2032 ($MILLION)
- FIGURE 26. CANADA NATURAL STONE MARKET, 2020-2032 ($MILLION)
- FIGURE 27. MEXICO NATURAL STONE MARKET, 2020-2032 ($MILLION)
- FIGURE 28. GERMANY NATURAL STONE MARKET, 2020-2032 ($MILLION)
- FIGURE 29. FRANCE NATURAL STONE MARKET, 2020-2032 ($MILLION)
- FIGURE 30. ITALY NATURAL STONE MARKET, 2020-2032 ($MILLION)
- FIGURE 31. SPAIN NATURAL STONE MARKET, 2020-2032 ($MILLION)
- FIGURE 32. REST OF EUROPE NATURAL STONE MARKET, 2020-2032 ($MILLION)
- FIGURE 33. CHINA NATURAL STONE MARKET, 2020-2032 ($MILLION)
- FIGURE 34. JAPAN NATURAL STONE MARKET, 2020-2032 ($MILLION)
- FIGURE 35. INDIA NATURAL STONE MARKET, 2020-2032 ($MILLION)
- FIGURE 36. SOUTH KOREA NATURAL STONE MARKET, 2020-2032 ($MILLION)
- FIGURE 37. REST OF ASIA-PACIFIC NATURAL STONE MARKET, 2020-2032 ($MILLION)
- FIGURE 38. LATIN AMERICA NATURAL STONE MARKET, 2020-2032 ($MILLION)
- FIGURE 39. MIDDLE EAST NATURAL STONE MARKET, 2020-2032 ($MILLION)
- FIGURE 40. REST OF ASIA-PACIFIC NATURAL STONE MARKET, 2020-2032 ($MILLION)
- FIGURE 41. TOP WINNING STRATEGIES, BY YEAR (2021)
- FIGURE 42. TOP WINNING STRATEGIES, BY DEVELOPMENT (2021)
- FIGURE 43. TOP WINNING STRATEGIES, BY COMPANY (2021)
- FIGURE 44. PRODUCT MAPPING OF TOP 10 PLAYERS
- FIGURE 45. COMPETITIVE DASHBOARD
- FIGURE 46. COMPETITIVE HEATMAP: NATURAL STONE MARKET
- FIGURE 47. TOP PLAYER POSITIONING, 2020
- FIGURE 48. ARO GRANITE INDUSTRIES LTD.: NET REVENUE, 2021-2023 ($MILLION)
- FIGURE 49. ARO GRANITE INDUSTRIES LTD.: REVENUE SHARE BY SEGMENT, 2023 (%)
- FIGURE 50. ARO GRANITE INDUSTRIES LTD.: REVENUE SHARE BY REGION, 2023 (%)
According to a new report published by Allied Market Research, titled, "Natural Stone Market," The natural stone market was valued at $33.8 billion in 2020, and is estimated to reach $57.6 billion by 2032, growing at a CAGR of 4.4% from 2023 to 2032.
Rapid urbanization and surge in adoption of natural stones for indoor flooring in building structures such as temples, luxurious houses, government buildings, and schools drive the growth of the market. In addition, rise in consciousness toward exterior entertainment area and propensity to spend on home remodeling boost the growth of the global natural stone market. Besides, rise in government spending on new construction and renovation activities globally fuels the growth of the global natural stone market. For instance, in August 2021, the Federal Government of Canada planned to invest around $180 billion for a 12-year period to improve the new infrastructure development. Moreover, the rise in disposable income of people in developing countries such as India, Brazil, Africa, and others, leads to increased spending on renovation activities, which drive the growth of the global natural stone market. For instance, the disposable income of South Africa is growing at a rate of over 1.5% from 2020 to 2022. However, an increase in emphasis on the utilization of green and eco-friendly materials hamper the market growth. On the other hand, developing economies in Asia-Pacific and LAMEA continue to offer lucrative growth opportunities for natural stone producers, due to a surge in investments in residential construction activities in these regions.
The natural stone market is segmented on the basis of type, application, construction type, and region. By type, the market is categorized into marble, granite, limestone, and others. The granite segment dominated the market in 2020. On the basis of application, it is segmented into flooring, memorial arts, wall cladding, and others. The flooring segment accounted for a major market share in 2020. As per construction type, the market is categorized into new construction and renovation. The renovation segment is expected to grow at the highest rate during the study period. Region-wise, the market is analyzed across North America, Europe, Asia-Pacific, and LAMEA. Asia-Pacific region dominated the market in 2020.
The major players that operate in the global market have adopted key strategies such as product launches and product development to strengthen their market outreach and sustain the stiff competition in the market.
Competition Analysis
The key players profiled in the natural stone market report include Aro Granite Industries Ltd., Dimpomar, Dermitzakis Bros S.A., Levantina y Asociados de Minerales, S.A., MARGRAF, Mumal Marble, Polycor Inc., Temmer Marble, Topalidis, and Xishi Stone Group.
Key Benefits For Stakeholders
- This report provides a quantitative analysis of the market segments, current trends, estimations, and dynamics of the natural stone market analysis from 2020 to 2032 to identify the prevailing natural stone market opportunities.
- The market research is offered along with information related to key drivers, restraints, and opportunities.
- Porter's five forces analysis highlights the potency of buyers and suppliers to enable stakeholders make profit-oriented business decisions and strengthen their supplier-buyer network.
- In-depth analysis of the natural stone market segmentation assists to determine the prevailing market opportunities.
- Major countries in each region are mapped according to their revenue contribution to the global market.
- Market player positioning facilitates benchmarking and provides a clear understanding of the present position of the market players.
- The report includes the analysis of the regional as well as global natural stone market trends, key players, market segments, application areas, and market growth strategies.
Additional benefits you will get with this purchase are:
- Quarterly Update and* (only available with a corporate license, on listed price)
- 5 additional Company Profile of client Choice pre- or Post-purchase, as a free update.
- Free Upcoming Version on the Purchase of Five and Enterprise User License.
- 16 analyst hours of support* (post-purchase, if you find additional data requirements upon review of the report, you may receive support amounting to 16 analyst hours to solve questions, and post-sale queries)
- 15% Free Customization* (in case the scope or segment of the report does not match your requirements, 15% is equivalent to 3 working days of free work, applicable once)
- Free data Pack on the Five and Enterprise User License. (Excel version of the report)
- Free Updated report if the report is 6-12 months old or older.
- 24-hour priority response*
- Free Industry updates and white papers.
Possible Customization with this report (with additional cost and timeline, please talk to the sales executive to know more)
- Installed Base analysis
- Product Life Cycles
- Go To Market Strategy
- Market share analysis of players by products/segments
- New Product Development/ Product Matrix of Key Players
- Additional company profiles with specific to client's interest
- Additional country or region analysis- market size and forecast
- Average Selling Price Analysis / Price Point Analysis
- Brands Share Analysis
- Criss-cross segment analysis- market size and forecast
- Expanded list for Company Profiles
- Historic market data
- Import Export Analysis/Data
- Key player details (including location, contact details, supplier/vendor network etc. in excel format)
- List of customers/consumers/raw material suppliers- value chain analysis
- Market share analysis of players at global/region/country level
- Per Capita Consumption Trends
- Product Consumption Analysis
- Reimbursement Scenario
- SWOT Analysis
- Volume Market Size and Forecast
Key Market Segments
By Type
- Marble
- Granite
- Limestone
- Others
By Application
- Flooring
- Memorial Arts
- Wall Cladding
- Others
By Construction Type
- New construction
- Renovation
By Region
- North America
- U.S.
- Canada
- Mexico
- Europe
- Germany
- France
- Italy
- Spain
- Rest of Europe
- Asia-Pacific
- China
- Japan
- India
- South Korea
- Rest of Asia-Pacific
- LAMEA
- Latin America
- Middle East
- Rest of Asia-Pacific
Key Market Players:
- Aro Granite Industries Ltd.
- Polycor Inc.
- Dimpomar
- Dermitzakis Bros S.A.
- Mumal Marbles Pvt. Ltd.
- TOPALIDIS S.A.
- XISHI GROUP LTD.
- Levantina Y Asociados de Minerales, S.A.
- MARGRAF
- Temmer Mermer Madencilik ?n?aat Sanayi ve Ticaret A.?.
TABLE OF CONTENTS
CHAPTER 1: INTRODUCTION
- 1.1. Report description
- 1.2. Key market segments
- 1.3. Key benefits to the stakeholders
- 1.4. Research methodology
- 1.4.1. Primary research
- 1.4.2. Secondary research
- 1.4.3. Analyst tools and models
CHAPTER 2: EXECUTIVE SUMMARY
- 2.1. CXO Perspective
CHAPTER 3: MARKET OVERVIEW
- 3.1. Market definition and scope
- 3.2. Key findings
- 3.2.1. Top impacting factors
- 3.2.2. Top investment pockets
- 3.3. Porter's five forces analysis
- 3.3.1. Low bargaining power of suppliers
- 3.3.2. Low threat of new entrants
- 3.3.3. Low threat of substitutes
- 3.3.4. Low intensity of rivalry
- 3.3.5. Low bargaining power of buyers
- 3.4. Market dynamics
- 3.4.1. Drivers
- 3.4.1.1. Increase in spending on home remodeling and retrofitting activities
- 3.4.1.2. Rise in popularity of outdoor entertaining area among wall cladding end-users
- 3.4.1.3. Rapid urbanization in emerging economies
- 3.4.1.4. Growth in construction sector
- 3.4.2. Restraints
- 3.4.2.1. Fluctuations in foreign currencies
- 3.4.3. Opportunities
- 3.4.3.1. Increase in government and private investments in the infrastructure sector
- 3.4.1. Drivers
CHAPTER 4: NATURAL STONE MARKET, BY TYPE
- 4.1. Overview
- 4.1.1. Market size and forecast
- 4.2. Marble
- 4.2.1. Key market trends, growth factors and opportunities
- 4.2.2. Market size and forecast, by region
- 4.2.3. Market share analysis by country
- 4.3. Granite
- 4.3.1. Key market trends, growth factors and opportunities
- 4.3.2. Market size and forecast, by region
- 4.3.3. Market share analysis by country
- 4.4. Limestone
- 4.4.1. Key market trends, growth factors and opportunities
- 4.4.2. Market size and forecast, by region
- 4.4.3. Market share analysis by country
- 4.5. Others
- 4.5.1. Key market trends, growth factors and opportunities
- 4.5.2. Market size and forecast, by region
- 4.5.3. Market share analysis by country
CHAPTER 5: NATURAL STONE MARKET, BY APPLICATION
- 5.1. Overview
- 5.1.1. Market size and forecast
- 5.2. Flooring
- 5.2.1. Key market trends, growth factors and opportunities
- 5.2.2. Market size and forecast, by region
- 5.2.3. Market share analysis by country
- 5.3. Memorial Arts
- 5.3.1. Key market trends, growth factors and opportunities
- 5.3.2. Market size and forecast, by region
- 5.3.3. Market share analysis by country
- 5.4. Wall Cladding
- 5.4.1. Key market trends, growth factors and opportunities
- 5.4.2. Market size and forecast, by region
- 5.4.3. Market share analysis by country
- 5.5. Others
- 5.5.1. Key market trends, growth factors and opportunities
- 5.5.2. Market size and forecast, by region
- 5.5.3. Market share analysis by country
CHAPTER 6: NATURAL STONE MARKET, BY CONSTRUCTION TYPE
- 6.1. Overview
- 6.1.1. Market size and forecast
- 6.2. New construction
- 6.2.1. Key market trends, growth factors and opportunities
- 6.2.2. Market size and forecast, by region
- 6.2.3. Market share analysis by country
- 6.3. Renovation
- 6.3.1. Key market trends, growth factors and opportunities
- 6.3.2. Market size and forecast, by region
- 6.3.3. Market share analysis by country
CHAPTER 7: NATURAL STONE MARKET, BY REGION
- 7.1. Overview
- 7.1.1. Market size and forecast By Region
- 7.2. North America
- 7.2.1. Key market trends, growth factors and opportunities
- 7.2.2. Market size and forecast, by Type
- 7.2.3. Market size and forecast, by Application
- 7.2.4. Market size and forecast, by Construction Type
- 7.2.5. Market size and forecast, by country
- 7.2.5.1. U.S.
- 7.2.5.1.1. Market size and forecast, by Type
- 7.2.5.1.2. Market size and forecast, by Application
- 7.2.5.1.3. Market size and forecast, by Construction Type
- 7.2.5.2. Canada
- 7.2.5.2.1. Market size and forecast, by Type
- 7.2.5.2.2. Market size and forecast, by Application
- 7.2.5.2.3. Market size and forecast, by Construction Type
- 7.2.5.3. Mexico
- 7.2.5.3.1. Market size and forecast, by Type
- 7.2.5.3.2. Market size and forecast, by Application
- 7.2.5.3.3. Market size and forecast, by Construction Type
- 7.3. Europe
- 7.3.1. Key market trends, growth factors and opportunities
- 7.3.2. Market size and forecast, by Type
- 7.3.3. Market size and forecast, by Application
- 7.3.4. Market size and forecast, by Construction Type
- 7.3.5. Market size and forecast, by country
- 7.3.5.1. Germany
- 7.3.5.1.1. Market size and forecast, by Type
- 7.3.5.1.2. Market size and forecast, by Application
- 7.3.5.1.3. Market size and forecast, by Construction Type
- 7.3.5.2. France
- 7.3.5.2.1. Market size and forecast, by Type
- 7.3.5.2.2. Market size and forecast, by Application
- 7.3.5.2.3. Market size and forecast, by Construction Type
- 7.3.5.3. Italy
- 7.3.5.3.1. Market size and forecast, by Type
- 7.3.5.3.2. Market size and forecast, by Application
- 7.3.5.3.3. Market size and forecast, by Construction Type
- 7.3.5.4. Spain
- 7.3.5.4.1. Market size and forecast, by Type
- 7.3.5.4.2. Market size and forecast, by Application
- 7.3.5.4.3. Market size and forecast, by Construction Type
- 7.3.5.5. Rest of Europe
- 7.3.5.5.1. Market size and forecast, by Type
- 7.3.5.5.2. Market size and forecast, by Application
- 7.3.5.5.3. Market size and forecast, by Construction Type
- 7.4. Asia-Pacific
- 7.4.1. Key market trends, growth factors and opportunities
- 7.4.2. Market size and forecast, by Type
- 7.4.3. Market size and forecast, by Application
- 7.4.4. Market size and forecast, by Construction Type
- 7.4.5. Market size and forecast, by country
- 7.4.5.1. China
- 7.4.5.1.1. Market size and forecast, by Type
- 7.4.5.1.2. Market size and forecast, by Application
- 7.4.5.1.3. Market size and forecast, by Construction Type
- 7.4.5.2. Japan
- 7.4.5.2.1. Market size and forecast, by Type
- 7.4.5.2.2. Market size and forecast, by Application
- 7.4.5.2.3. Market size and forecast, by Construction Type
- 7.4.5.3. India
- 7.4.5.3.1. Market size and forecast, by Type
- 7.4.5.3.2. Market size and forecast, by Application
- 7.4.5.3.3. Market size and forecast, by Construction Type
- 7.4.5.4. South Korea
- 7.4.5.4.1. Market size and forecast, by Type
- 7.4.5.4.2. Market size and forecast, by Application
- 7.4.5.4.3. Market size and forecast, by Construction Type
- 7.4.5.5. Rest of Asia-Pacific
- 7.4.5.5.1. Market size and forecast, by Type
- 7.4.5.5.2. Market size and forecast, by Application
- 7.4.5.5.3. Market size and forecast, by Construction Type
- 7.5. LAMEA
- 7.5.1. Key market trends, growth factors and opportunities
- 7.5.2. Market size and forecast, by Type
- 7.5.3. Market size and forecast, by Application
- 7.5.4. Market size and forecast, by Construction Type
- 7.5.5. Market size and forecast, by country
- 7.5.5.1. Latin America
- 7.5.5.1.1. Market size and forecast, by Type
- 7.5.5.1.2. Market size and forecast, by Application
- 7.5.5.1.3. Market size and forecast, by Construction Type
- 7.5.5.2. Middle East
- 7.5.5.2.1. Market size and forecast, by Type
- 7.5.5.2.2. Market size and forecast, by Application
- 7.5.5.2.3. Market size and forecast, by Construction Type
- 7.5.5.3. Rest of Asia-Pacific
- 7.5.5.3.1. Market size and forecast, by Type
- 7.5.5.3.2. Market size and forecast, by Application
- 7.5.5.3.3. Market size and forecast, by Construction Type
CHAPTER 8: COMPETITIVE LANDSCAPE
- 8.1. Introduction
- 8.2. Top winning strategies
- 8.3. Product mapping of top 10 player
- 8.4. Competitive dashboard
- 8.5. Competitive heatmap
- 8.6. Top player positioning, 2020
CHAPTER 9: COMPANY PROFILES
- 9.1. Aro Granite Industries Ltd.
- 9.1.1. Company overview
- 9.1.2. Key executives
- 9.1.3. Company snapshot
- 9.1.4. Operating business segments
- 9.1.5. Product portfolio
- 9.1.6. Business performance
- 9.2. Dimpomar
- 9.2.1. Company overview
- 9.2.2. Key executives
- 9.2.3. Company snapshot
- 9.2.4. Operating business segments
- 9.2.5. Product portfolio
- 9.3. Dermitzakis Bros S.A.
- 9.3.1. Company overview
- 9.3.2. Key executives
- 9.3.3. Company snapshot
- 9.3.4. Operating business segments
- 9.3.5. Product portfolio
- 9.4. Levantina Y Asociados de Minerales, S.A.
- 9.4.1. Company overview
- 9.4.2. Key executives
- 9.4.3. Company snapshot
- 9.4.4. Operating business segments
- 9.4.5. Product portfolio
- 9.5. MARGRAF
- 9.5.1. Company overview
- 9.5.2. Key executives
- 9.5.3. Company snapshot
- 9.5.4. Operating business segments
- 9.5.5. Product portfolio
- 9.6. Mumal Marbles Pvt. Ltd.
- 9.6.1. Company overview
- 9.6.2. Key executives
- 9.6.3. Company snapshot
- 9.6.4. Operating business segments
- 9.6.5. Product portfolio
- 9.7. Polycor Inc.
- 9.7.1. Company overview
- 9.7.2. Key executives
- 9.7.3. Company snapshot
- 9.7.4. Operating business segments
- 9.7.5. Product portfolio
- 9.7.6. Key strategic moves and developments
- 9.8. Temmer Mermer Madencilik Insaat Sanayi ve Ticaret A.S.
- 9.8.1. Company overview
- 9.8.2. Key executives
- 9.8.3. Company snapshot
- 9.8.4. Operating business segments
- 9.8.5. Product portfolio
- 9.9. TOPALIDIS S.A.
- 9.9.1. Company overview
- 9.9.2. Key executives
- 9.9.3. Company snapshot
- 9.9.4. Operating business segments
- 9.9.5. Product portfolio
- 9.10. XISHI GROUP LTD.
- 9.10.1. Company overview
- 9.10.2. Key executives
- 9.10.3. Company snapshot
- 9.10.4. Operating business segments
- 9.10.5. Product portfolio
