|
|
市場調査レポート
商品コード
1708113
放射性医薬品:各種技術と世界市場Radiopharmaceuticals: Technologies and Global Markets |
||||||

|
|||||||
|
|||||||

| 放射性医薬品:各種技術と世界市場 |
|
出版日: 2025年04月10日
発行: BCC Research
ページ情報: 英文 163 Pages
納期: 即納可能
|

全表示
- 概要
- 図表
- 目次
世界の放射性医薬品の市場規模は、2024年の103億米ドルから、予測期間中はCAGR16.4%で推移し、2029年末には219億米ドルに達すると予測されています。
北米市場は、2024年の49億米ドルから、予測期間中は18.5%のCAGRで推移し、2029年末には115億米ドルに達すると予測されています。欧州市場は、2024年の23億米ドルから、CAGR 16.4%で推移し、2029年末には49億米ドルに達すると予測されています。
当レポートでは、世界の放射性医薬品の市場を調査し、市場概要、市場影響因子および市場機会の分析、法規制環境、新興技術および技術開発の動向、市場規模の推移・予測、各種区分・地域別の詳細分析、競合情勢、主要企業のプロファイルなどをまとめています。
目次
第1章 エグゼクティブサマリー
- 市場見通し
- 調査範囲
- 市場サマリー
第2章 市場概要
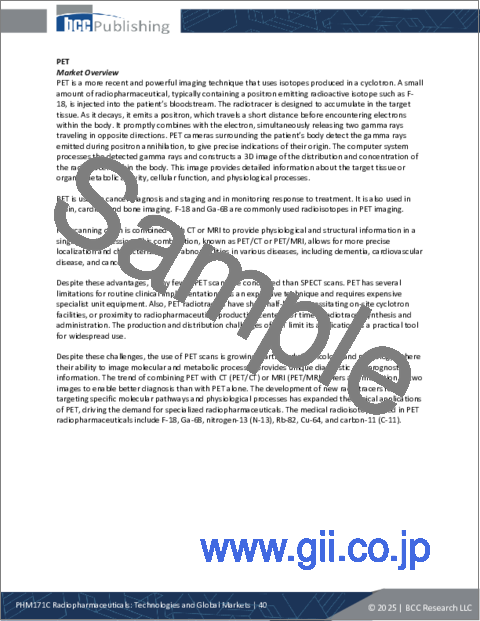
- 放射性医薬品の概要
- 放射性医薬品の調製
- マクロ経済要因分析
- ポーターのファイブフォース分析
第3章 市場力学
- 市場促進要因
- 癌やその他の慢性疾患の罹患率の上昇
- 腫瘍における未充足ニーズ
- 精密医療
- 核イメージング技術
- 投資の増加
- 市場抑制要因
- 製造およびサプライチェーンの問題
- インフラと特殊な画像機器要件
- 熟練した専門家の不足
- 市場動向
- セラノスティクス
- 地域の多様化とサプライチェーンのレジリエンス
- 機会
- 放射性医薬品の契約製造
- ADにおけるPET画像
第4章 規制状況
- 米国
- EU
- 日本
第5章 新興技術と開発
- 新興技術
- Ac-225とPb-212
- ナノ粒子ベースのセラノスティック薬剤
- 臨床試験分析
- 診断用放射性医薬品
- 治療用放射性医薬品
- 特許分析
- 重要ポイント
第6章 市場セグメンテーション分析
- セグメンテーションの内訳
- 放射性医薬品市場:製品タイプ別
- 診断用
- 診断用:画像技術タイプ別
- 診断用:製造法別
- 治療用
- 治療用:製品タイプ別
- 放射性医薬品市場:用途別
- 市場概要
- 腫瘍
- 心臓病
- 神経
- その他
- 放射性医薬品市場:製造法別
- 市場概要
- 市場収益・予測
- 地理的内訳
- 放射性医薬品市場:地域別
- 北米
- 欧州
- アジア太平洋
- その他の地域
第7章 競合情報
- 概要
- 診断用放射性医薬品
- 治療用放射性医薬品
第8章 放射性医薬品市場における持続可能性:ESGの観点
- 放射性医薬品業界におけるESGの役割
- 環境
- 社会
- ガバナンス
- ESGリスク評価
- 総論
第9章 付録
- 調査手法
- 出典
- 略語
- 企業プロファイル
- BAYER AG
- BLUE EARTH DIAGNOSTICS
- BOSTON SCIENTIFIC CORP.
- BWXT MEDICAL LTD.
- CARDINAL HEALTH
- CURIUM
- ECKERT & ZIEGLER
- GE HEALTHCARE
- INTERNATIONAL ISOTOPES INC.
- IONETIX CORP.
- JUBILANT PHARMOVA LTD.
- LANTHEUS
- NMR
- NOVARTIS AG
- SIEMENS HEATHNIEERS AG
- 新興スタートアップ企業/市場ディスラプター
List of Tables
- Summary Table : Global Market for Radiopharmaceuticals, by Region, Through 2029
- Table 1 : Porter's Five Forces: Rating Scale
- Table 2 : Acquisitions and Funding in Radiopharmaceuticals Market, 2023 and 2024
- Table 3 : Selected Diagnostic Radiopharmaceuticals in Development, 2025
- Table 4 : Selected Novel Therapeutic Radiopharmaceuticals in Phase 3 Clinical Development, 2025
- Table 5 : Number of Patents for Radionuclides, January 2022-December 2024
- Table 6 : Number of Patents for Radionuclides, by Radionuclide Type, January 2022-December 2024
- Table 7 : Number of Patents for Radionuclides, by Country, January 2022-December 2024
- Table 8 : Global Market for Radiopharmaceuticals, by Product Type, Through 2029
- Table 9 : Global Market for Diagnostic Radiopharmaceuticals, by Imaging Technique Type, Through 2029
- Table 10 : Commercially Available Tc-99m-based Diagnostic Radiopharmaceuticals
- Table 11 : Commercially Available I-123-based Diagnostic Radiopharmaceuticals
- Table 12 : Commercially Available In-111-based Diagnostic Radiopharmaceuticals
- Table 13 : Commercially Available SPECT Radiopharmaceuticals Based on Other Radionuclides
- Table 14 : Global Market for SPECT Radiopharmaceuticals, by Radionuclide Type, Through 2029
- Table 15 : PET vs. SPECT Radiopharmaceuticals
- Table 16 : Commercially Available F-18-based PET Radiopharmaceuticals
- Table 17 : Commercially Available Ga-18-based PET Radiopharmaceuticals
- Table 18 : Commercially Available Other PET Radiopharmaceuticals
- Table 19 : Global Market for PET Radiopharmaceuticals, by Radionuclide Type, Through 2029
- Table 20 : Global Market for Diagnostic Radiopharmaceuticals, by Production Method, Through 2029
- Table 21 : Common Radionuclide Pairs in Radionuclide Generators
- Table 22 : Global Market for Therapeutic Radiopharmaceuticals, by Product Type, Through 2029
- Table 23 : Lu- 177-based Therapeutic Radiopharmaceuticals
- Table 24 : I-131-based Therapeutic Radiopharmaceuticals
- Table 25 : Other Beta-emitter Radioisotope-based Therapeutic Radiopharmaceuticals
- Table 26 : Global Market for Beta-emitter Therapeutic Radiopharmaceuticals, by Radionuclide Type, Through 2029
- Table 27 : Comparison of Alpha and Beta Particles as Therapeutic Agents
- Table 28 : Global Market for Alpha-emitting Therapeutic Radiopharmaceuticals, Through 2029
- Table 29 : Global Market for Radiopharmaceuticals, by Application, Through 2029
- Table 30 : FDA-approved PET Radiopharmaceuticals for AD Diagnosis
- Table 31 : Common Nuclear Reactor-produced Radioisotopes
- Table 32 : Common Medical Cyclotron-produced Radioisotopes
- Table 33 : Global Market for Radiopharmaceuticals, by Radioisotope Production Method, Through 2029
- Table 34 : Global Market for Radiopharmaceuticals, by Region, Through 2029
- Table 35 : North American Market for Radiopharmaceuticals, by Product Type, Through 2029
- Table 36 : North American Market for Diagnostic Radiopharmaceuticals, by Imaging Technique Type, Through 2029
- Table 37 : North American Market for Therapeutics Radiopharmaceuticals, by Product Type, Through 2029
- Table 38 : North American Market for Radiopharmaceuticals, by Application, Through 2029
- Table 39 : North American Market for Radiopharmaceuticals, by Radioisotope Production Method, Through 2029
- Table 40 : North American Market for Radiopharmaceuticals, by Country, Through 2029
- Table 41 : European Market for Radiopharmaceuticals, by Product Type, Through 2029
- Table 42 : European Market for Diagnostic Radiopharmaceuticals, by Imaging Technique Type, Through 2029
- Table 43 : European Market for Therapeutic Radiopharmaceuticals, by Product Type, Through 2029
- Table 44 : European Market for Radiopharmaceuticals, by Application, Through 2029
- Table 45 : European Market for Radiopharmaceuticals, by Radioisotope Production Method, Through 2029
- Table 46 : European Market for Radiopharmaceuticals, by Country, Through 2029
- Table 47 : Asia-Pacific Market for Radiopharmaceuticals, by Product Type, Through 2029
- Table 48 : Asia-Pacific Market for Diagnostic Radiopharmaceuticals, by Imaging Technique Type, Through 2029
- Table 49 : Asia-Pacific Market for Therapeutic Radiopharmaceuticals, by Product Type, Through 2029
- Table 50 : Asia-Pacific Market for Radiopharmaceuticals, by Application, Through 2029
- Table 51 : Asia-Pacific Market for Radiopharmaceuticals, by Radioisotope Production Method, Through 2029
- Table 52 : Asia-Pacific Market for Radiopharmaceuticals, by Country, Through 2029
- Table 53 : Number of Cyclotrons Used for Radionuclide Production, by Country, 2025
- Table 54 : RoW Market for Radiopharmaceuticals, by Product Type, Through 2029
- Table 55 : RoW Market for Diagnostic Radiopharmaceuticals, by Imaging Technique Type, Through 2029
- Table 56 : RoW Market for Therapeutic Radiopharmaceuticals, by Product Type, Through 2029
- Table 57 : RoW Market for Radiopharmaceuticals, by Application, Through 2029
- Table 58 : RoW Market for Radiopharmaceuticals, by Radioisotope Production Method, Through 2029
- Table 59 : RoW Market for Radiopharmaceuticals, by Sub-region, Through 2029
- Table 60 : ESG Risk Rankings for Radiopharmaceutical Companies, 2025*
- Table 61 : Report Sources
- Table 62 : Abbreviations Used in This Report
- Table 63 : Bayer AG: Company Snapshot
- Table 64 : Bayer AG: Financial Performance, FY 2022 and 2023
- Table 65 : Bayer AG: Product Portfolio
- Table 66 : Bayer AG: News/Key Developments, 2023 and 2024
- Table 67 : Blue Earth Diagnostics: Company Snapshot
- Table 68 : Blue Earth Diagnostics: Product Portfolio
- Table 69 : Blue Earth Diagnostics: News/Key Developments, 2023 and 2024
- Table 70 : Boston Scientific Corp.: Company Snapshot
- Table 71 : Boston Scientific Corp.: Financial Performance, FY 2023 and 2024
- Table 72 : Boston Scientific Corp.: Product Portfolio
- Table 73 : BWXT Medical Ltd.: Company Snapshot
- Table 74 : BWXT Medical Ltd.: Product Portfolio
- Table 75 : BWXT Medical Ltd.: News/Key Developments, 2022-2025
- Table 76 : Cardinal Health: Company Snapshot
- Table 77 : Cardinal Health: Financial Performance, FY 2022 and 2023
- Table 78 : Cardinal Health: Product Portfolio
- Table 79 : Cardinal Health: News/Key Developments, 2023 and 2024
- Table 80 : Curium: Company Snapshot
- Table 81 : Curium: Product Portfolio
- Table 82 : Curium: News/Key Developments, 2022-2024
- Table 83 : Eckert & Ziegler: Company Snapshot
- Table 84 : Eckert & Ziegler: Financial Performance, FY 2022 and 2023
- Table 85 : Eckert & Ziegler: Product Portfolio
- Table 86 : Eckert & Ziegler: News/Key Developments, 2024 and 2025
- Table 87 : GE HealthCare: Company Snapshot
- Table 88 : GE HealthCare: Financial Performance, FY 2023 and 2024
- Table 89 : GE HealthCare: Product Portfolio
- Table 90 : GE HealthCare: News/Key Developments, 2022-2024
- Table 91 : International Isotopes Inc.: Company Snapshot
- Table 92 : International Isotopes Inc.: Financial Performance, FY 2022 and 2023
- Table 93 : International Isotopes Inc.: Product Portfolio
- Table 94 : International Isotopes Inc.: News/Key Developments, 2024
- Table 95 : IONETIX Corp.: Company Snapshot
- Table 96 : IONETIX Corp.: Product Portfolio
- Table 97 : IONETIX Corp.: News/Key Developments, 2023 and 2024
- Table 98 : Jubilant Pharmova Ltd.: Company Snapshot
- Table 99 : Jubilant Pharmova Ltd.: Financial Performance, FY 2022 and 2023
- Table 100 : Jubilant Pharmova Ltd.: Product Portfolio
- Table 101 : Jubilant Pharmova Ltd.: News/Key Developments, 2023 and 2024
- Table 102 : Lantheus: Company Snapshot
- Table 103 : Lantheus: Financial Performance, FY 2022 and 2023
- Table 104 : Lantheus: Product Portfolio
- Table 105 : Lantheus: News/Key Developments, 2022-2025
- Table 106 : NMR: Company Snapshot
- Table 107 : NMR: Product Portfolio
- Table 108 : NMR: News/Key Developments, 2024 and 2025
- Table 109 : Novartis AG: Company Snapshot
- Table 110 : Novartis AG: Financial Performance, FY 2023 and 2024
- Table 111 : Novartis AG: Product Portfolio
- Table 112 : Novartis AG: News/Key Developments, 2022-2024
- Table 113 : Siemens Healthineers AG: Company Snapshot
- Table 114 : Siemens Healthineers AG: Financial Performance, FY 2023 and 2024
- Table 115 : Siemens Healthineers AG: Product Portfolio
- Table 116 : Siemens Healthineers AG: News/Key Developments, 2023 and 2024
- Table 117 : List of Few Emerging Startups/ Market Disruptors
List of Figures
- Summary Figure : Global Market Shares of Radiopharmaceuticals, by Region, 2023
- Figure 1 : Porter's Five Forces Analysis
- Figure 2 : Radiopharmaceuticals Market Dynamics
- Figure 3 : Estimated New Cancer Cases, 2022-2050
- Figure 4 : Global Cancer Incidence, by Region, 2022 vs. 2045
- Figure 5 : Number of Active Clinical Trials for Diagnostic Radiopharmaceuticals, by Radioisotope Type, 2025
- Figure 6 : Number of Active Clinical Trials for Therapeutic Radiopharmaceuticals, by Radioisotope Type, 2025
- Figure 7 : Global Market Shares of Radiopharmaceuticals, by Product Type, 2023
- Figure 8 : Global Market Shares of Diagnostic Radiopharmaceuticals, by Imaging Technique Type, 2023
- Figure 9 : Global Market Shares of SPECT Radiopharmaceuticals, by Radionuclide Type, 2023
- Figure 10 : Global Market Shares of PET Radiopharmaceuticals, by Radionuclide Type, 2023
- Figure 11 : Global Market Shares of Diagnostic Radiopharmaceuticals, by Production Method, 2023
- Figure 12 : Global Market Shares of Therapeutic Radiopharmaceuticals, by Product Type, 2023
- Figure 13 : Global Market Shares of Beta-emitter Therapeutic Radiopharmaceuticals, by Radionuclide Type, 2023
- Figure 14 : Global Market Shares of Radiopharmaceuticals, by Application, 2023
- Figure 15 : Global Market Shares of Radiopharmaceuticals, by Radioisotope Production Method, 2023
- Figure 16 : Global Market Shares of Radiopharmaceuticals, by Region, 2023
- Figure 17 : North American Market Shares of Radiopharmaceuticals, by Product Type, 2023
- Figure 18 : North American Market Shares of Diagnostic Radiopharmaceuticals, by Imaging Technique Type, 2023
- Figure 19 : North American Market Shares of Therapeutic Radiopharmaceuticals, by Product Type, 2023
- Figure 20 : North American Market Shares of Radiopharmaceuticals, by Application, 2023
- Figure 21 : North American Market Shares of Radiopharmaceuticals, by Radioisotope Production Method, 2023
- Figure 22 : North American Market Shares of Radiopharmaceuticals, by Country, 2023
- Figure 23 : European Market Shares of Radiopharmaceuticals, by Product Type, 2023
- Figure 24 : European Market Shares of Diagnostic Radiopharmaceuticals, by Imaging Technique Type, 2023
- Figure 25 : European Market Shares of Therapeutic Radiopharmaceuticals, by Product Type, 2023
- Figure 26 : European Market Shares of Radiopharmaceuticals, by Application, 2023
- Figure 27 : European Market Shares of Radiopharmaceuticals, by Radioisotope Production Method, 2023
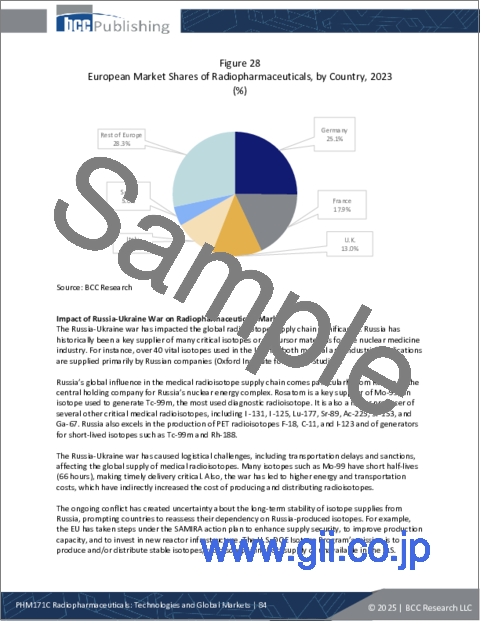
- Figure 28 : European Market Shares of Radiopharmaceuticals, by Country, 2023
- Figure 29 : Asia-Pacific Market Shares of Radiopharmaceuticals, by Product Type, 2023
- Figure 30 : Asia-Pacific Market Shares of Diagnostic Radiopharmaceuticals, by Imaging Technique Type, 2023
- Figure 31 : Asia-Pacific Market Shares of Therapeutic Radiopharmaceuticals, by Product Type, 2023
- Figure 32 : Asia-Pacific Market Shares of Radiopharmaceuticals, by Application, 2023
- Figure 33 : Asia-Pacific Market Shares of Radiopharmaceuticals, by Radioisotope Production Method, 2023
- Figure 34 : Asia-Pacific Market Shares of Radiopharmaceuticals, by Country, 2023
- Figure 35 : RoW Market Shares of Radiopharmaceuticals, by Product Type, 2023
- Figure 36 : RoW Market Shares of Diagnostic Radiopharmaceuticals, by Imaging Technique Type, 2023
- Figure 37 : RoW Market Shares of Therapeutic Radiopharmaceuticals, by Product Type, 2023
- Figure 38 : RoW Market Shares of Radiopharmaceuticals, by Application, 2023
- Figure 39 : RoW Market Shares of Radiopharmaceuticals, by Radioisotope Production Method, 2023
- Figure 40 : RoW Market Shares of Radiopharmaceuticals, by Sub-Region, 2023
- Figure 41 : Global Market Shares of Diagnostic Radiopharmaceuticals, by Company, 2023
- Figure 42 : Global Market Shares of Therapeutic Radiopharmaceuticals, by Company, 2023
- Figure 43 : Bayer AG: Revenue Shares, by Business Unit, FY 2023
- Figure 44 : Bayer AG: Revenue Shares, by Country/Region, FY 2023
- Figure 45 : Boston Scientific Corp.: Revenue Shares, by Business Unit, FY 2024
- Figure 46 : Boston Scientific Corp.: Revenue Shares, by Country/Region, FY 2024
- Figure 47 : Cardinal Health: Revenue Shares, by Business Unit, FY 2023
- Figure 48 : Cardinal Health: Revenue Shares, by Country/Region, FY 2023
- Figure 49 : Cardinal Health: Revenue Shares, by Country/Region, FY 2023
- Figure 50 : Eckert & Ziegler: Revenue Shares, by Country/Region, FY 2023
- Figure 51 : GE HealthCare: Revenue Shares, by Business Unit, FY 2024
- Figure 52 : GE HealthCare: Revenue Shares, by Country/Region, FY 2024
- Figure 53 : International Isotopes Inc.: Revenue Shares, by Business Unit, FY 2023
- Figure 54 : International Isotopes Inc.: Revenue Shares, by Country/Region, FY 2023
- Figure 55 : Jubilant Pharmova Ltd.: Revenue Shares, by Business Unit, FY 2023
- Figure 56 : Jubilant Pharmova Ltd.: Revenue Shares, by Country/Region, FY 2023
- Figure 57 : Lantheus: Revenue Shares, by Business Unit, FY 2023
- Figure 58 : Novartis AG: Revenue Shares, by Business Unit, FY 2024
- Figure 59 : Novartis AG: Revenue Shares, by Country/Region, FY 2024
- Figure 60 : Siemens Healthineers AG: Revenue Shares, by Business Unit, FY 2024
- Figure 61 : Siemens Healthineers AG: Revenue Shares, by Country/Region, FY 2024
The global radiopharmaceuticals market is expected to grow from $10.3 billion in 2024 and is projected to reach $21.9 billion by the end of 2029, at a compound annual growth rate (CAGR) of 16.4% during the forecast period of 2024 to 2029.
The North American radiopharmaceuticals market is expected to grow from $4.9 billion in 2024 and is projected to reach $11.5 billion by the end of 2029, at a CAGR of 18.5% during the forecast period of 2024 to 2029.
The European radiopharmaceuticals market is expected to grow from $2.3 billion in 2024 and is projected to reach $4.9 billion by the end of 2029, at a CAGR of 16.4% during the forecast period of 2024 to 2029.
Report Scope
This report analyzes the global market for radiopharmaceuticals, in terms of quantitative and qualitative data, to help readers understand the market, to assess business/growth strategies, and to make informed business decisions regarding radiopharmaceuticals. BCC Research estimates market data for 2023 (the base year) and 2024 and forecasts values for 2025 through 2029. The radiopharmaceuticals market segmentation is based on product, application, production method, countries and regions.
Drivers, restraints and opportunities in the radiopharmaceuticals market are also discussed. The report also describes the competitive landscape of the radiopharmaceuticals market and highlights emerging trends. The latest new products, acquisitions, and collaborations related to the radiopharmaceuticals market are also covered.
Report Includes
- 50 data tables and 68 additional tables
- Analyses of trends in the global market for radiopharmaceuticals, with revenue data for 2021 to 2023, estimates for 2024, and projected CAGRs through 2029
- Estimates of the size, and revenue prospects for, the global market, along with a market share analysis by product type, application, production method, and region/country
- Facts and figures pertaining to the market dynamics, technological progress, regulations, prospects, innovations and the impact of various macroeconomic factors
- Insights derived from the Porter's Five Forces model, as well as global supply/value chain and PESTLE analyses
- An analysis of patents, clinical trials, emerging trends and other developments in the industry
- Overview of sustainability trends and ESG developments, with emphasis on consumer attitudes, and the ESG scores and practices of leading companies
- Analysis of the industry structure, including companies' market shares and rankings, strategic alliances, M&A activity and a venture funding outlook
- Profiles of leading companies, including Cardinal Health, Lantheus, Curium, GE Healthcare, and Novartis AG
Table of Contents
Chapter 1 Executive Summary
- Market Outlook
- Scope of Report
- Market Summary
Chapter 2 Market Overview
- Radiopharmaceuticals Overview
- Preparation of Radiopharmaceuticals
- Macroeconomic Factors Analysis
- Porter's Five Forces Analysis
- Threat of New Entrants (Moderate to Low)
- Threat of Substitutes (Low to Moderate)
- Bargaining Power of Suppliers (High)
- Bargaining Power of Buyers (Moderate)
- Industry Rivalry (Moderate)
Chapter 3 Market Dynamics
- Market Drivers
- Rising Prevalence of Cancer and Other Chronic Diseases
- Unmet Need in Oncology
- Precision Medicine
- Nuclear Imaging Technologies
- Increasing Investment
- Market Restraints
- Manufacturing and Supply Chain Issues
- Infrastructure and Specialized Imaging Equipment Requirements
- Shortage of Skilled Professionals
- Market Trends
- Theranostics
- Regional Diversification and Supply Chain Resilience
- Opportunities
- Radiopharmaceuticals Contract Manufacturing
- PET Imaging in AD
Chapter 4 Regulatory Landscape
- U.S.
- European Union
- Japan
Chapter 5 Emerging Technologies and Developments
- Emerging Technologies
- Ac-225 and Pb-212
- Nanoparticle-based Theranostic Agents
- Clinical Trials Analysis
- Diagnostic Radiopharmaceuticals
- Therapeutic Radiopharmaceuticals
- Patent Analysis
- Key Takeaways
Chapter 6 Market Segmentation Analysis
- Segmentation Breakdown
- Radiopharmaceuticals Market, by Product Type
- Diagnostic Radiopharmaceuticals
- Diagnostic Radiopharmaceuticals Market, by Imaging Technique Type
- Diagnostic Radiopharmaceuticals Market, by Production Method
- Therapeutic Radiopharmaceuticals
- Therapeutic Radiopharmaceuticals Market, by Product Type
- Radiopharmaceuticals Market by Application
- Market Overview
- Oncology
- Cardiology
- Neurology
- Others
- Radiopharmaceuticals Market by Radioisotope Production Method
- Market Overview
- Market Revenue and Forecast
- Geographic Breakdown
- Radiopharmaceuticals Market Breakdown by Region
- North America
- Europe
- Asia-Pacific
- RoW
Chapter 7 Competitive Intelligence
- Overview
- Diagnostic Radiopharmaceuticals
- Therapeutic Radiopharmaceuticals
Chapter 8 Sustainability in Radiopharmaceuticals Market: ESG Perspective
- Role of ESG in the Radiopharmaceuticals Industry
- Environment
- Social
- Governance
- ESG Risk Ratings
- Conclusion
Chapter 9 Appendix
- Methodology
- Sources
- Abbreviations
- Company Profiles
- BAYER AG
- BLUE EARTH DIAGNOSTICS
- BOSTON SCIENTIFIC CORP.
- BWXT MEDICAL LTD.
- CARDINAL HEALTH
- CURIUM
- ECKERT & ZIEGLER
- GE HEALTHCARE
- INTERNATIONAL ISOTOPES INC.
- IONETIX CORP.
- JUBILANT PHARMOVA LTD.
- LANTHEUS
- NMR
- NOVARTIS AG
- SIEMENS HEATHNIEERS AG
- Emerging Start-ups/Market Disruptors
