|
|
市場調査レポート
商品コード
1572711
医薬品有効成分 (API) の世界市場Active Pharmaceutical Ingredients: Global Markets |
||||||
|
|||||||
| 医薬品有効成分 (API) の世界市場 |
|
出版日: 2024年10月17日
発行: BCC Research
ページ情報: 英文 119 Pages
納期: 即納可能
|
全表示
- 概要
- 図表
- 目次
世界の医薬品有効成分 (API) の市場規模は、2023年の2,478億米ドルから、予測期間中は5.9%のCAGRで推移し、2029年には3,479億米ドルの規模に成長すると予測されています。
製造法では、化学合成の部門が、2023年の1,813億米ドルから、5.4%のCAGRで推移し、2029年には2,461億米ドルに達すると予測されています。また、バイオテクノロジーの部門は、2023年の665億米ドルから、7.4%のCAGRで推移し、2029年には1,017億米ドルに達すると予測されています。
当レポートでは、世界の医薬品有効成分 (API) の市場を調査し、市場概要、市場影響因子および市場機会の分析、法規制環境、新興技術および技術開発の動向、市場規模の推移・予測、各種区分・地域別の詳細分析、競合情勢、主要企業のプロファイルなどをまとめています。
目次
第1章 エグゼクティブサマリー
- 市場見通し
- 調査範囲
- 市場概要
第2章 市場概要
- APIの定義
- 世界のAPIのサプライチェーン
- APIの製造法
- APIの製造:合成経路
- 製造法
第3章 市場力学
- 市場力学スナップショット
- 市場促進要因
- 回復力のある医薬品需要
- ジェネリック医薬品の採用の増加
- より複雑な化学物質への移行
- バイオ医薬品市場の成長
- API製造の進歩
- 政府の支援
- 市場抑制要因
- 厳格な規制とコンプライアンス要件
- ジェネリックAPI業界における価格圧力
- 熟練した専門家の不足
- 市場動向
- 複雑なAPIの需要増加
- 地域の多様化とサプライチェーンの回復力
- 連続フロー製造
- 使い捨て技術の拡大
- API製造における持続可能性の実践の拡大
- アウトソーシングとCDMOパートナーシップの増加
第4章 新興技術と開発
- 複合合成API製造のための生体触媒
- AIとMLの統合
- フレキシブル製造
第5章 市場セグメンテーション分析
- セグメンテーションの内訳
- API市場:製造業者タイプ別
- 自社用および受託製造市場
- 商用市場
- API市場:製造法別
- 化学合成
- バイオテクノロジー
- API市場:分子タイプ別
- 低分子API
- 巨大分子
- 地理的内訳
- API市場:地域別
- 北米
- 欧州
- アジア太平洋
- その他の地域
第6章 競合情報
- サプライヤーの情勢
- 自社用APIの製造業者
- 受託製造業者
- 商用APIの製造業者
- 汎用API:市場情勢
- 革新的API:市場情勢
- ポーターのファイブフォース分析
第7章 付録
- 調査手法
- 出典
- 略語
- 企業プロファイル
- AUROBINDO PHARMA
- DIVI'S LABORATORIES LTD.
- EUROAPI
- EVONIK INDUSTRIES AG
- LONZA
- PFIZER INC.
- SIEGFRIED HOLDING AG
- TEVA PHARMACEUTICAL INDUSTRIES LTD.
- THERMO FISHER SCIENTIFIC INC.
- WUXI APPTEC
List of Tables
- Summary Table : Global Market for APIs, by Production Method, Through 2029
- Table 1 : Regulatory Requirements of GMP and Supply Chain Integrity for APIs
- Table 2 : Recent Spin-offs and Separations of API Companies
- Table 3 : Biocatalysis in API Production: Benefits and Challenges
- Table 4 : Global Market for APIs, by Manufacturer Type, Through 2029
- Table 5 : Global Market for Captive and Contract Manufacturer APIs, by Region, Through 2029
- Table 6 : Global Market for Merchant APIs, by Region, Through 2029
- Table 7 : Global Market for APIs, by Production Method, Through 2029
- Table 8 : Biotech Production Methods: Attributes and Applications
- Table 9 : Global Market for Biotech APIs, by Production Method, Through 2029
- Table 10 : Global Market for APIs, by Molecule Type, Through 2029
- Table 11 : Characteristics of Small Molecules
- Table 12 : Global Market for Small-Molecule APIs, by Type, Through 2029
- Table 13 : Global Market for Small-Molecule APIs, by Manufacturer Type, Through 2029
- Table 14 : Characteristics of Large Molecules/Biologics
- Table 15 : Global Market for Large-Molecule APIs, by Type, Through 2029
- Table 16 : Global Market for Large-Molecule APIs, by Manufacturer Type, Through 2029
- Table 17 : Global Market for APIs, by Region, Through 2029
- Table 18 : North American Market for APIs, by Manufacturer Type, Through 2029
- Table 19 : North American Market for APIs, by Production Method, Through 2029
- Table 20 : North American Market for APIs, by Molecule Type, Through 2029
- Table 21 : North American Market for APIs, by Country, Through 2029
- Table 22 : U.S. Market for APIs, by Production Method, Through 2029
- Table 23 : U.S. Market for APIs, by Molecule Type, Through 2029
- Table 24 : Canadian Market for APIs, by Production Method, Through 2029
- Table 25 : Canadian Market for APIs, by Molecule Type, Through 2029
- Table 26 : Mexican Market for APIs, by Production Method, Through 2029
- Table 27 : Mexican Market for APIs, by Molecule Type, Through 2029
- Table 28 : European Market for APIs, by Manufacturer Type, Through 2029
- Table 29 : European Market for APIs, by Production Method, Through 2029
- Table 30 : European Market for APIs, by Molecule Type, Through 2029
- Table 31 : European Market for APIs, by Country, Through 2029
- Table 32 : German Market for APIs, by Production Method, Through 2029
- Table 33 : German Market for APIs, by Molecule Type, Through 2029
- Table 34 : French Market for APIs, by Production Method, Through 2029
- Table 35 : French Market for APIs, by Molecule Type, Through 2029
- Table 36 : U.K. Market for APIs, by Production Method, Through 2029
- Table 37 : U.K. Market for APIs, by Molecule Type, Through 2029
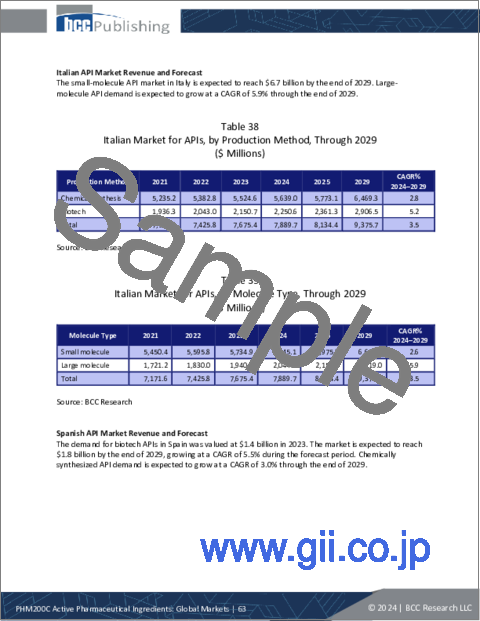
- Table 38 : Italian Market for APIs, by Production Method, Through 2029
- Table 39 : Italian Market for APIs, by Molecule Type, Through 2029
- Table 40 : Spanish Market for APIs, by Production Method, Through 2029
- Table 41 : Spanish Market for APIs, by Molecule Type, Through 2029
- Table 42 : Rest of European Market for APIs, by Production Method, Through 2029
- Table 43 : Rest of European Market for APIs, by Molecule Type, Through 2029
- Table 44 : Asia-Pacific Market for APIs, by Manufacturer Type, Through 2029
- Table 45 : Asia-Pacific Market for APIs, by Production Method, Through 2029
- Table 46 : Asia-Pacific Market for APIs, by Molecule Type, Through 2029
- Table 47 : Asia-Pacific Market for APIs, by Country, Through 2029
- Table 48 : Chinese Market for APIs, by Production Method, Through 2029
- Table 49 : Chinese Market for APIs, by Molecule Type, Through 2029
- Table 50 : Japanese Market for APIs, by Production Method, Through 2029
- Table 51 : Japanese Market for APIs, by Molecule Type, Through 2029
- Table 52 : Indian Market for APIs, by Production Method, Through 2029
- Table 53 : Indian Market for APIs, by Molecule Type, Through 2029
- Table 54 : Rest of APAC Market for APIs, by Production Method, Through 2029
- Table 55 : Rest of APAC Market for APIs, by Molecule Type, Through 2029
- Table 56 : RoW Market for APIs, by Manufacturer Type, Through 2029
- Table 57 : RoW Market for APIs, by Production Method, Through 2029
- Table 58 : RoW Market for APIs, by Molecule Type, Through 2029
- Table 59 : RoW Market for APIs, by Country, Through 2029
- Table 60 : Key API Manufacturers
- Table 61 : Report Sources
- Table 62 : Abbreviations Used in this Report
- Table 63 : Aurobindo Pharma: Company Snapshot
- Table 64 : Aurobindo Pharma: Financial Performance, FY 2023 and 2024
- Table 65 : Aurobindo Pharma: Product Portfolio
- Table 66 : Aurobindo Pharma: News/Key Developments, 2022-2024
- Table 67 : Divi's Laboratories Ltd.: Company Snapshot
- Table 68 : Divi's Laboratories Ltd.: Financial Performance, FY 2023 and 2024
- Table 69 : Divi's Laboratories Ltd.: Product Portfolio
- Table 70 : EUROAPI: Company Snapshot
- Table 71 : EUROAPI: Financial Performance, FY 2022 and 2023
- Table 72 : EUROAPI: Product Portfolio
- Table 73 : EUROAPI: News/Key Developments, 2022-2024
- Table 74 : Evonik Industries AG: Company Snapshot
- Table 75 : Evonik Industries AG: Financial Performance, FY 2022 and 2023
- Table 76 : Evonik Industries AG: Product Portfolio
- Table 77 : Evonik Industries AG: News/Key Developments, 2022-2024
- Table 78 : Lonza: Company Snapshot
- Table 79 : Lonza: Financial Performance, FY 2022 and 2023
- Table 80 : Lonza: Product Portfolio
- Table 81 : Lonza: News/Key Developments, 2022-2024
- Table 82 : Pfizer Inc.: Company Snapshot
- Table 83 : Pfizer Inc.: Financial Performance, FY 2022 and 2023
- Table 84 : Pfizer Inc: Product Portfolio
- Table 85 : Pfizer Inc.: News/Key Developments, 2022-2024
- Table 86 : Siegfried Holding AG: Company Snapshot
- Table 87 : Siegfried Holding AG: Financial Performance, FY 2022 and 2023
- Table 88 : Siegfried Holding AG: Product Portfolio
- Table 89 : Siegfried Holding AG: News/Key Developments, 2022-2024
- Table 90 : Teva Pharmaceutical Industries Ltd.: Company Snapshot
- Table 91 : Teva Pharmaceutical Industries Ltd.: Financial Performance, FY 2022 and 2023
- Table 92 : Teva Pharmaceutical Industries Ltd.: Product Portfolio
- Table 93 : Teva Pharmaceutical Industries Ltd.: News/Key Developments, 2022-2024
- Table 94 : Thermo Fisher Scientific Inc.: Company Snapshot
- Table 95 : Thermo Fisher Scientific Inc.: Financial Performance, FY 2022 and 2023
- Table 96 : Thermo Fisher Scientific Inc.: Product Portfolio
- Table 97 : Thermo Fisher Scientific Inc.: News/Key Developments, 2023 and 2024
- Table 98 : WuXi AppTec: Company Snapshot
- Table 99 : WuXi AppTec: Financial Performance, FY 2022 and 2023
- Table 100 : WuXi AppTec: Product Portfolio
- Table 101 : WuXi AppTec: News/Key Developments, 2022-2024
List of Figures
- Summary Figure : Global Market Shares of APIs, by Production Method, 2023
- Figure 1 : End-to-End Pharmaceutical Supply Chain
- Figure 2 : API Market Supply Chain
- Figure 3 : Chemical Synthetic Process
- Figure 4 : Schematic Representation of Biological Production Process for APIs
- Figure 5 : Market Dynamics of Active Pharmaceutical Ingredients (APIs)
- Figure 6 : U.S. FDA ANDA Approvals, by Fiscal Year, 2020-2023
- Figure 7 : Share of U.S. FDA ANDA Approvals, by Generic Drug Type, 2020-2023
- Figure 8 : Share of Drug Molecules Approved by the FDA, by Molecule Type, 2016 to 2023
- Figure 9 : Novel Drugs Approved by the FDA, by Drug Type, 2018-2023
- Figure 10 : Global Market Shares of APIs, by Manufacturer Type, 2023
- Figure 11 : Global Market Shares of Captive and Contract Manufacturer APIs, by Region, 2023
- Figure 12 : Global Market Shares of Merchant APIs, by Region, 2023
- Figure 13 : Global Market Shares of APIs, by Production Method, 2023
- Figure 14 : Global Market Shares of Biotech APIs, by Production Method, 2023
- Figure 15 : Global Market Shares of APIs, by Molecule Type, 2023
- Figure 16 : Global Market Shares of Small-Molecule APIs, by Type, 2023
- Figure 17 : Global Market Shares of Small-Molecule APIs, by Manufacturer Type, 2023
- Figure 18 : Global Market Shares of Large-Molecule APIs, by Type, 2023
- Figure 19 : Global Market Shares of Large-Molecule APIs, by Manufacturer Type, 2023
- Figure 20 : Global Market Shares of APIs, by Region, 2023
- Figure 21 : Location of API Manufacturers Serving the U.S. Market, as of August 2023
- Figure 22 : Location of Finished Dosage Forms (FDF) Manufacturers Serving U.S. Market, as of August 2023
- Figure 23 : Sources of APIs Used in Medications Consumed in the U.S., Market Share by Dollar Value, 2021
- Figure 24 : Biopharmaceutical Manufacturing Facilities in the U.S., 2018-2023
- Figure 25 : North American Market for APIs, by Manufacturer Type, 2023
- Figure 26 : North American Market for APIs, by Production Method, 2023
- Figure 27 : North American Market for APIs, by Molecule Type, 2023
- Figure 28 : North American Market for APIs, by Country, 2023
- Figure 29 : European Market Shares of APIs, by Manufacturer Type, 2023
- Figure 30 : European Market Shares of APIs, by Production Method, 2023
- Figure 31 : European Market Shares of APIs, by Molecule Type, 2023
- Figure 32 : European Market Shares of APIs, by Country, 2023
- Figure 33 : Share of Manufacturing Sites of APIs for U.S. Market, by Country/Region, August 2019
- Figure 34 : India's Drug and Pharmaceuticals Exports, 2016/2017 to 2023/2024
- Figure 35 : Asia-Pacific Market Shares of APIs, by Manufacturer Type, 2023
- Figure 36 : Asia-Pacific Market Shares of APIs, by Production Method, 2023
- Figure 37 : Asia-Pacific Market Shares of APIs, by Molecule Type, 2023
- Figure 38 : Asia-Pacific Market Shares of APIs, by Country, 2023
- Figure 39 : RoW Market Shares of APIs, by Manufacturer Type, 2023
- Figure 40 : RoW Market Shares of APIs, by Production Method, 2023
- Figure 41 : RoW Market Shares of APIs, by Molecule Type, 2023
- Figure 42 : RoW Market Shares of APIs, by Country, 2023
- Figure 43 : Aurobindo Pharma: Revenue Share, by Business Unit, FY 2024
- Figure 44 : Aurobindo Pharma: Revenue Share: Revenue Share, by Country/Region, FY 2024
- Figure 45 : Divi's Laboratories Ltd.: Revenue Share, by Country/Region, FY 2024
- Figure 46 : EUROAPI: Revenue Share, by Business Unit, FY 2023
- Figure 47 : Evonik Industries AG: Revenue Share, by Business Unit, FY 2023
- Figure 48 : Evonik Industries AG: Revenue Share, by Region, FY 2023
- Figure 49 : Lonza: Revenue Share, by Business Unit, FY 2023
- Figure 50 : Lonza: Revenue Share, by Region, FY 2023
- Figure 51 : Pfizer Inc.: Revenue Share, by Business Unit, 2023
- Figure 52 : Pfizer Inc.: Revenue Share, by Country/Region, 2023
- Figure 53 : Siegfried Holding AG: Market Share, by Business Unit, 2023
- Figure 54 : Teva Pharmaceutical Industries Ltd.: Market Share, by Business Unit, 2023
- Figure 55 : Thermo Fisher Scientific Inc.: Market Share, by Business Unit, 2023
- Figure 56 : Thermo Fisher Scientific Inc.: Revenue Share, by Country/Region, 2023
- Figure 57 : WuXi AppTec: Revenue Share, by Business Unit, FY 2023
- Figure 58 : WuXi AppTec: Revenue Share, by Country/Region, FY 2023
The global market for active pharmaceutical ingredients (APIs) is estimated to increase from $247.8 billion in 2023 to reach $347.9 billion by 2029, at a compound annual growth rate (CAGR) of 5.9% from 2024 through 2029.
The chemical synthesis market for APIs is estimated to increase from $181.3 billion in 2023 to reach $246.1 billion by 2029, at a CAGR of 5.4% from 2024 through 2029.
The biotech market for APIs is estimated to increase from $66.5 billion in 2023 to reach $101.7 billion by 2029, at a CAGR of 7.4% from 2024 through 2029.
Report Scope
This goal of this report is to impart in-depth knowledge of the global market for active pharmaceutical ingredients (APIs), in terms of both qualitative and quantitative data, to help readers assess the market landscape, develop business/growth strategies, and analyze their market position. BCC Research estimates market size for 2023 (the base year) and forecasts values for 2024 by the end of 2029. It is important to note that market size reflects the demand for APIs within a region or country rather than the API industry itself.
In this report, the API market is analyzed by manufacturer type, production method, molecule type, region and country. Industry growth trends, drivers, restraints and opportunities in the API market are also discussed in detail. The scope of the study is global.
Report Includes
- 64 data tables and 38 additional tables
- An analysis of the global markets for active pharmaceutical ingredients (APIs)
- Analyses of global market trends, with market revenue data from 2022 to 2023, estimates for 2024, forecast for 2025, and projected CAGRs through 2029
- Estimates of the size and revenue prospects of the global market, along with a market share analysis by origin, drug molecular entity type, manufacturer type, end use and region
- Facts and figures pertaining to the market dynamics, technical advances, API sources, production methods, route of synthesis, regulations, and the impact of macroeconomic variables
- A Porter's Five Forces model, and global supply chain and PESTLE analyses
- Patent activity featuring issues like patent expiry and its impact on the pharmaceutical market, and details of changes in pharmaceutical drug development
- Overview of sustainability trends and ESG developments, with emphasis on consumer attitudes, ESG score analysis, and the ESG practices of leading companies
- Analysis of the industry structure, including companies' market shares, strategic alliances, M&A activity and a venture funding outlook
- Company profiles of major players within the industry, including Pfizer Inc., Thermo Fisher Scientific Inc., EuroAPI, Lonza, Siegfried Holding AG, and Divi's Laboratories Ltd.
Table of Contents
Chapter 1 Executive Summary
- Market Outlook
- Scope of Report
- Market Summary
Chapter 2 Market Overview
- APIs Defined
- Global API Supply Chain
- API Production Methods
- API Production: Route of Synthesis
- Production Methods
Chapter 3 Market Dynamics
- Market Dynamics Snapshot
- Market Drivers
- Resilient Pharmaceutical Demand
- Increase in Adoption of Generics
- Shift to More Complex Chemical Entities
- Growth in the Biologics Market
- Advances in API Manufacturing
- Government Support
- Market Restraints
- Strict Regulations and Compliance Requirements
- Pricing Pressure in the Generic API Industry
- Shortage of Skilled Professionals
- Market Trends
- Increasing Demand for Complex APIs
- Regional Diversification and Supply Chain Resilience
- Continuous Flow Manufacturing
- Expansion of Single-Use Technologies
- Growing Sustainability Practices in API Manufacturing
- Increased Outsourcing and CDMO Partnerships
Chapter 4 Emerging Technologies and Developments
- Biocatalysis for Complex Synthetic API Manufacturing
- Integration of AI and ML
- Flexible Manufacturing
Chapter 5 Market Segmentation Analysis
- Segmentation Breakdown
- API Market, by Manufacturer Type
- Captive and Contract Manufacturing Market
- Merchant Market
- API Market, by Production Method
- Chemical Synthesis
- Biotech
- API Market, by Molecule Type
- Small-Molecule APIs
- Large Molecule
- Geographic Breakdown
- API Market, by Region
- North America
- Europe
- Asia-Pacific
- Rest of the World
Chapter 6 Competitive Intelligence
- Supplier Landscape
- Captive Manufacturers
- Contract Manufacturers
- Merchant Manufacturers
- Generic API Market Landscape
- Innovative API Market Landscape
- Porter's Five Forces Analysis
Chapter 7 Appendix
- Methodology
- Sources
- Abbreviations
- Company Profiles
- AUROBINDO PHARMA
- DIVI'S LABORATORIES LTD.
- EUROAPI
- EVONIK INDUSTRIES AG
- LONZA
- PFIZER INC.
- SIEGFRIED HOLDING AG
- TEVA PHARMACEUTICAL INDUSTRIES LTD.
- THERMO FISHER SCIENTIFIC INC.
- WUXI APPTEC


