|
|
市場調査レポート
商品コード
1880574
医薬品ろ過:世界市場Pharmaceutical Filtration: Global Markets |
||||||
|
|||||||
|
|||||||

| 医薬品ろ過:世界市場 |
|
出版日: 2025年11月28日
発行: BCC Research
ページ情報: 英文 152 Pages
納期: 即納可能
|

概要
世界の医薬品ろ過の市場規模は、2025年の120億米ドルから、2025年から2030年の予測期間中はCAGR 11.1%で推移し、2030年末には203億米ドルに達すると予測されています。
北米市場は、2025年の51億米ドルから、2025年から2030年の予測期間中は13.2%のCAGRで推移し、2030年末には95億米ドルに達すると予測されています。アジア太平洋市場は、2025年の29億米ドルから、2025年から2030年の予測期間中はCAGR 12%で推移し、2030年末には50億米ドルに達すると予測されています。
当レポートでは、世界の医薬品ろ過の市場を調査し、市場概要、市場影響因子および市場機会の分析、技術動向、法規制環境、市場規模の推移・予測、各種区分・地域別の詳細分析、主要企業のプロファイルなどをまとめています。
目次
第1章 エグゼクティブサマリー
- 市場見通し
- 調査範囲
- 市場サマリー
- 市場力学と成長要因
- 新興技術
- 将来の動向と発展
- セグメント分析
- 地域市場および新興市場
- 結論
第2章 市場概要
- 医薬品ろ過の役割
- 医薬品ろ過の選択に影響を与える要因
- 医薬品ろ過の重要性
第3章 市場力学
- 主なハイライト
- 市場力学スナップショット
- 市場促進要因
- 医薬品の需要増加
- 新興市場の成長
- 抑制要因
- 厳格な規制と検証要件
- 高い資本コストと運用コスト
- 機会
- 使い捨て技術の成長機会
- ろ過生産におけるAIシステムの導入
- 課題
- カスタマイズとスケールアップの問題
- 持続可能性と廃棄物処理
第4章 新興技術と開発
- 主なハイライト
- 新しい技術
- 窒化ホウ素から作られた超薄型フィルター
- 高温耐性膜
- ePTFE HEPAフィルター技術
第5章 サプライチェーン分析
- サプライチェーン分析
第6章 市場セグメンテーション分析
- セグメンテーションの内訳
- 市場分析:タイプ別
- 主なハイライト
- 滅菌ろ過
- 非滅菌ろ過
- 市場分析:製品別
- 主なハイライト
- フィルター
- ろ過システム
- その他
- 市場分析:用途別
- 主なハイライト
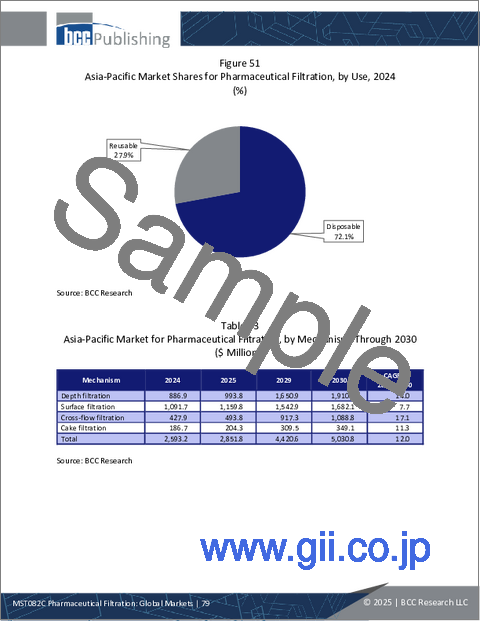
- 使い捨てフィルターシステム
- 再利用可能なろ過システム
- 市場分析:メカニズム別
- 主なハイライト
- 表面ろ過
- 深層ろ過
- クロスフローろ過
- ケークろ過
- 市場分析:カテゴリー別
- 主なハイライト
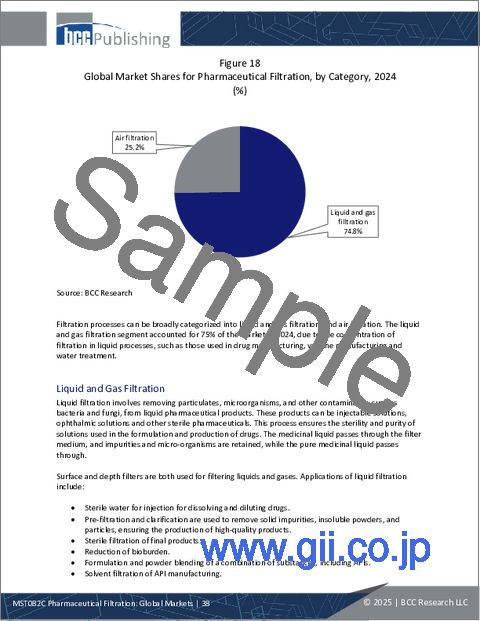
- 液体・ガスろ過
- 空気ろ過
- 市場分析:技術別
- 主なハイライト
- 限外ろ過
- 精密ろ過
- ナノろ過
- 逆浸透
- その他
- 市場分析:用途別
- 主なハイライト
- 医薬品製造
- 精製
- 品質管理
- 地理的内訳
- 市場分析:地域別
- 主なハイライト
- 北米
- 欧州
- アジア太平洋
- 中東・アフリカ
- 南米
第7章 競合情報
- 業界構造
- 医薬品ろ過市場:企業シェア分析
- Merck KGaA/MilliporeSigma
- Thermo Fisher Scientific Inc.
- Danaher Corp.
- Parker Hannifin Corp.
- Asahi Kasei Corp.
- 戦略分析
第8章 医薬品ろ過における持続可能性:ESGの観点
- 医薬品ろ過業界におけるESGの重要性
- ESGの実践
- 企業のESGランキング
- リスクスケール
- ESGの未来:新たな動向と機会
- BCCによる総論
第9章 付録
- 調査手法
- 情報源
- 参考文献
- 略語
- 企業プロファイル
- ALFA LAVAL
- AMAZON FILTERS LTD.
- ASAHI KASEI LIFE SCIENCE CORP.
- COLE-PARMER INSTRUMENT CO. LLC.
- CYTIVA (DANAHER CORP.)
- EATON
- GRAVER TECHNOLOGIES
- MEISSNER FILTRATION PRODUCTS INC.
- MERCK KGAA
- PARKER HANNIFIN CORP.
- REPLIGEN CORP.
- SAINT-GOBAIN LIFE SCIENCES
- SARTORIUS AG
- SHANGHAI SOLUGET FILTRATION TECHNOLOGY CO. LTD.
- THERMO FISHER SCIENTIFIC INC.

