|
|
市場調査レポート
商品コード
1454684
細胞・遺伝子治療の世界市場Global Cell and Gene Therapy Market |
||||||

|
|||||||
|
|||||||

| 細胞・遺伝子治療の世界市場 |
|
出版日: 2024年03月21日
発行: BCC Research
ページ情報: 英文 145 Pages
納期: 即納可能
|

全表示
- 概要
- 図表
- 目次
世界の細胞・遺伝子治療の市場規模は、2023年の72億米ドルから、予測期間中は26.4%のCAGRで推移し、2028年末には233億米ドルの規模に成長すると予測されています。
遺伝子治療の部門は2023年の29億米ドルから、同期間中に28.7%のCAGRで推移し、2028年末には103億米ドルに達すると予測されています。また、遺伝子組み換え細胞治療市場は2023年の32億米ドルから、25.6%のCAGRで推移し、2028年末には100億米ドルの規模に達すると予測されています。
当レポートでは、世界の細胞・遺伝子治療の市場を調査し、市場概要、法規制環境、市場影響因子および市場機会の分析、市場規模の推移・予測、各種区分・地域別の詳細分析、パイプラインの分析、競合情勢、主要企業のプロファイルなどをまとめています。
目次
第1章 エグゼクティブサマリー
- 市場見通し
- 調査範囲
- 市場概要
- 市場価格
第2章 市場概要
- 細胞・遺伝子治療の概要
- 規制状況
- 米国(FDA)
- 欧州
第3章 市場力学
- 市場力学
- 市場促進要因
- 市場抑制要因
- 市場機会
第4章 市場分析:各種区分別
- 各種区分の内訳
- 世界の細胞・遺伝子治療市場
- 市場規模・予測
- 市場分析
- 細胞治療
- 遺伝子組み換え細胞治療
- 遺伝子治療
- 世界の遺伝子組み換え細胞・遺伝子治療市場:ベクタータイプ別
- 市場規模・予測
- 市場分析
- アデノ随伴ウイルス(AAV)ベクター
- レトロウイルスベクター
- レンチウイルスベクター
- その他
- 世界の細胞・遺伝子治療市場:医薬品別
- 市場規模・予測
- Zolgensma
- Yescarta
- Kymriah
- Abecma
- Maci
- Tecartus
- Epicel
- その他
- 世界の細胞・遺伝子治療市場:用途別
- 市場規模・予測
- 腫瘍
- 希少疾患
- 眼科
- その他
- 地理的内訳
- 世界の細胞・遺伝子治療市場:地域別
- 市場規模・予測
- 北米
- 市場規模・予測
- 米国
- カナダ
- メキシコ
- 欧州
- 市場規模・予測
- ドイツ
- 英国
- フランス
- その他の欧州
- アジア太平洋
- 市場規模・予測
- 日本
- 中国
- オーストラリア
- その他のアジア太平洋地域
- 世界のその他の地域
- 市場規模・予測
第5章 競合情報
- 投資見通し
- M&A
- 競合情勢:概要
- 市場シェア分析
- 戦略的買収・提携
- パイプライン分析
第6章 持続可能性:ESGの観点
第7章 付録
- 調査手法
- 企業プロファイル
- AMGEN INC.
- BLUEBIRD BIO INC.
- BRISTOL-MYERS SQUIBB CO.
- DENDREON PHARMACEUTICALS LLC
- FERRING PHARMACEUTICALS
- GILEAD SCIENCES INC.
- IOVANCE BIOTHERAPEUTICS INC.
- JOHNSON & JOHNSON SERVICES INC.
- KRYSTAL BIOTECH INC.
- MALLINCKRODT PLC
- NOVARTIS AG
- ORCHARD THERAPEUTICS PLC.
- PHARMICELL CO. LTD.
- UNIQURE N.V.
- VERICEL CORP.
- 略語
- 参考文献
List of Tables
- Summary Table : Global Market for Cell and Gene Therapy, by Type of Therapy, Through 2028
- Table 1 : Approved Cell Therapy Products (Including Withdrawn Products), 2023
- Table 2 : Approved Gene Therapy Products (Including Withdrawn Products), 2023
- Table 3 : Total Number of New Cases and Deaths Due to Various Cancers Globally, 2020
- Table 4 : Comparison of Accelerated Approvals for Various Drugs
- Table 5 : Global Market for Cell and Gene Therapy, by Type of Therapy, Through 2028
- Table 6 : Global Market for Cell Therapy, by Region, Through 2028
- Table 7 : Approved CAR-T Products, as of December 2023
- Table 8 : Global Market for Gene-modified Cell Therapy, by Region, Through 2028
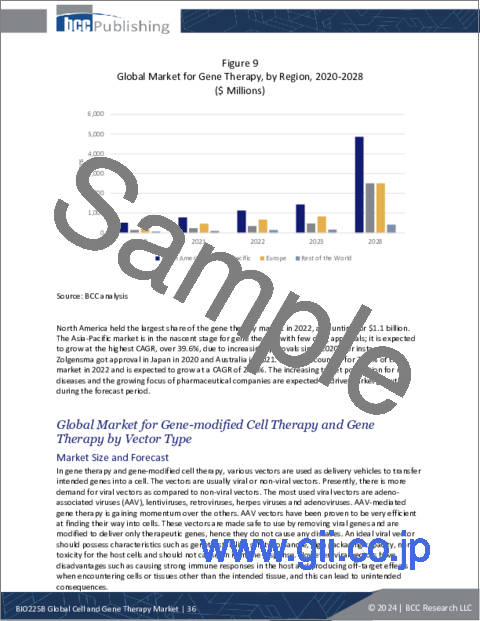
- Table 9 : Global Market for Gene Therapy, by Region, Through 2028
- Table 10 : Global Market for Gene-modified Cell Therapy and Gene Therapy, by Vector Type, Through 2028
- Table 11 : Global Market for Cell and Gene Therapy, by Drug Product, Through 2028
- Table 12 : Global Market for Cell and Gene Therapy, by Application, Through 2028
- Table 13 : Global Market for Cell and Gene Therapy for Oncology, by Region, Through 2028
- Table 14 : Global Market for Cell and Gene Therapy for Rare Diseases, by Region, Through 2028
- Table 15 : Global Market for Cell and Gene Therapy for Ophthalmology, by Region, Through 2028
- Table 16 : Global Market for Cell and Gene Therapy for Other Therapeutic Areas, by Region, Through 2028
- Table 17 : Global Market for Cell and Gene Therapy, by Region, Through 2028
- Table 18 : North American Market for Cell and Gene Therapy, by Country, Through 2028
- Table 19 : European Market for Cell and Gene Therapy, by Country, Through 2028
- Table 20 : Asia-Pacific Market for Cell and Gene Therapy, by Country, Through 2028
- Table 21 : Strategic Acquisitions and Collaborations Portfolio, 2021-2023
- Table 22 : Total Number of Clinical Trials, by Indication, 2023 (Q3)
- Table 23 : Key Cell and Gene Therapy Drug Candidates in Phase I Trials
- Table 24 : Key Cell and Gene Therapy Drug Candidates in Phase II Trials
- Table 25 : Key Cell and Gene Therapy Drug Candidates in Phase III Trials
- Table 26 : Key Cell and Gene Therapy Drug Candidates in Supplemental Indication and Formulation Expansions
- Table 27 : Cell and Gene Therapy Drug Awaiting Approvals
- Table 28 : Environmental Initiatives, by Various Cell and Gene Therapy Companies
- Table 29 : ESG Rankings for Companies in the Cell and Gene Therapy Market, 2023
- Table 30 : Amgen Inc.: Company Snapshot
- Table 31 : Amgen Inc.: Financial Performance, FY 2021 and 2022
- Table 32 : Amgen Inc.: Product Portfolio
- Table 33 : Amgen Inc: News/Key Developments, 2021
- Table 34 : Bluebird Bio Inc.: Company Snapshot
- Table 35 : Bluebird Bio Inc.: Financial Performance, FY 2021 and 2022
- Table 36 : Bluebird Bio Inc.: Product Portfolio
- Table 37 : Bluebird Bio Inc.: News/Key Developments,2022 and 2023
- Table 38 : Bristol Myers Squibb Co.: Company Snapshot
- Table 39 : Bristol-Myers Squibb Co.: Financial Performance, FY 2021 and 2022
- Table 40 : Bristol-Myers Squibb Co.: Product Portfolio
- Table 41 : Bristol-Myers Squibb Co: News/Key Developments, 2022 and 2023
- Table 42 : Dendreon Pharmaceuticals LLC: Company Snapshot
- Table 43 : Dendreon Pharmaceuticals LLC: Product Portfolio
- Table 44 : Dendreon Pharmaceuticals LLC: News/Key Developments, 2021
- Table 45 : Ferring Pharmaceuticals: Company Snapshot
- Table 46 : Ferring Pharmaceuticals: Financial Performance, FY 2021 and 2022
- Table 47 : Ferring Pharmaceuticals: Product Portfolio
- Table 48 : Ferring Pharmaceuticals: News/Key Developments, 2022 and 2023
- Table 49 : Gilead Sciences Inc.: Company Snapshot
- Table 50 : Gilead Sciences Inc.: Financial Performance, FY 2021 and 2022
- Table 51 : Gilead Sciences Inc.: Product Portfolio
- Table 52 : Gilead Sciences Inc.: News/Key Developments, 2021-2023
- Table 53 : Iovance Biotherapeutics Inc.: Company Snapshot
- Table 54 : Johnson & Johnson Services Inc.: Company Snapshot
- Table 55 : Johnson & Johnson Services Inc.: Financial Performance, FY 2021 and 2022
- Table 56 : Johnson & Johnson Services Inc: Product Portfolio
- Table 57 : Johnson & Johnson Services Inc: News/Key Developments, 2023
- Table 58 : Krystal Biotech Inc.: Company Snapshot
- Table 59 : Krystal Biotech Inc.: Product Portfolio
- Table 60 : Mallinckrodt PLC: Company Snapshot
- Table 61 : Mallinckrodt PLC: Financial Performance, FY 2021 and 2022
- Table 62 : Mallinckrodt PLC: Product Portfolio
- Table 63 : Mallinckrodt PLC: News/Key Developments, 2022 and 2023
- Table 64 : Novartis AG: Company Snapshot
- Table 65 : Novartis AG: Financial Performance, FY 2021 and 2022
- Table 66 : Novartis AG: Product Portfolio
- Table 67 : Novartis AG: News/Key Developments, 2021-2023
- Table 68 : Orchard Therapeutics Plc.: Company Snapshot
- Table 69 : Orchard Therapeutics Plc.: Financial Performance, FY 2021 and 2022
- Table 70 : Orchard Therapeutic PLC: Product Portfolio
- Table 71 : Orchard Therapeutic PLC: News/Key Developments, 2021-2023
- Table 72 : Pharmicell Co. Ltd.: Company Snapshot
- Table 73 : Pharmicell Co. Ltd.: Product Portfolio
- Table 74 : Uniqure N.V.: Company Snapshot
- Table 75 : Uniqure N.V.: Product Portfolio
- Table 76 : Uniqure N.V.: News/Key Developments, 2023
- Table 77 : Vericel Corp.: Company Snapshot
- Table 78 : Vericel Corp.: Financial Performance, FY 2021 and 2022
- Table 79 : Vericel Corp.: Product Portfolio
- Table 80 : Vericel Corp.: News/Key Developments, 2022
- Table 81 : Abbreviations
List of Figures
- Summary Figure : Global Market for Cell and Gene Therapy, by Type of Therapy, 2020-2028
- Figure 1 : Various Gene Therapy Strategies
- Figure 2 : Administration Routes in Gene Therapy
- Figure 3 : Cell Therapy Products-Regulatory Pathway
- Figure 4 : Cell and Gene Therapy Market Dynamics
- Figure 5 : Global Market for Cell and Gene Therapy, by Type of Therapy, 2020-2028
- Figure 6 : Global Market Shares of Cell and Gene Therapy, by Type of Therapy, 2022
- Figure 7 : Global Market for Cell Therapy, by Region, 2020-2028
- Figure 8 : Global Market for Gene-modified Cell Therapy, by Region, 2020-2028
- Figure 9 : Global Market for Gene Therapy, by Region, 2020-2028
- Figure 10 : Global Market for Gene-modified Cell Therapy and Gene Therapy, by Vector Type, 2020-2028
- Figure 11 : Global Market Shares of Gene-modified Cell Therapy and Gene Therapy, by Vector Type, 2022
- Figure 12 : Global Market for AAV Vectors for Gene-modified Cell Therapy and Gene Therapy, 2020-2028
- Figure 13 : Global Market for Retroviral Vectors for Gene-modified Cell Therapy and Gene Therapy, 2020-2028
- Figure 14 : Global Market for Lentiviral Vectors for Gene-modified Cell Therapy and Gene Therapy, 2020-2028
- Figure 15 : Global Market for Other Vectors Used in Gene-modified Cell Therapy and Gene Therapy, 2020-2028
- Figure 16 : Global Market for Cell and Gene Therapy, by Drug Product, 2020-2028
- Figure 17 : Global Market Shares of Cell and Gene Therapy, by Drug Product, 2022
- Figure 18 : Global Market for Zolgensma Drug for Cell and Gene Therapy, 2020-2028
- Figure 19 : Global Market for Yescarta Drug for Cell and Gene Therapy, 2020-2028
- Figure 20 : Global Market for Kymriah Drug for Cell and Gene Therapy, 2020-2028
- Figure 21 : Global Market for Abecma Drug for Cell and Gene Therapy, 2020-2028
- Figure 22 : Global Market for Maci Drug for Cell and Gene Therapy, 2020-2028
- Figure 23 : Global Market for Tecartus Drug for Cell and Gene Therapy, 2020-2028
- Figure 24 : Global Market for Epicel Drug for Cell and Gene Therapy, 2020-2028
- Figure 25 : Global Market for Other Types of Drugs Used for Cell and Gene Therapy, 2020-2028
- Figure 26 : Global Market for Cell and Gene Therapy, by Application, 2020-2028
- Figure 27 : Global Market Shares of Cell and Gene Therapy, by Application, 2022
- Figure 28 : Global Market for Cell and Gene Therapy for Oncology, by Region, 2020-2028
- Figure 29 : Global Market for Cell and Gene Therapy for Rare Diseases, by Region, 2020-2028
- Figure 30 : Global Market for Cell and Gene Therapy for Ophthalmology, by Region, 2020-2028
- Figure 31 : Global Market for Cell and Gene Therapy for Other Therapeutic Areas, by Region, 2020-2028
- Figure 32 : Global Market for Cell and Gene Therapy, by Region, 2020-2028
- Figure 33 : Global Market Shares of Cell and Gene Therapy, by Region, 2022
- Figure 34 : North American Market Shares of Cell and Gene Therapy, by Country, 2022
- Figure 35 : U.S. Market for Cell and Gene Therapy, 2020-2028
- Figure 36 : Canadian Market for Cell and Gene Therapy, 2020-2028
- Figure 37 : Mexican Market for Cell and Gene Therapy, 2020-2028
- Figure 38 : European Market Shares of Cell and Gene Therapy, by Country, 2022
- Figure 39 : German Market for Cell and Gene Therapy, 2020-2028
- Figure 40 : U.K. Market for Cell and Gene Therapy, 2020-2028
- Figure 41 : French Market for Cell and Gene Therapy, 2020-2028
- Figure 42 : Rest of European Market for Cell and Gene Therapy, 2020-2028
- Figure 43 : Asia-Pacific Market Shares of Cell and Gene Therapy, by Country, 2022
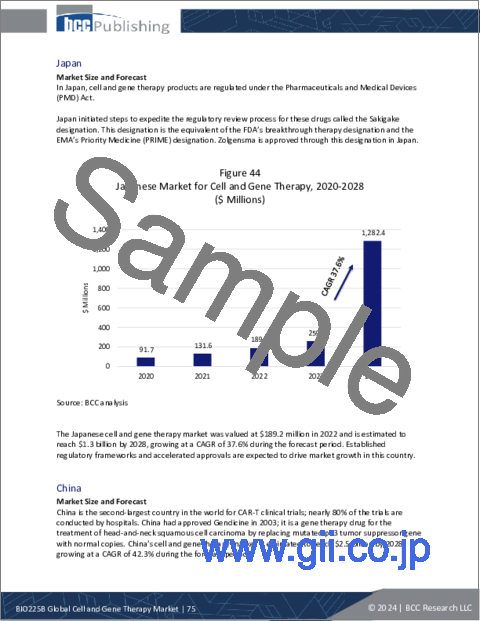
- Figure 44 : Japanese Market for Cell and Gene Therapy, 2020-2028
- Figure 45 : Chinese Market for Cell and Gene Therapy, 2020-2028
- Figure 46 : Australian Market for Cell and Gene Therapy, 2020-2028
- Figure 47 : Rest of Asia-Pacific Market for Cell and Gene Therapy, 2020-2028
- Figure 48 : Rest of the World Market for Cell and Gene Therapy, 2020-2028
- Figure 49 : Investments, by Year, 2017-2022
- Figure 50 : Equity Offering and Venture Financing, 2021 and 2022
- Figure 51 : Public and Private Companies Deal Value, 2021 and 2022
- Figure 52 : Number of Deals, 2021 and 2022
- Figure 53 : M&A Deals, 2021 and 2022
- Figure 54 : Strategic Alliance Deals, 2021 and 2022
- Figure 55 : Global Market Shares of Cell and Gene Therapy Drugs, by Company, 2022
- Figure 56 : Total Number of Clinical Trials, by Phase, 2023 (Q3)
- Figure 57 : Number of Cell and Gene Therapy Developers, by Region, 2023 (Q3)
- Figure 58 : ESG in Cell and Gene Therapy Industry
- Figure 59 : Amgen Inc.: Revenue Shares, by Business Unit, FY 2022
- Figure 60 : Amgen Inc.: Revenue Shares, by Country/Region, FY 2022
- Figure 61 : Bluebird Bio Inc.: Revenue Shares, by Business Unit, FY 2022
- Figure 62 : Bristol-Myers Squibb Co.: Revenue Shares, by Business Unit, FY 2022
- Figure 63 : Bristol-Myers Squibb Co.: Revenue Shares, by Country/Region, FY 2022
- Figure 64 : Ferring Pharmaceuticals: Revenue Shares, by Business Unit, FY 2022
- Figure 65 : Ferring Pharmaceuticals: Revenue Shares, by Country/Region, FY 2022
- Figure 66 : Gilead Sciences Inc.: Revenue Shares, by Business Unit, FY 2022
- Figure 67 : Gilead Sciences Inc.: Revenue Shares, by Country/Region, FY 2022
- Figure 68 : Johnson & Johnson Services Inc.: Revenue Shares, by Business Unit, FY 2022
- Figure 69 : Johnson & Johnson Services Inc.: Revenue Shares, by Country/Region, FY 2022
- Figure 70 : Mallinckrodt PLC: Revenue Shares, by Business Unit, FY 2022
- Figure 71 : Mallinckrodt PLC: Revenue Shares, by Country/Region, FY 2022
- Figure 72 : Novartis AG: Revenue Shares, by Business Unit, FY 2022
- Figure 73 : Novartis AG: Revenue Shares, by Country/Region, FY 2022
- Figure 74 : Orchard Therapeutic PLC: Revenue Shares, by Business Unit, FY 2022
- Figure 75 : Orchard Therapeutic PLC: Revenue Shares, by Country/Region, FY 2022
- Figure 76 : Vericel Corp.: Revenue Shares, by Business Unit, FY 2022
The global market for cell and gene therapy is expected to grow from $7.2 billion in 2023 and projected to reach $23.3 billion by the end of 2028, at a compound annual growth rate (CAGR) of 26.4% during the forecast period of 2023 to 2028.
The global market for gene therapy is expected to grow from $2.9 billion in 2023 and projected to reach $10.3 billion by the end of 2028, at a compound annual growth rate (CAGR) of 28.7% during the forecast period of 2023 to 2028.
The global market for gene modified cell therapy is expected to grow from $3.2 billion in 2023 and projected to reach $10.0 billion by the end of 2028, at a compound annual growth rate (CAGR) of 25.6% during the forecast period of 2023 to 2028.
Report Scope:
The scope of this study encompasses an investigation of the cell and gene therapy market. BCC Research analyzes cell and gene therapy market based on therapy type, product, application, and region. BCC determines the current market status in each segment, examines its impact on future needs, and presents growth forecasts over the next five years. The report provides a detailed analysis of the market's drivers, challenges, and opportunities. The report also covers market projections for 2028 and market shares for key market players. The report includes the company profiles of the key players with detailed information about their business segments, financials, product portfolios, and recent developments. The report also provides information on the emerging technologies, and new developments, ESG development and investment outlook.
Report Includes:
- 55 data tables and 26 additional tables
- An overview of the global market for cell and gene therapy
- Analysis of global market trends, featuring historical revenue data for 2020, 2021, and 2022, estimated figures for 2023, forecasts for 2028, and projections of compound annual growth rates (CAGRs) through 2028
- Evaluation of the current market's size and revenue growth prospects specific to cell and gene therapy, along with a market share analysis by therapy type, product, application, and geographic region
- An update on recent advances in vector biology, drug delivery technology and gene editing technologies such as CRISPR
- Coverage of novel therapeutic products and promising new technologies still in the development and testing stage, with as assessment of the probability that they will be commercialized successfully in the next five years
- Discussion on recent approvals, developments, emerging technologies, ESG, and an investment outlook
- Profiles of leading market participants, including Mallinckrodt PLC, Vericel Corp., Gilead Sciences Inc., Pharmicell Co. Ltd., and Bristol-Myers Squibb Co.
Table of Contents
Chapter 1 Executive Summary
- Market Outlook
- Scope of Report
- Market Summary
- Market Value
Chapter 2 Market Overview
- Cell and Gene Therapy Overview
- Regulatory Landscape
- U.S. (FDA)
- Europe
Chapter 3 Market Dynamics
- Market Dynamics
- Market Drivers
- Market Restraints
- Market Opportunities
Chapter 4 Market Segmentation Analysis
- Segmentation Breakdown
- Global Market for Cell and Gene Therapy
- Market Size and Forecast
- Market Analysis
- Cell Therapy
- Gene-modified Cell Therapy
- Gene Therapy
- Global Market for Gene-modified Cell Therapy and Gene Therapy by Vector Type
- Market Size and Forecast
- Market Analysis
- Adeno-Associated Viral (AAV) Vectors
- Retroviral Vectors
- Lentiviral Vectors
- Others
- Global Market for Cell and Gene Therapy by Drug Product
- Market Size and Forecast
- Zolgensma
- Yescarta
- Kymriah
- Abecma
- Maci
- Tecartus
- Epicel
- Others
- Global Market for Cell and Gene Therapy by Application
- Market Size and Forecast
- Oncology
- Rare Diseases
- Ophthalmology
- Other Therapeutic Areas
- Geographic Breakdown
- Global Market for Cell and Gene Therapy by Region
- Market Size and Forecast
- North America
- Market Size and Forecast
- U.S.
- Canada
- Mexico
- Europe
- Market Size and Forecast
- Germany
- U.K.
- France
- Rest of Europe
- Asia-Pacific
- Market Size and Forecast
- Japan
- Cina
- Australia
- Rest of Asia-Pacific
- Rest of the World
- Market Size and Forecast
Chapter 5 Competitive Intelligence
- Investment Outlook
- Mergers and Acquisitions
- Competitive Landscape: Overview
- Market Share Analysis
- Strategic Acquisitions and Collaborations
- Pipeline Analysis
Chapter 6 Sustainability: An ESG Perspective
- Introduction
- Conclusion
Chapter 7 Appendix
- Methodology
- Company Profiles
- AMGEN INC.
- BLUEBIRD BIO INC.
- BRISTOL-MYERS SQUIBB CO.
- DENDREON PHARMACEUTICALS LLC
- FERRING PHARMACEUTICALS
- GILEAD SCIENCES INC.
- IOVANCE BIOTHERAPEUTICS INC.
- JOHNSON & JOHNSON SERVICES INC.
- KRYSTAL BIOTECH INC.
- MALLINCKRODT PLC
- NOVARTIS AG
- ORCHARD THERAPEUTICS PLC.
- PHARMICELL CO. LTD.
- UNIQURE N.V.
- VERICEL CORP.
- Abbreviations
- References

