|
|
市場調査レポート
商品コード
1354729
分散型発電の世界市場The Global Market for Distributed Energy Generation |
||||||
|
|
|||||||
|
|||||||


| 分散型発電の世界市場 |
|
出版日: 2023年09月28日
発行: BCC Research
ページ情報: 英文 344 Pages
納期: 即納可能
|

- 全表示
- 概要
- 図表
- 目次
世界の分散型発電の市場規模は、2023年の1,413億米ドルから、予測期間中は11.3%のCAGRで推移し、2028年には2,416億米ドルの規模に成長すると予測されています。
地域別では、アジア太平洋市場が2023年の724億米ドルから、11.4%のCAGRで推移し、2028年には1,240億米ドルの規模に成長すると予測されています。また、欧州市場は、2023年の310億米ドルから、13.8%のCAGRで推移し、2028年には593億米ドルの規模に成長すると予測されています。
当レポートでは、世界の分散型発電の市場を調査し、市場および技術の概要、市場影響因子および市場機会の分析、市場規模の推移・予測、各種区分・地域別の詳細分析、技術および特許の動向、ESGの展開、競合情勢、主要企業のプロファイルなどをまとめています。
目次
第1章 イントロダクション
第2章 サマリー・ハイライト
- 市場概要
第3章 市場概要
- 再生可能エネルギーと分散型発電
- マイクログリッド
- 分散型発電の歴史
- 分散型発電の定義
- 分散型発電のサプライチェーン
- 材料製造業者および組立業者
- 機器OEM
- 特殊機器製造業者
- DG製造業者/組立業者
- 建設・設置請負業者
- 許可および環境の専門家
- エンドユーザー
- 市場の可能性
第4章 市場力学
- 概要
- 促進要因
- 市場の課題
- 市場機会
- ポーターのファイブフォース分析
- 世界の炭素排出シナリオ
- パリ協定
- 欧州グリーンディール
- COVID-19の世界の分散型発電市場への影響
- ロシア・ウクライナ戦争の分散型発電産業への影響
第5章 分散型発電市場:技術別
- 概要
- レシプロエンジン
- 市場の可能性
- 小水力発電
- 利点
- 欠点
- 市場の可能性
- 太陽光発電 (PV)
- PVシステムの利点
- PVシステムの欠点
- 市場の可能性
- 小型風力タービン
- DG風車タービンの利点
- DG風力タービンの欠点
- 市場の可能性
- 燃料電池
- 燃料電池のタイプ
- 市場の可能性
- 小型燃焼タービン
- 利点
- 欠点
- 市場の可能性
- マイクロタービン
- 利点
- 欠点
- 市場の可能性
第6章 分散型発電市場:地域別
- 概要
- アジア太平洋
- 中国
- インド
- 日本
- アジア太平洋のその他の地域
- 欧州
- ドイツ
- イタリア
- フランス
- 英国
- ロシア
- その他の欧州地域
- 北米
- 米国
- カナダ
- メキシコ
- 中東・アフリカ
- サウジアラビア
- UAE
- 南アフリカ
- 中東・アフリカのその他の地域
- 南米
- ブラジル
- チリ
- その他の南米地域
第7章 ESGの展開
- 分散型発電業界におけるESGの重要性
- ESG評価と指標:データの理解
- 分散型発電業界におけるESGの実践
- 環境スコア
- ソーシャルスコア
- ガバナンススコア
- 合計スコア
- リスク・エクスポージャ・管理スケール
- リスクスケール
- エクスポージャスケール
- 管理スケール
- ESGの未来:新たな動向と機会
- カーボンニュートラル
- ケーススタディ:ESG導入の成功例
- Cummins Inc.
- BCCによる総論
第8章 新たな技術と開発
- 熱電併給 (CHP)
- その他の技術
第9章 特許分析
第10章 競合情報
第11章 企業プロファイル
- ANSALDO ENERGIA S.P.A.
- BLOOM ENERGY
- CATERPILLAR ENERGY SOLUTIONS GMBH
- CUMMINS INC.
- DOOSAN ENERBILITY
- ENGIE SA
- GENERAL ELECTRIC
- MITSUBISHI HEAVY INDUSTRIES LTD.
- ROLLS-ROYCE
- SIEMENS ENERGY AG
第12章 付録
List of Tables
- Summary Table : Global Market for Distributed Energy Generation, by Region, Through 2028
- Table 1 : Conventional Power Plant Generation Capacities
- Table 2 : Energy Sources for Distributed Generation
- Table 3 : Energy Sources for Distributed Generation Technologies
- Table 4 : Average Levelized Electricity Costs (LEC) of Distributed PV Systems, by Country, 2023
- Table 5 : Average Levelized Electricity Costs (LEC) in the U.S., by Power Plant Type, 2023
- Table 6 : Pounds of CO2 Emitted Per Million BTU of Energy for Fuels, 2023
- Table 7 : Post-2020 National Emission Reduction, by Country, 2023
- Table 8 : CO2 Emissions by Fossil Fuels, by Country, 2020
- Table 9 : Policy Changes for Renewable Energy Generation Targets, 2023
- Table 10 : Characteristics of Select Distributed Generation Technologies
- Table 11 : Global Market for Distributed Energy Generation, by Technology, Through 2028
- Table 12 : Global Market Volume of Distributed Energy Generation, by Technology, Through 2028
- Table 13 : Reciprocating Engine Characteristics
- Table 14 : Global Market for Distributed Reciprocating Engines, by Region, Through 2028
- Table 15 : Global Market Volume of Distributed Reciprocating Engines, by Region, Through 2028
- Table 16 : APAC Market for Distributed Reciprocating Engines, by Country, Through 2028
- Table 17 : APAC Market Volume of Distributed Reciprocating Engines, by Country, Through 2028
- Table 18 : European Market for Distributed Reciprocating Engines, by Country, Through 2028
- Table 19 : European Market Volume of Distributed Reciprocating Engines, by Country, Through 2028
- Table 20 : North American Market for Distributed Reciprocating Engines, by Country, Through 2028
- Table 21 : North American Market Volume of Distributed Reciprocating Engines, by Country, Through 2028
- Table 22 : MEA Market for Distributed Reciprocating Engines, by Country, Through 2028
- Table 23 : MEA Market Volume of Distributed Reciprocating Engines, by Country, Through 2028
- Table 24 : South American Market for Distributed Reciprocating Engines, by Country, Through 2028
- Table 25 : South American Market Volume of Distributed Reciprocating Engines, by Country, Through 2028
- Table 26 : Small Hydropower Characteristics
- Table 27 : Global Market for Distributed Small Hydropower, by Region, Through 2028
- Table 28 : Global Market Volume of Distributed Small Hydropower, by Region, Through 2028
- Table 29 : APAC Market for Distributed Small Hydropower, by Country, Through 2028
- Table 30 : APAC Market Volume of Distributed Small Hydropower, by Country, Through 2028
- Table 31 : European Market for Distributed Small Hydropower, by Country, Through 2028
- Table 32 : European Market Volume of Distributed Small Hydropower, by Country, Through 2028
- Table 33 : North American Market for Distributed Small Hydropower, by Country, Through 2028
- Table 34 : North American Market Volume of Distributed Small Hydropower, by Country, Through 2028
- Table 35 : MEA Market for Distributed Small Hydropower, by Country, Through 2028
- Table 36 : MEA Market Volume of Distributed Small Hydropower, by Country, Through 2028
- Table 37 : South American Market for Distributed Small Hydropower, by Country, Through 2028
- Table 38 : South American Market Volume of Distributed Small Hydropower, by Country, Through 2028
- Table 39 : Solar Photovoltaics Characteristics
- Table 40 : Global Market for Distributed Solar Photovoltaics, by Region, Through 2028
- Table 41 : Global Market Volume of Distributed Solar Photovoltaics, by Region, Through 2028
- Table 42 : APAC Market for Distributed Solar Photovoltaics, by Country, Through 2028
- Table 43 : APAC Market Volume of Distributed Solar Photovoltaics, by Country, Through 2028
- Table 44 : European Market for Distributed Solar Photovoltaics, by Country, Through 2028
- Table 45 : European Market Volume of Distributed Solar Photovoltaics, by Country, Through 2028
- Table 46 : North American Market for Distributed Solar Photovoltaics, by Country, Through 2028
- Table 47 : North American Market Volume of Distributed Solar Photovoltaics, by Country, Through 2028
- Table 48 : MEA Market for Distributed Solar Photovoltaics, by Country, Through 2028
- Table 49 : MEA Market Volume of Distributed Solar Photovoltaics, by Country, Through 2028
- Table 50 : South American Market for Distributed Solar Photovoltaics, by Country, Through 2028
- Table 51 : South American Market Volume of Distributed Solar Photovoltaics, by Country, Through 2028
- Table 52 : Small Wind Turbine Characteristics
- Table 53 : Global Market for Distributed Small Wind Turbines, by Region, Through 2028
- Table 54 : Global Market Volume of Distributed Small Wind Turbines, by Region, Through 2028
- Table 55 : APAC Market for Distributed Small Wind Turbines, by Country, Through 2028
- Table 56 : APAC Market Volume of Distributed Small Wind Turbines, by Country, Through 2028
- Table 57 : European Market for Distributed Small Wind Turbines, by Country, Through 2028
- Table 58 : European Market Volume of Distributed Small Wind Turbines, by Country, Through 2028
- Table 59 : North American Market for Distributed Small Wind Turbines, by Country, Through 2028
- Table 60 : North American Market Volume of Distributed Small Wind Turbines, by Country, Through 2028
- Table 61 : MEA Market for Distributed Small Wind Turbines, by Country, Through 2028
- Table 62 : MEA Market Volume of Distributed Small Wind Turbines, by Country, Through 2028
- Table 63 : South American Market for Distributed Small Wind Turbines, by Country, Through 2028
- Table 64 : South American Market Volume of Distributed Small Wind Turbines, by Country, Through 2028
- Table 65 : Fuel Cell Characteristics
- Table 66 : Comparison of Various Fuel Cell Technologies
- Table 67 : Fuel Cell Regional Market Players
- Table 68 : Global Market for Distributed Fuel Cells, by Region, Through 2028
- Table 69 : Global Market Volume of Distributed Fuel Cells, by Region, Through 2028
- Table 70 : Global Market for Distributed Fuel Cells, by Technology, Through 2028
- Table 71 : EGY061D
- Table 72 : APAC Market Volume of Distributed Fuel Cells, by Country, Through 2028
- Table 73 : European Market for Distributed Fuel Cells, by Country, Through 2028
- Table 74 : European Market Volume of Distributed Fuel Cells, by Country, Through 2028
- Table 75 : North American Market for Distributed Fuel Cells, by Country, Through 2028
- Table 76 : North American Market Volume of Distributed Fuel Cells, by Country, Through 2028
- Table 77 : MEA Market for Distributed Fuel Cells, by Country, Through 2028
- Table 78 : MEA Market Volume of Distributed Fuel Cells, by Country, Through 2028
- Table 79 : South American Market for Distributed Fuel Cells, by Country, Through 2028
- Table 80 : South American Market Volume of Distributed Fuel Cells, by Country, Through 2028
- Table 81 : Small Combustion Turbine Characteristics
- Table 82 : Global Market for Distributed Small Combustion Turbines, by Region, Through 2028
- Table 83 : Global Market Volume of Distributed Small Combustion Turbines, by Region, Through 2028
- Table 84 : APAC Market for Distributed Small Combustion Turbines, by Country, Through 2028
- Table 85 : APAC Market Volume of Distributed Small Combustion Turbines, by Country, Through 2028
- Table 86 : European Market for Distributed Small Combustion Turbines, by Country, Through 2028
- Table 87 : European Market Volume of Distributed Small Combustion Turbines, by Country, Through 2028
- Table 88 : North American Market for Distributed Small Combustion Turbines, by Country, Through 2028
- Table 89 : North American Market Volume of Distributed Small Combustion Turbines, by Country, Through 2028
- Table 90 : MEA Market for Distributed Small Combustion Turbines, by Country, Through 2028
- Table 91 : MEA Market Volume of Distributed Small Combustion Turbines, by Country, Through 2028
- Table 92 : South American Market for Distributed Small Combustion Turbines, by Country, Through 2028
- Table 93 : South American Market Volume of Distributed Small Combustion Turbines, by Country, Through 2028
- Table 94 : Microturbine Characteristics
- Table 95 : Global Market for Distributed Microturbines, by Region, Through 2028
- Table 96 : Global Market Volume of Distributed Microturbines, by Region, Through 2028
- Table 97 : APAC Market for Distributed Microturbines, by Country, Through 2028
- Table 98 : APAC Market Volume of Distributed Microturbines, by Country, Through 2028
- Table 99 : European Market for Distributed Microturbines, by Country, Through 2028
- Table 100 : European Market Volume of Distributed Microturbines, by Country, Through 2028
- Table 101 : North American Market for Distributed Microturbines, by Country, Through 2028
- Table 102 : North American Market Volume of Distributed Microturbines, by Country, Through 2028
- Table 103 : MEA Market for Distributed Microturbines, by Country, Through 2028
- Table 104 : MEA Market Volume of Distributed Microturbines, by Country, Through 2028
- Table 105 : South American Market for Distributed Microturbines, by Country, Through 2028
- Table 106 : South American Market Volume of Distributed Microturbines, by Country, Through 2028
- Table 107 : Global Market for Distributed Energy Generation, by Region, Through 2028
- Table 108 : Global Market Volume of Distributed Energy Generation, by Region, Through 2028
- Table 109 : APAC Market for Distributed Energy Generation, by Technology, Through 2028
- Table 110 : APAC Market Volume of Distributed Energy Generation, by Technology, Through 2028
- Table 111 : APAC Market for Distributed Energy Generation, by Country, Through 2028
- Table 112 : APAC Market Volume of Distributed Energy Generation, by Country, Through 2028
- Table 113 : Chinese Market for Distributed Energy Generation, by Technology, Through 2028
- Table 114 : Chinese Market Volume of Distributed Energy Generation, by Technology, Through 2028
- Table 115 : Indian Market for Distributed Energy Generation, by Technology, Through 2028
- Table 116 : Indian Market Volume of Distributed Energy Generation, by Technology, Through 2028
- Table 117 : Japanese Market for Distributed Energy Generation, by Technology, Through 2028
- Table 118 : Japanese Market Volume of Distributed Energy Generation, by Technology, Through 2028
- Table 119 : Rest of APAC Market for Distributed Energy Generation, by Technology, Through 2028
- Table 120 : Rest of APAC Market Volume of Distributed Energy Generation, by Technology, Through 2028
- Table 121 : European Market for Distributed Energy Generation, by Technology, Through 2028
- Table 122 : European Market Volume of Distributed Energy Generation, by Technology, Through 2028
- Table 123 : European Market for Distributed Energy Generation, by Country, Through 2028
- Table 124 : European Market Volume of Distributed Energy Generation, by Country, Through 2028
- Table 125 : German Market for Distributed Energy Generation, by Technology, Through 2028
- Table 126 : German Market Volume of Distributed Energy Generation, by Technology, Through 2028
- Table 127 : Italian Market for Distributed Energy Generation, by Technology, Through 2028
- Table 128 : Italian Market Volume of Distributed Energy Generation, by Technology, Through 2028
- Table 129 : French Market for Distributed Energy Generation, by Technology, Through 2028
- Table 130 : French Market Volume of Distributed Energy Generation, by Technology, Through 2028
- Table 131 : U.K. Market for Distributed Energy Generation, by Technology, Through 2028
- Table 132 : U.K. Market Volume of Distributed Energy Generation, by Technology, Through 2028
- Table 133 : Russian Market for Distributed Energy Generation, by Technology, Through 2028
- Table 134 : Russian Market Volume of Distributed Energy Generation, by Technology, Through 2028
- Table 135 : Rest of European Market for Distributed Energy Generation, by Technology, Through 2028
- Table 136 : Rest of European Market Volume of Distributed Energy Generation, by Technology, Through 2028
- Table 137 : North American Market for Distributed Energy Generation, by Technology, Through 2028
- Table 138 : North American Market Volume of Distributed Energy Generation, by Technology, Through 2028
- Table 139 : North American Market for Distributed Energy Generation, by Country, Through 2028
- Table 140 : North American Market Volume of Distributed Energy Generation, by Country, Through 2028
- Table 141 : U.S. Market for Distributed Energy Generation, by Technology, Through 2028
- Table 142 : U.S. Market Volume of Distributed Energy Generation, by Technology, Through 2028
- Table 143 : Canadian Market for Distributed Energy Generation, by Technology, Through 2028
- Table 144 : Canadian Market Volume of Distributed Energy Generation, by Technology, Through 2028
- Table 145 : Mexican Market for Distributed Energy Generation, by Technology, Through 2028
- Table 146 : Mexican Market Volume of Distributed Energy Generation, by Technology, Through 2028
- Table 147 : MEA Market for Distributed Energy Generation, by Technology, Through 2028
- Table 148 : MEA Market Volume of Distributed Energy Generation, by Technology, Through 2028
- Table 149 : MEA Market for Distributed Energy Generation, by Country, Through 2028
- Table 150 : MEA Market Volume of Distributed Energy Generation, by Country, Through 2028
- Table 151 : Saudi Arabian Market for Distributed Energy Generation, by Technology, Through 2028
- Table 152 : Saudi Arabian Market Volume of Distributed Energy Generation, by Technology, Through 2028
- Table 153 : UAE Market for Distributed Energy Generation, by Technology, Through 2028
- Table 154 : UAE Market Volume of Distributed Energy Generation, by Technology, Through 2028
- Table 155 : South African Market for Distributed Energy Generation, by Technology, Through 2028
- Table 156 : South African Market Volume of Distributed Energy Generation, by Technology, Through 2028
- Table 157 : Rest of MEA Market for Distributed Energy Generation, by Technology, Through 2028
- Table 158 : Rest of MEA Market Volume of Distributed Energy Generation, by Technology, Through 2028
- Table 159 : South American Market for Distributed Energy Generation, by Technology, Through 2028
- Table 160 : South American Market Volume of Distributed Energy Generation, by Technology, Through 2028
- Table 161 : South American Market for Distributed Energy Generation, by Country, Through 2028
- Table 162 : South American Market Volume of Distributed Energy Generation, by Country, Through 2028
- Table 163 : Brazilian Market for Distributed Energy Generation, by Technology, Through 2028
- Table 164 : Brazilian Market Volume of Distributed Energy Generation, by Technology, Through 2028
- Table 165 : Chilean Market for Distributed Energy Generation, by Technology, Through 2028
- Table 166 : Chilean Market Volume of Distributed Energy Generation, by Technology, Through 2028
- Table 167 : Rest of South American Market for Distributed Energy Generation, by Technology, Through 2028
- Table 168 : Rest of South American Market Volume of Distributed Energy Generation, by Technology, Through 2028
- Table 169 : ESG Ratings & Metrics
- Table 170 : ESG Practices
- Table 171 : Current Status of ESG in the Market for Distributed Energy Generation
- Table 172 : Risk Scale, Exposure Scale and Management Scale
- Table 173 : CHP Characteristics
- Table 174 : Ansaldo Energia: Number of Active Patents, 2023
- Table 175 : Ballard Power Systems: Number of Active Patents, 2023
- Table 176 : Bloom Energy: Number of Active Patents, 2023
- Table 177 : Briggs & Stratton: Number of Active Patents, 2023
- Table 178 : Calnetix: Number of Active Patents, 2023
- Table 179 : Caterpillar Inc.: Number of Active Patents, 2023
- Table 180 : Cummins Inc.: Number of Active Patents, 2023
- Table 181 : Deutz: Number of Active Patents, 2023
- Table 182 : Doosan Enerbility: Number of Active Patents, 2023
- Table 183 : ENGIE SA: Number of Active Patents, 2023
- Table 184 : General Electric: Number of Active Patents, 2023
- Table 185 : Deere & Company: Number of Active Patents, 2023
- Table 186 : Kawasaki Heavy Industries: Number of Active Patents, 2023
- Table 187 : Mitsubishi Electric: Number of Active Patents, 2023
- Table 188 : Plug Power Inc.: Number of Active Patents, 2023
- Table 189 : Rolls-Royce Inc.: Number of Active Patents, 2023
- Table 190 : Schneider Electric: Number of Active Patents, 2023
- Table 191 : Siemens Inc.: Number of Active Patents, 2023
- Table 192 : Wartsila: Number of Active Patents, 2023
- Table 193 : List of Market Players
- Table 194 : M&A in Distributed Energy Generation Industry, 2019-2023
- Table 195 : Ansaldo Energia: Annual Revenue, 2021
- Table 196 : Ansaldo Energia: News, 2019-2023
- Table 197 : Bloom Energy: Annual Revenue, 2022
- Table 198 : Bloom Energy: News, 2021-2023
- Table 199 : Caterpillar Energy Solutions GmbH: Annual Revenue, 2022
- Table 200 : Caterpillar Energy Solutions GmbH: News, 2021-2023
- Table 201 : Cummins Inc.: Annual Revenue, 2022
- Table 202 : Cummins Inc.: News, 2020-2023
- Table 203 : Doosan Enerbility: Annual Revenue, 2022
- Table 204 : Doosan Enerbility: News, 2023
- Table 205 : ENGIE SA: Annual Revenue, 2022
- Table 206 : ENGIE SA: News, 2022 and 2023
- Table 207 : General Electric: Annual Revenue, 2022
- Table 208 : General Electric: News, 20118-2022
- Table 209 : Mitsubishi Heavy Industries Ltd.: Annual Revenue, 2022
- Table 210 : Mitsubishi Heavy Industries Ltd.: News, 2020-2022
- Table 211 : Rolls-Royce: Annual Revenue, 2022
- Table 212 : Rolls-Royce: News, 2020-2023
- Table 213 : Siemens Energy AG: Annual Revenue, 2022
- Table 214 : Siemens Energy AG: News, 2020-2023
- Table 215 : Acronyms Used in This Report
List of Figures
- Summary Figure A : Global Market Shares of Distributed Energy Generation, by Region, 2022
- Summary Figure B : Global Market Shares of Distributed Energy Generation, by Technology, 2022
- Figure 1 : Distributed Energy Generation Supply Chain Analysis
- Figure 2 : Global Market for Distributed Energy Generation, 2022-2028
- Figure 3 : Global Market Volume of Distributed Energy Generation, 2022-2028
- Figure 4 : Impact of Market Dynamics
- Figure 5 : Global Share of Power Generation Sources, 2015-2021
- Figure 6 : Renewable Electricity Capacity Increase by Region/Country, 2015-2020 and 2021-2026
- Figure 7 : Porter's Five Forces Analysis: Market for Distributed Energy Generation
- Figure 8 : Annual CO2 Emissions, by Fossil Fuels, 2015-2022
- Figure 9 : Natural Gas Prices, 1984-2021
- Figure 10 : Global Market Shares of Distributed Energy Generation, by Technology, 2022
- Figure 11 : Global Market Shares of Distributed Energy Generation, by Technology, 2028
- Figure 12 : Global Market Volume Shares of Distributed Energy Generation, by Technology, 2022
- Figure 13 : Global Market Volume Shares of Distributed Energy Generation, by Technology, 2028
- Figure 14 : Global Market Shares of Distributed Reciprocating Engines, by Region, 2022
- Figure 15 : Global Market Shares of Distributed Reciprocating Engines, by Region, 2028
- Figure 16 : Global Market Volume Shares of Distributed Reciprocating Engines, by Region, 2022
- Figure 17 : Global Market Volume Shares of of Distributed Reciprocating Engines, by Region, 2028
- Figure 18 : APAC Market Shares of Distributed Reciprocating Engines, by Country, 2022
- Figure 19 : APAC Market Volume Shares of Distributed Reciprocating Engines, by Country, 2022
- Figure 20 : European Market Shares of Distributed Reciprocating Engines, by Country, 2022
- Figure 21 : European Market Volume Shares of Distributed Reciprocating Engines, by Country, 2022
- Figure 22 : North American Market Shares of Distributed Reciprocating Engines, by Country, 2022
- Figure 23 : North American Market Volume Shares of Distributed Reciprocating Engines, by Country, 2022
- Figure 24 : MEA Market Shares of Distributed Reciprocating Engines, by Country, 2022
- Figure 25 : MEA Market Volume Shares of Distributed Reciprocating Engines, by Country, 2022
- Figure 26 : South American Market Shares of Distributed Reciprocating Engines, by Country, 2022
- Figure 27 : South American Market Volume Shares of Distributed Reciprocating Engines, by Country, 2022
- Figure 28 : Global Market Shares of Distributed Small Hydropower, by Region, 2022
- Figure 29 : Global Market Shares of Distributed Small Hydropower, by Region, 2028
- Figure 30 : Global Market Volume Shares of Distributed Small Hydropower, by Region, 2022
- Figure 31 : Global Market Volume Shares of Distributed Small Hydropower, by Region, 2028
- Figure 32 : APAC Market Shares of Distributed Small Hydropower, by Country, 2022
- Figure 33 : APAC Market Volume Shares of Distributed Small Hydropower, by Country, 2022
- Figure 34 : European Market Shares of Distributed Small Hydropower, by Country, 2022
- Figure 35 : European Market Volume Shares of Distributed Small Hydropower, by Country, 2022
- Figure 36 : North American Market Shares of Distributed Small Hydropower, by Country, 2022
- Figure 37 : North American Market Volume Shares of Distributed Small Hydropower, by Country, 2022
- Figure 38 : South American Market Shares of Distributed Small Hydropower, by Country, 2022
- Figure 39 : South American Market Volume Shares of Distributed Small Hydropower, by Country, 2022
- Figure 40 : Annual Distributed PV Capacity Additions, by Volume, 2022
- Figure 41 : Global Market Shares of Distributed Solar Photovoltaics, by Region, 2022
- Figure 42 : Global Market Shares of Distributed Solar Photovoltaics, by Region, 2028
- Figure 43 : Global Market Volume Shares of Distributed Solar Photovoltaics, by Region, 2022
- Figure 44 : Global Market Volume Shares of Distributed Solar Photovoltaics, by Region, 2028
- Figure 45 : APAC Market Shares of Distributed Solar Photovoltaics, by Country, 2022
- Figure 46 : APAC Market Volume Shares of Distributed Solar Photovoltaics, by Country, 2022
- Figure 47 : European Market Shares of Distributed Solar Photovoltaics, by Country, 2022
- Figure 48 : European Market Volume Shares of Distributed Solar Photovoltaics, by Country, 2022
- Figure 49 : North American Market Shares of Distributed Solar Photovoltaics, by Country, 2022
- Figure 50 : North American Market Volume Shares of Distributed Solar Photovoltaics, by Country, 2022
- Figure 51 : MEA Market Shares of Distributed Solar Photovoltaics, by Country, 2022
- Figure 52 : MEA Market Volume Shares of Distributed Solar Photovoltaics, by Country, 2022
- Figure 53 : South American Market Shares of Distributed Solar Photovoltaics, by Country, 2022
- Figure 54 : South American Market Volume Shares of Distributed Solar Photovoltaics, by Country, 2022
- Figure 55 : Global Market for Distributed Small Wind Turbines Share, by Region, 2022
- Figure 56 : Global Market for Distributed Small Wind Turbines Share, by Region, 2028
- Figure 57 : Global Market Volume Shares of Distributed Small Wind Turbines, by Region, 2022
- Figure 58 : Global Market Volume Shares of Distributed Small Wind Turbines, by Region, 2028
- Figure 59 : APAC Market for Distributed Small Wind Turbines Share, by Country, 2022
- Figure 60 : APAC Market Volume Shares of Distributed Small Wind Turbines, by Country, 2022
- Figure 61 : European Market for Distributed Small Wind Turbines Share, by Country, 2022
- Figure 62 : European Market Volume Shares of Distributed Small Wind Turbines, by Country, 2022
- Figure 63 : North American Market for Distributed Small Wind Turbines Share, by Country, 2022
- Figure 64 : North American Market Volume Shares of Distributed Small Wind Turbines, by Country, 2022
- Figure 65 : MEA Market for Distributed Small Wind Turbines Share, by Country, 2022
- Figure 66 : MEA Market Volume Shares of Distributed Small Wind Turbines, by Country, 2022
- Figure 67 : South American Market for Distributed Small Wind Turbines Share, by Country, 2022
- Figure 68 : South American Market Volume Shares of Distributed Small Wind Turbines, by Country, 2022
- Figure 69 : Global Market Shares of Distributed Fuel Cells, by Region, 2022
- Figure 70 : Global Market Shares of Distributed Fuel Cells, by Region, 2028
- Figure 71 : Global Market Volume Shares of Distributed Fuel Cells, by Region, 2022
- Figure 72 : Global Market Volume Shares of Distributed Fuel Cells, by Region, 2028
- Figure 73 : Global Market Shares of Distributed Fuel Cells, by Technology, 2022
- Figure 74 : Global Market Shares of Distributed Fuel Cells, by Technology, 2028
- Figure 75 : APAC Market Shares of Distributed Fuel Cells, by Country, 2022
- Figure 76 : APAC Market Volume Shares of Distributed Fuel Cells, by Country, 2022
- Figure 77 : European Market Shares of Distributed Fuel Cells, by Country, 2022
- Figure 78 : European Market Volume Shares of Distributed Fuel Cells, by Country, 2022
- Figure 79 : North American Market Shares of Distributed Fuel Cells, by Country, 2022
- Figure 80 : North American Market Volume Shares of Distributed Fuel Cells, by Country, 2022
- Figure 81 : MEA Market Shares of Distributed Fuel Cells, by Country, 2022
- Figure 82 : MEA Market Volume Shares of Distributed Fuel Cells, by Country, 2022
- Figure 83 : South American Market Shares of Distributed Fuel Cells, by Country, 2022
- Figure 84 : South American Market Volume Shares of Distributed Fuel Cells, by Country, 2022
- Figure 85 : Global Market Shares of Distributed Small Combustion Turbines, by Region, 2022
- Figure 86 : Global Market Shares of Distributed Small Combustion Turbines, by Region, 2028
- Figure 87 : Global Market Volume Shares of Distributed Small Combustion Turbines, by Region, 2022
- Figure 88 : Global Market Volume Shares of Distributed Small Combustion Turbines, by Region, 2028
- Figure 89 : APAC Market Shares of Distributed Small Combustion Turbines, by Country, 2022
- Figure 90 : APAC Market Volume Shares of Distributed Small Combustion Turbines, by Country, 2022
- Figure 91 : European Market Shares of Distributed Small Combustion Turbines, by Country, 2022
- Figure 92 : European Market Volume Shares of Distributed Small Combustion Turbines, by Country, 2022
- Figure 93 : North American Market Shares of Distributed Small Combustion Turbines, by Country, 2022
- Figure 94 : North American Market Volume Shares of Distributed Small Combustion Turbines, by Country, 2022
- Figure 95 : MEA Market Shares of Distributed Small Combustion Turbines, by Country, 2022
- Figure 96 : MEA Market Volume Shares of Distributed Small Combustion Turbines, by Country, 2022
- Figure 97 : South American Market Shares of Distributed Small Combustion Turbines, by Country, 2022
- Figure 98 : South American Market Volume Shares of Distributed Small Combustion Turbines, by Country, 2022
- Figure 99 : Microturbine Configuration for CHP
- Figure 100 : Global Market Shares of Distributed Microturbines, by Region, 2022
- Figure 101 : Global Market Shares of Distributed Microturbines, by Region, 2028
- Figure 102 : Global Market Volume Shares of Distributed Microturbines, by Region, 2022
- Figure 103 : Global Market Volume Shares of Distributed Microturbines, by Region, 2028
- Figure 104 : APAC Market Shares of Distributed Microturbines, by Country, 2022
- Figure 105 : APAC Market Volume Shares of Distributed Microturbines, by Country, 2022
- Figure 106 : European Market Shares of Distributed Microturbines, by Country, 2022
- Figure 107 : European Market Volume Shares of Distributed Microturbines, by Country, 2022
- Figure 108 : North American Market Shares of Distributed Microturbines, by Country, 2022
- Figure 109 : North American Market Volume Shares of Distributed Microturbines, by Country, 2022
- Figure 110 : MEA Market Shares of Distributed Microturbines, by Country, 2022
- Figure 111 : MEA Market Volume Shares of Distributed Microturbines, by Country, 2022
- Figure 112 : South American Market Shares of Distributed Microturbines, by Country, 2022
- Figure 113 : South American Market Volume Shares of Distributed Microturbines, by Country, 2022
- Figure 114 : Global Market Shares of Distributed Energy Generation, by Region, 2022
- Figure 115 : Global Market Shares of Distributed Energy Generation, by Region, 2028
- Figure 116 : Global Market Volume Shares of Distributed Energy Generation, by Region, 2022
- Figure 117 : Global Market Volume Shares of Distributed Energy Generation, by Region, 2028
- Figure 118 : APAC Market for Distributed Energy Generation, 2022-2028
- Figure 119 : APAC Market Volume of Distributed Energy Generation, 2022-2028
- Figure 120 : APAC Market Shares of Distributed Energy Generation, by Technology, 2022
- Figure 121 : APAC Market Shares of Distributed Energy Generation, by Technology, 2028
- Figure 122 : APAC Market Volume Shares of Distributed Energy Generation, by Technology, 2022
- Figure 123 : APAC Market Volume Shares of Distributed Energy Generation, by Technology, 2028
- Figure 124 : APAC Market Shares of Distributed Energy Generation, by Country, 2022
- Figure 125 : APAC Market Shares of Distributed Energy Generation, by Country, 2028
- Figure 126 : APAC Market Volume Shares of Distributed Energy Generation, by Country, 2022
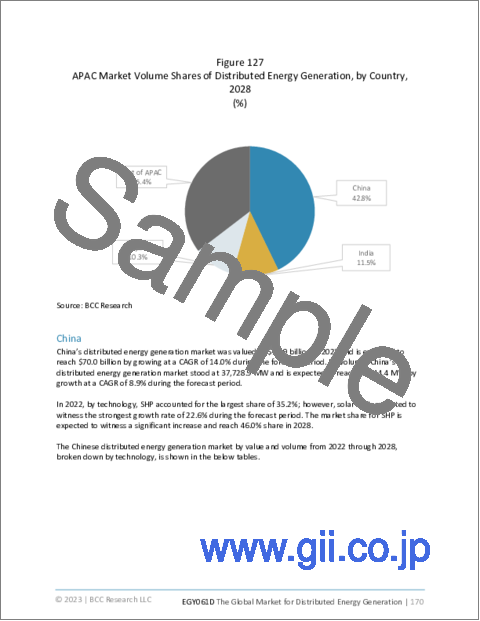
- Figure 127 : APAC Market Volume Shares of Distributed Energy Generation, by Country, 2028
- Figure 128 : Chinese Market Shares of Distributed Energy Generation, by Technology, 2022
- Figure 129 : Chinese Market Volume Shares of Distributed Energy Generation, by Technology, 2022
- Figure 130 : Indian Market Shares of Distributed Energy Generation, by Technology, 2022
- Figure 131 : Indian Market Volume Shares of Distributed Energy Generation, by Technology, 2022
- Figure 132 : Japanese Market Shares of Distributed Energy Generation, by Technology, 2022
- Figure 133 : Japanese Market Volume Shares of Distributed Energy Generation, by Technology, 2022
- Figure 134 : Rest of APAC Market Shares of Distributed Energy Generation, by Technology, 2022
- Figure 135 : Rest of APAC Market Volume Shares of Distributed Energy Generation, by Technology, 2022
- Figure 136 : European Market for Distributed Energy Generation, 2022-2028
- Figure 137 : European Market Volume of Distributed Energy Generation, 2022-2028
- Figure 138 : European Market Shares of Distributed Energy Generation, by Technology, 2022
- Figure 139 : European Market Shares of Distributed Energy Generation, by Technology, 2028
- Figure 140 : European Market Volume Shares of Distributed Energy Generation, by Technology, 2022
- Figure 141 : European Market Volume Shares of Distributed Energy Generation, by Technology, 2028
- Figure 142 : European Market Shares of Distributed Energy Generation, by Country, 2022
- Figure 143 : European Market Shares of Distributed Energy Generation, by Country, 2028
- Figure 144 : European Market Volume Shares of Distributed Energy Generation, by Country, 2022
- Figure 145 : European Market Volume Shares of Distributed Energy Generation, by Country, 2028
- Figure 146 : German Market Shares of Distributed Energy Generation, by Technology, 2022
- Figure 147 : German Market Volume Shares of Distributed Energy Generation, by Technology, 2022
- Figure 148 : Italian Market Volume Shares of Distributed Energy Generation, by Technology, 2022
- Figure 149 : Italian Market Volume Shares of Distributed Energy Generation, by Technology, 2022
- Figure 150 : French Market Shares of Distributed Energy Generation, by Technology, 2022
- Figure 151 : French Market Volume Shares of Distributed Energy Generation, by Technology, 2022
- Figure 152 : U.K. Market Shares of Distributed Energy Generation, by Technology, 2022
- Figure 153 : U.K. Market Volume Shares of Distributed Energy Generation, by Technology, 2022
- Figure 154 : Russian Market Shares of Distributed Energy Generation, by Technology, 2022
- Figure 155 : Russian Market Volume Shares of Distributed Energy Generation, by Technology, 2022
- Figure 156 : Rest of European Market Shares of Distributed Energy Generation, by Technology, 2022
- Figure 157 : Rest of European Market Volume Shares of Distributed Energy Generation, by Technology, 2022
- Figure 158 : North American Market for Distributed Energy Generation, 2022-2028
- Figure 159 : North American Market Volume of Distributed Energy Generation, 2022-2028
- Figure 160 : North American Market Shares of Distributed Energy Generation, by Technology, 2022
- Figure 161 : North American Market Shares of Distributed Energy Generation, by Technology, 2028
- Figure 162 : North American Market Volume Shares of Distributed Energy Generation, by Technology, 2022
- Figure 163 : North American Market Volume Shares of Distributed Energy Generation, by Technology, 2028
- Figure 164 : North American Market Volume Shares of Distributed Energy Generation, by Country, 2022
- Figure 165 : North American Market Shares of Distributed Energy Generation, by Country, 2028
- Figure 166 : North American Market Volume Shares of Distributed Energy Generation, by Country, 2022
- Figure 167 : North American Market Volume Shares of Distributed Energy Generation, by Country, 2028
- Figure 168 : U.S. Market Shares of Distributed Energy Generation, by Technology, 2022
- Figure 169 : U.S. Market Volume Shares of Distributed Energy Generation, by Technology, 2022
- Figure 170 : Canadian Market Shares of Distributed Energy Generation, by Technology, 2022
- Figure 171 : Canadian Market Volume Shares of Distributed Energy Generation, by Technology, 2022
- Figure 172 : Mexican Market Shares of Distributed Energy Generation, by Technology, 2022
- Figure 173 : Mexican Market Volume Shares of Distributed Energy Generation, by Technology, 2022
- Figure 174 : MEA Market for Distributed Energy Generation, 2022-2028
- Figure 175 : MEA Market Volume of Distributed Energy Generation, 2022-2028
- Figure 176 : MEA Market Shares of Distributed Energy Generation, by Technology, 2022
- Figure 177 : MEA Market Shares of Distributed Energy Generation, by Technology, 2028
- Figure 178 : MEA Market Volume Shares of Distributed Energy Generation, by Technology, 2022
- Figure 179 : MEA Market Volume Shares of Distributed Energy Generation, by Technology, 2028
- Figure 180 : MEA Market Shares of Distributed Energy Generation, by Country, 2022
- Figure 181 : MEA Market Shares of Distributed Energy Generation, by Country, 2028
- Figure 182 : MEA Market Volume Shares of Distributed Energy Generation, by Country, 2022
- Figure 183 : MEA Market Volume Shares of Distributed Energy Generation, by Country, 2028
- Figure 184 : Saudi Arabian Market Shares of Distributed Energy Generation, by Technology, 2022
- Figure 185 : Saudi Arabian Market Volume Shares of Distributed Energy Generation, by Technology, 2022
- Figure 186 : UAE Market Shares of Distributed Energy Generation, by Technology, 2022
- Figure 187 : UAE Market Volume Shares of Distributed Energy Generation, by Technology, 2022
- Figure 188 : South African Market Shares of Distributed Energy Generation, by Technology, 2022
- Figure 189 : South African Market Volume Shares of Distributed Energy Generation, by Technology, 2022
- Figure 190 : Rest of MEA Market Shares of Distributed Energy Generation, by Technology, 2022
- Figure 191 : Rest of MEA Market Volume Shares of Distributed Energy Generation, by Technology, 2022
- Figure 192 : South American Market for Distributed Energy Generation, 2022-2028
- Figure 193 : South American Market Volume of Distributed Energy Generation, 2022-2028
- Figure 194 : South American Market Shares of Distributed Energy Generation, by Technology, 2022
- Figure 195 : South American Market Shares of Distributed Energy Generation, by Technology, 2028
- Figure 196 : South American Market Volume Shares of Distributed Energy Generation, by Technology, 2022
- Figure 197 : South American Market Volume Shares of Distributed Energy Generation, by Technology, 2028
- Figure 198 : South American Market Shares of Distributed Energy Generation, by Country, 2022
- Figure 199 : South American Market Shares of Distributed Energy Generation, by Country, 2028
- Figure 200 : South American Market Volume Shares of Distributed Energy Generation, by Country, 2022
- Figure 201 : South American Market Volume Shares of Distributed Energy Generation, by Country, 2028
- Figure 202 : Brazilian Market Shares of Distributed Energy Generation, by Technology, 2022
- Figure 203 : Brazilian Market Volume Shares of Distributed Energy Generation, by Technology, 2022
- Figure 204 : Chilean Market Shares of Distributed Energy Generation, by Technology, 2022
- Figure 205 : Chilean Market Volume Shares of Distributed Energy Generation, by Technology, 2022
- Figure 206 : Rest of South American Market Shares of Distributed Energy Generation, by Technology, 2022
- Figure 207 : Rest of South American Market Volume Shares of Distributed Energy Generation, by Technology, 2022
- Figure 208 : ESG Issues in the Market for Distributed Energy Generation
- Figure 209 : Environmental Score of Major Companies
- Figure 210 : Social Score of Major Companies
- Figure 211 : Governance Score of Major Companies
- Figure 212 : Total ESG Score of Major Companies
- Figure 213 : Ansaldo Energia: Annual Revenue, 2020 and 2021
- Figure 214 : Ansaldo Energia: Revenue Shares, by Business Unit, 2021
- Figure 215 : Ansaldo Energia: Revenue Shares, by Country/Region, 2021
- Figure 216 : Bloom Energy: Annual Revenue, 2021 and 2022
- Figure 217 : Bloom Energy: Revenue Shares, by Business Unit, 2022
- Figure 218 : Caterpillar Energy Solutions GmbH: Annual Revenue, 2021 and 2022
- Figure 219 : Caterpillar Energy Solutions GmbH: Revenue Shares, by Business Unit, 2022
- Figure 220 : Caterpillar Energy Solutions GmbH: Revenue Shares, by Country/Region, 2022
- Figure 221 : Cummins Inc.: Annual Revenue, 2021 and 2022
- Figure 222 : Cummins Inc.: Revenue Shares, by Business Unit, 2022
- Figure 223 : Cummins Inc.: Revenue Shares, by Country/Region, 2022
- Figure 224 : Doosan Enerbility: Annual Revenue, 2021 and 2022
- Figure 225 : Doosan Enerbility: Revenue Shares, by Country/Region, 2022
- Figure 226 : ENGIE SA: Annual Revenue, 2021 and 2022
- Figure 227 : ENGIE SA: Revenue Shares, by Business Unit, 2022
- Figure 228 : ENGIE SA: Revenue Shares, by Country/Region, 2022
- Figure 229 : General Electric: Annual Revenue, 2021 and 2022
- Figure 230 : Company annual report
- Figure 231 : General Electric: Revenue Shares, by Country/Region, 2022
- Figure 232 : Mitsubishi Heavy Industries Ltd.: Annual Revenue, 2021 and 2022
- Figure 233 : Mitsubishi Heavy Industries Ltd.: Revenue Shares, by Business Unit, 2022
- Figure 234 : Mitsubishi Heavy Industries Ltd.: Revenue Shares, by Country/Region, 2022
- Figure 235 : Rolls-Royce: Annual Revenue, 2021 and 2022
- Figure 236 : Rolls-Royce: Revenue Shares, by Business Unit, 2022
- Figure 237 : Rolls-Royce: Revenue Shares, by Country/Region, 2022
- Figure 238 : Siemens Energy AG: Annual Revenue, 2021 and 2022
- Figure 239 : Siemens Energy AG: Revenue Shares, by Business Unit, 2022
- Figure 240 : Siemens Energy AG: Revenue Shares, by Country/Region, 2022
Highlights:
The global market for distributed energy generation is estimated to increase from $141.3 billion in 2023 to reach $241.6 billion by 2028 with a compound annual growth rate (CAGR) of 11.3% during the forecast period of 2023-2028.
APAC market for distributed energy generation is estimated to increase from $72.4 billion in 2023 to reach $124.0 billion by 2028 with a CAGR of 11.4% during the forecast period of 2023-2028.
European market for distributed energy generation is estimated to increase from $31.0 billion in 2023 to reach $59.3 billion by 2028 with a CAGR of 13.8% during the forecast period of 2023-2028.
Report Scope:
The report discusses different technologies of distributed energy generation, like reciprocating engines, small hydropower, solar PV, small combustion turbines, small wind, fuel cells, and microturbines. It offers a detailed analysis of different technologies and the prevalent trends and opportunities in the market. The market values are estimated based on multiple factors and analysis of manufacturers' revenues. Market dynamics within each industry are identified. Technological advancements and trends are reviewed, and other influences, such as economic conditions and standards, are discussed. Because this is a global study, BCC Research analyzes domestic and international technological issues and economic considerations.
The market segments of the report are focused on technical and commercial aspects of distributed energy generation. The report also discusses the regional policy and regulatory framework and ESG scenario for the industry in order to maintain environmental sustainability and comply with government regulations.
The report also analyzes the regional and country-wise markets for distributed energy generation. The segments are forecast for 2023 to 2028, with 2022 as a base year. Furthermore, the report offers a competitive scenario of the market, including a detailed analysis of key market players and a list of small and regional market players.
Each regional market considered in this analysis shows potential for market growth in the coming years. Installation of a DG system, especially for larger facilities, can include minor to considerable additional engineering, design, and construction of auxiliary/appurtenant facilities. Examples generally include fuel supply systems, pipelines, air emission controls, and other physical facilities and support equipment. Each of these components includes additional expenses in addition to the cost of the DG system itself. However, the cost of appurtenances and installation are not considered in the market values that follow.
To summarize, the market values presented here include -
- Cost of DG equipment by category (microturbines, reciprocating engines, etc.).
- New systems.
- Replacement systems
The market values presented here do not include the following -
- Appurtenances (appurtenant wiring, pipes, fuel supply, solar array shade structures, etc.).
- Installation costs.
- Engineering or design costs for site installation.
The currency used in this report is USD, with market size indicated only in USD Million. For companies reporting their revenue in USD, the revenues are taken from their annual reports. For companies that reported their revenue in other currencies, such as euros and pounds, the average annual currency conversion rate has been used for the particular year to convert the value into USD. The conversion rate for each currency conversion is provided in the report.
Report Includes:
- 163 data tables and 53 additional tables
- An overview of the global market for distributed energy generation
- Estimate of the market size and analyses of market trends, with data from 2022, estimates for 2023 and projections of compound annual growth rates (CAGRs) through 2028
- An assessment of the existing distributed energy generation industry, with a focus on the producers of each major viable technology and their market potential over the next five years
- Coverage of energy-related issues affecting the environment, including greenhouse gas (GHG) emissions, climate change, energy cost and security, and air and water pollution
- Analysis of the market dynamics, including drivers, inhibitors and opportunities, and insights into the regulatory environments impacting the market
- Market share analysis of the key companies and coverage of mergers and acquisitions (M&A), joint ventures, collaborations. partnerships, and other key vendor strategies
- Company profiles of major players within the industry, including Siemens Energy AG , ENGIE SA, Caterpillar Energy Solutions GmbH, Cummins Inc., Bloom Energy, Ansaldo Energia, and Doosan Enerbility
Table of Contents
Chapter 1 Introduction
- Study Goals and Objectives
- Reasons for Doing This Study
- Scope of Report
- What's New in This Update?
- Research Methodology
- Geographic Breakdown
Chapter 2 Summary and Highlights
- Market Overview
Chapter 3 Market Overview
- Introduction
- Renewable Energy and Distributed Energy Generation
- Microgrids
- Brief History of Distributed Energy Generation
- Distributed Energy Generation Definition
- Distributed Energy Generation Supply Chain
- Materials Manufacturers and Fabricators
- Equipment OEMs
- Specialty Equipment Manufacturers
- DG Manufacturers/Assemblers
- Construction and Installation Contractors
- Permitting and Environmental Specialists
- End Users
- Market Potential
Chapter 4 Market Dynamics
- Overview
- Drivers
- Market Challenges
- Market Opportunities
- Porter's Five Forces Analysis
- Bargaining Power of Buyers
- Bargaining Power of Suppliers
- Threat of New Entrants
- Threat of Rivalry
- Threat of Substitutes
- Climate Policies and Regulation
- Global Carbon Emission Scenario
- The Paris Agreement
- The European Green Deal
- COVID-19 Impact on Global Market for Distributed Energy Generation
- Russia-Ukraine War Impact on Distributed Energy Generation Industry
Chapter 5 Market for Distributed Energy Generation by Technology
- Overview
- Reciprocating Engines
- Market Potential
- Small Hydropower
- Advantages
- Drawbacks
- Market Potential
- Solar Photovoltaics (PV)
- Advantages of PV Systems
- Drawbacks of PV Systems
- Market Potential
- Small Wind Turbine
- Advantages of DG Wind Turbines
- Drawbacks of DG Wind Turbines
- Market Potential
- Fuel Cell
- Types of Fuel Cells
- Market Potential
- Small Combustion Turbine
- Advantages
- Drawbacks
- Market Potential
- Microturbine
- Advantages
- Drawbacks
- Market Potential
Chapter 6 Market for Distributed Energy Generation by Region
- Overview
- APAC
- China
- India
- Japan
- Rest of APAC
- Europe
- Germany
- Italy
- France
- U.K.
- Russia
- Rest of Europe
- North America
- U.S.
- Canada
- Mexico
- MEA
- Saudi Arabia
- UAE
- South Africa
- Rest of MEA
- South America
- Brazil
- Chile
- Rest of South America
Chapter 7 ESG Development
- Importance of ESG in the Distributed Energy Generation Industry
- ESG Ratings and Metrics: Understanding the Data
- ESG Practices in the Distributed Energy Generation Industry
- Environmental Score
- Social Score
- Governance Score
- Total Score
- Risk Scale, Exposure Scale and Management Scale
- Risk Scale
- Exposure Scale
- Management Scale
- Future of ESG: Emerging Trends and Opportunities
- Carbon Neutrality
- Case Study: Examples of Successful ESG Implementation
- Cummins Inc.
- Concluding Remarks from BCC
Chapter 8 Emerging Technologies and Developments
- Introduction
- Combined Heat and Power (CHP)
- Other Technologies
Chapter 9 Patent Analysis
- Introduction
Chapter 10 Competitive Intelligence
- Overview
Chapter 11 Company Profiles
- ANSALDO ENERGIA S.P.A.
- BLOOM ENERGY
- CATERPILLAR ENERGY SOLUTIONS GMBH
- CUMMINS INC.
- DOOSAN ENERBILITY
- ENGIE SA
- GENERAL ELECTRIC
- MITSUBISHI HEAVY INDUSTRIES LTD.
- ROLLS-ROYCE
- SIEMENS ENERGY AG
Chapter 12 Appendix
