|
|
市場調査レポート
商品コード
1327714
グリーンアンモニアの世界市場Global Green Ammonia Market |
||||||
|
|
|||||||
|
|||||||


| グリーンアンモニアの世界市場 |
|
出版日: 2023年08月09日
発行: BCC Research
ページ情報: 英文 192 Pages
納期: 即納可能
|

- 全表示
- 概要
- 図表
- 目次
世界のグリーンアンモニアの市場規模は、2023年の3,060万米ドルから、予測期間中は88.0%のCAGRで推移し、2028年には7億1,940万米ドルの規模に成長すると予測されています。
地域別でみると、欧州地域は、2023年の1,540万米ドルから、87.5%のCAGRで推移し、2028年には3億5,690万米ドルに成長すると予測されています。また、アジア太平洋地域は2023年の520万米ドルから、予測期間中は92.4%のCAGRで推移し、2028年には1億3,700万米ドルに成長すると予測されています。
当レポートでは、世界のグリーンアンモニアの市場を調査し、市場概要、市場影響因子および市場機会の分析、市場規模の推移・予測、各種区分・地域別の詳細分析、ESGの展開、新興技術と新たな開発、競合情勢、主要企業のプロファイルなどをまとめています。
目次
第1章 イントロダクション
第2章 サマリー・ハイライト
第3章 市場概要
- グリーンアンモニアのサプライチェーン
- 市場の可能性
- グリーン水素経済
第4章 市場力学
- 概要
- 市場促進要因
- 市場の課題
- 市場機会
- ポーターのファイブフォース分析
- SWOT分析
- 気候政策・法規制
- COVID-19が世界のグリーンアンモニア市場に与える影響
- 発電・配電産業への影響
- 再生可能エネルギー産業への影響
- ロシア・ウクライナ戦争がグリーンアンモニア産業に与える影響
第5章 グリーンアンモニア市場:技術別
- 概要
- アルカリ水電気分解
- 陽子交換膜電気分解
- 固体酸化物電解
第6章 グリーンアンモニア市場:用途別
- 概要
- 輸送
- 発電
- 肥料
- 冷凍
- その他
第7章 グリーンアンモニア市場:地域別
- 概要
- 欧州
- 北米
- アジア太平洋
- 南米
- 中東・アフリカ
第8章 ESGの開発
- グリーンアンモニア産業におけるESGの重要性
- ESG評価と指標:データの理解
- グリーンアンモニア産業におけるESGの実践
- ESGスコア分析
- リスク・露出・マネジメントスケール
- リスクスケール
- 露出スケール
- マネジメントスケール
- ESGの未来:新たな動向と機会
- BCCからの総論
第9章 新たな技術と開発
第10章 特許分析
第11章 競合情報
- 概要
- グリーンアンモニア産業への世界の投資
第12章 企業プロファイル
- BASF SE
- ENGIE SA
- ITM POWER
- MCPHY
- NEL ASA
- NUTRIEN LTD.
- SIEMENS ENERGY AS
- TOPSOE A/S
- THYSSENKRUPP AG
- YARA INTERNATIONAL ASA
- Company Profiles of Electrolyzer Providers
- AKER HORIZONS
- AREVA H2GEN(ACQUIRED BY GTT)
- ASAHI KASEI
- BLOOM ENERGY
- CARBOTECH
- CHENGDU VERTEX INDUSTRY CO. LTD.
- CUMMINS INC.
- ELOGEN(ACQUIRED BY GTT)
- GINER ELX(ACQUIRED BY PLUG POWER)
- HYTRON
- IGAS ENERGY PLC
- INDUSTRIE DE NORA S.P.A.
- ITM LINDE ELECTROLYSIS GMBH
- KOBELCO
- PLUG POWER INC.
第13章 付録:頭字語
List of Tables
- Summary Table : Global Market for Green Ammonia, by Region, Through 2028
- Table 1 : Basic Energy Requirements and CO2 Footprint by Different Ammonia Production Processes, 2020 and 2050
- Table 2 : Global Weighted Average Aggregate Installed Cost, Capacity Factor and Levelized Cost of Electricity Trends, by Technology, 2010 and 2021
- Table 3 : Post-2020 National Emission Reduction, by Country
- Table 4 : Policy Changes for Renewable Energy Generation Targets
- Table 5 : Global Market for Green Ammonia, by Technology, Through 2028
- Table 6 : Analysis of Majorly Utilized Water Electrolysis Processes
- Table 7 : Global Market for Green Ammonia, by Alkaline Water Electrolysis, by Region, Through 2028
- Table 8 : Global Market for Green Ammonia, by Proton Exchange Membrane Electrolysis, by Region, Through 2028
- Table 9 : Global Market for Green Ammonia, by Solid Oxide Electrolysis, by Region, Through 2028
- Table 10 : Technical Specification of Electrolyzer Technologies
- Table 11 : Global Market for Green Ammonia, by Application, Through 2028
- Table 12 : Global Market for Green Ammonia for Transportation, by Region, Through 2028
- Table 13 : Global Market for Green Ammonia for Power Generation, by Region, Through 2028
- Table 14 : Global Market for Green Ammonia for Fertilizer, by Region, Through 2028
- Table 15 : Global Market for Green Ammonia for Refrigeration, by Region, Through 2028
- Table 16 : Global Market for Green Ammonia for Other Applications, by Region, Through 2028
- Table 17 : Global Market for Green Ammonia, by Region, Through 2028
- Table 18 : Global Market Volume for Green Ammonia, by Region, Through 2028
- Table 19 : List of Green Ammonia Projects in Europe
- Table 20 : Initiatives by European Countries Towards Green Energy
- Table 21 : European Market for Green Ammonia, by Technology, Through 2028
- Table 22 : European Market for Green Ammonia, by Application, Through 2028
- Table 23 : European Market for Green Ammonia, by Country, Through 2028
- Table 24 : List of Green Ammonia Projects in North America
- Table 25 : North American Market for Green Ammonia, by Technology, Through 2028
- Table 26 : North American Market for Green Ammonia, by Application, Through 2028
- Table 27 : North American Market for Green Ammonia, by Country, Through 2028
- Table 28 : List of Green Ammonia Projects in Asia-Pacific
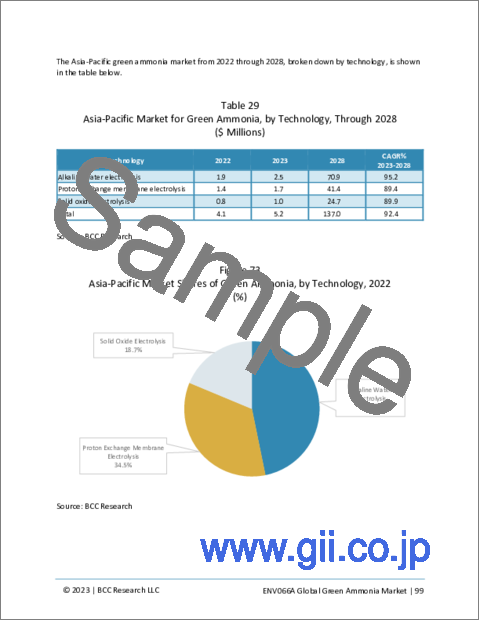
- Table 29 : Asia-Pacific Market for Green Ammonia, by Technology, Through 2028
- Table 30 : Asia-Pacific Market for Green Ammonia, by Application, Through 2028
- Table 31 : Asia-Pacific Market for Green Ammonia, by Country, Through 2028
- Table 32 : List of Green Ammonia Projects in South America
- Table 33 : South American Market for Green Ammonia, by Technology, Through 2028
- Table 34 : South American Market for Green Ammonia, by Application, Through 2028
- Table 35 : South American Market for Green Ammonia, by Country, Through 2028
- Table 36 : List of Green Ammonia Projects in the Middle East and Africa
- Table 37 : Middle East and African Market for Green Ammonia, by Technology, Through 2028
- Table 38 : Middle East and African Market for Green Ammonia, by Application, Through 2028
- Table 39 : Middle East and African Market for Green Ammonia, by Country, Through 2028
- Table 40 : ESG Ratings and Metrics: Global Green Ammonia Market
- Table 41 : Current Status of ESG in the Market for Green Ammonia
- Table 42 : Risk Scale, Exposure Scale, and Management Scale
- Table 43 : Green Ammonia/Hydrogen Technologies, BASF SE
- Table 44 : Green Ammonia/Hydrogen Technologies, Engie SA
- Table 45 : Green Ammonia/Hydrogen Technologies, Enapter
- Table 46 : Green Ammonia/Hydrogen Technologies, Hydrogenics
- Table 47 : Green Ammonia/Hydrogen Technologies, McPhy
- Table 48 : Green Ammonia/Hydrogen Technologies, Siemens AG
- Table 49 : Green Ammonia/Hydrogen Technologies, Starfire Energy
- Table 50 : Green Ammonia/Hydrogen Technologies, Topsoe A/S
- Table 51 : Green Ammonia/Hydrogen Technologies, Yara International
- Table 52 : List of Market Players in Green Ammonia Market
- Table 53 : List of Electrolyzer Providers
- Table 54 : List of Key Manufacturers of Electrolyzer Components
- Table 55 : Global Investments in Green Ammonia Industry
- Table 56 : M&A Deals in Green Ammonia Industry, 2019-2022
- Table 57 : BASF SE: Annual Revenue, 2022
- Table 58 : BASF SE: News/Key Developments, 2020-2022
- Table 59 : Engie SA: Annual Revenue, 2022
- Table 60 : Engie SA: News/Key Developments, 2019-2022
- Table 61 : ITM Power: Annual Revenue, 2022
- Table 62 : ITM Power: News/Key Developments, 2019-2022
- Table 63 : McPhy: Annual Revenue, 2022
- Table 64 : McPhy: News/Key Developments, 2020-2023
- Table 65 : Nel ASA: Annual Revenue, 2022
- Table 66 : Nel ASA: News/Key Developments, 2022-2023
- Table 67 : Nutrien Ltd.: Annual Revenue, 2022
- Table 68 : Nutrien Ltd.: News/Key Developments, 2019-2022
- Table 69 : Siemens Energy AS: Annual Revenue, 2022
- Table 70 : Siemens Energy AS: News/Key Developments, 2020-2022
- Table 71 : Topsoe A/S: Annual Revenue, 2022
- Table 72 : Topsoe A/S: News/Key Developments, 2020-2023
- Table 73 : ThyssenKrupp AG: Annual Revenue, 2022
- Table 74 : ThyssenKrupp AG: News/Key Developments, 2021-2023
- Table 75 : Yara International ASA: Annual Revenue, 2022
- Table 76 : Yara International ASA: News/Key Developments, 2021-2023
- Table 77 : Acronyms Used in This Report
List of Figures
- Summary Figure : Global Market Shares of Green Ammonia, by Region, 2022
- Figure 1 : Share of Global Ammonia Production Volume, by Country, 2022
- Figure 2 : Green Ammonia Production Process
- Figure 3 : Clean and Low-carbon Ammonia Production Technologies
- Figure 4 : Type of Ammonia
- Figure 5 : Green Ammonia Supply Chain
- Figure 6 : Global Market for Green Ammonia, by Value, 2022-2028
- Figure 7 : Global Market for Green Ammonia, by Volume, 2022-2028
- Figure 8 : Global Market Volume Shares of Hydrogen, by Source, 2022
- Figure 9 : Green Hydrogen Merits and Demerits
- Figure 10 : Impact of Market Dynamics
- Figure 11 : Global Share of Power Generation Sources, 2015-2021
- Figure 12 : Renewable Electricity Capacity Increase, by Region/Country, 2015-2020 and 2021-2026
- Figure 13 : Levelized Cost of an Ammonia Plant
- Figure 14 : Exponential Cost Decline Expectations for Electrolyzers, 2020-2050
- Figure 15 : Energy Conversion Rate of Green Ammonia for Different Applications
- Figure 16 : Global Market Shares of Bioenergy, by Technology, 2021
- Figure 17 : Porter's Five Forces Analysis of the Green Ammonia Industry
- Figure 18 : SWOT Analysis of the Green Ammonia Industry
- Figure 19 : Annual CO2 Emissions, by Fossil Fuels, 2015-2022
- Figure 20 : Natural Gas Prices, 1984-2021
- Figure 21 : Electricity Required to Generate 1KG of Hydrogen
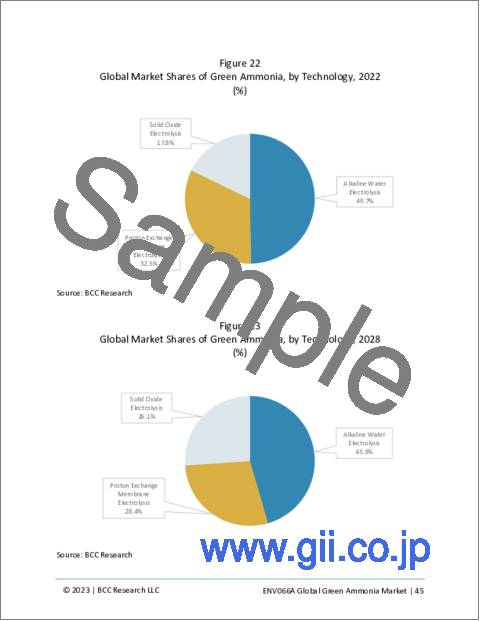
- Figure 22 : Global Market Shares of Green Ammonia, by Technology, 2022
- Figure 23 : Global Market Shares of Green Ammonia, by Technology, 2028
- Figure 24 : Electrolyzer Project Pipeline, Manufacturing Output, and Targets in Europe and Globally, 2022-2030
- Figure 25 : Alkaline Electrolysis Cell
- Figure 26 : Global Market Shares of Green Ammonia, by Alkaline Water Electrolysis, by Region, 2022
- Figure 27 : Global Market Shares of Green Ammonia, by Alkaline Water Electrolysis, by Region, 2028
- Figure 28 : PEM Electrolysis Cell
- Figure 29 : Global Market Shares of Green Ammonia, by Proton Exchange Membrane Electrolysis, by Region, 2022
- Figure 30 : Global Market Shares of Green Ammonia, by Proton Exchange Membrane Electrolysis, by Region, 2028
- Figure 31 : SOEC Electrolysis Cell
- Figure 32 : Cost Breakdown of SOEC, 2020
- Figure 33 : Global Market Shares of Green Ammonia, by Solid Oxide Electrolysis, by Region, 2022
- Figure 34 : Global Market Shares of Green Ammonia, by Solid Oxide Electrolysis, by Region, 2028
- Figure 35 : Global Market Shares of Green Ammonia, by Application, 2022
- Figure 36 : Global Market Shares of Green Ammonia, by Application, 2028
- Figure 37 : Energy-Related Carbon Emissions Shares, by Industry, 2021
- Figure 38 : Global Market Shares of Green Ammonia for Transportation, by Region, 2022
- Figure 39 : Global Market Shares of Green Ammonia for Transportation, by Region, 2028
- Figure 40 : Comparison of Ammonia-based Power Generation Technologies
- Figure 41 : Global Market Shares of Green Ammonia for Power Generation, by Region, 2022
- Figure 42 : Global Market Shares of Green Ammonia for Power Generation, by Region, 2028
- Figure 43 : Fertilizer Value Chain Using Traditional and Green Ammonia
- Figure 44 : Global Market Shares of Green Ammonia for Fertilizer, by Region, 2022
- Figure 45 : Global Market Shares of Green Ammonia for Fertilizer, by Region, 2028
- Figure 46 : Global Market Shares of Green Ammonia for Refrigeration, by Region, 2022
- Figure 47 : Global Market Shares of Green Ammonia for Refrigeration, by Region, 2028
- Figure 48 : Ammonia as a Hydrogen Carrier
- Figure 49 : Global Market Shares of Green Ammonia for Other Applications, by Region, 2022
- Figure 50 : Global Market Shares of Green Ammonia for Other Applications, by Region, 2028
- Figure 51 : Global Market Shares of Green Ammonia, by Region, 2022
- Figure 52 : Global Market Shares of Green Ammonia, by Region, 2028
- Figure 53 : Global Market Volume Shares of Green Ammonia, by Region, 2022
- Figure 54 : Global Market Volume Shares of Green Ammonia, by Region, 2028
- Figure 55 : European Market for Green Ammonia, by Value, 2022-2028
- Figure 56 : European Market for Green Ammonia, by Volume, 2022-2028
- Figure 57 : European Market Shares of Green Ammonia, by Technology, 2022
- Figure 58 : European Market Shares of Green Ammonia, by Technology, 2028
- Figure 59 : European Market Shares of Green Ammonia, by Application, 2022
- Figure 60 : European Market Shares of Green Ammonia, by Application, 2028
- Figure 61 : European Market Shares of Green Ammonia, by Country, 2022
- Figure 62 : European Market Shares of Green Ammonia, by Country, 2028
- Figure 63 : North American Market for Green Ammonia, by Value, 2022-2028
- Figure 64 : North American Market for Green Ammonia, by Volume, 2022-2028
- Figure 65 : North American Market Shares of Green Ammonia, by Technology, 2022
- Figure 66 : North American Market Shares of Green Ammonia, by Technology, 2028
- Figure 67 : North American Market Shares of Green Ammonia, by Application, 2022
- Figure 68 : North American Market Shares of Green Ammonia, by Application, 2028
- Figure 69 : North American Market Shares of Green Ammonia, by Country, 2022
- Figure 70 : North American Market Shares of Green Ammonia, by Country, 2028
- Figure 71 : Asia-Pacific Market for Green Ammonia, by Value, 2022-2028
- Figure 72 : Asia-Pacific Market for Green Ammonia, by Volume, 2022-2028
- Figure 73 : Asia-Pacific Market Shares of Green Ammonia, by Technology, 2022
- Figure 74 : Asia-Pacific Market Shares of Green Ammonia, by Technology, 2028
- Figure 75 : Asia-Pacific Market Shares of Green Ammonia, by Application, 2022
- Figure 76 : Asia-Pacific Market Shares of Green Ammonia, by Application, 2028
- Figure 77 : Asia-Pacific Market Shares of Green Ammonia, by Country, 2022
- Figure 78 : Asia-Pacific Market Shares of Green Ammonia, by Country, 2028
- Figure 79 : South American Market for Green Ammonia, by Value, 2022-2028
- Figure 80 : South American Market for Green Ammonia, by Volume, 2022-2028
- Figure 81 : South American Market Shares of Green Ammonia, by Technology, 2022
- Figure 82 : South American Market Shares of Green Ammonia, by Technology, 2028
- Figure 83 : South American Market Shares of Green Ammonia, by Application, 2022
- Figure 84 : South American Market Shares of Green Ammonia, by Application, 2028
- Figure 85 : South American Market Shares of Green Ammonia, by Country, 2022
- Figure 86 : South American Market Shares of Green Ammonia, by Country, 2028
- Figure 87 : Middle East and African Market for Green Ammonia, by Value, 2022-2028
- Figure 88 : Middle East and African Market for Green Ammonia, by Volume, 2022-2028
- Figure 89 : Middle East and African Market Shares of Green Ammonia, by Technology, 2022
- Figure 90 : Middle East and African Market Shares of Green Ammonia, by Technology, 2028
- Figure 91 : Middle East and African Market Shares of Green Ammonia, by Application, 2022
- Figure 92 : Middle East and African Market Shares of Green Ammonia, by Application, 2028
- Figure 93 : Middle East and African Market Shares of Green Ammonia, by Country, 2022
- Figure 94 : Middle East and African Market Shares of Green Ammonia, by Country, 2028
- Figure 95 : ESG Issues in the Market for Green Ammonia
- Figure 96 : Environmental Scores of Major Companies
- Figure 97 : Social Scores of Major Companies
- Figure 98 : Governance Scores of Major Companies
- Figure 99 : Total ESG Scores of Major Companies
- Figure 100 : Green Ammonia Production, by Beatrice Wind Farm
- Figure 101 : BASF SE: Annual Revenue, 2021 and 2022
- Figure 102 : BASF SE: Revenue Share, by Business Unit, 2022
- Figure 103 : BASF SE: Revenue Share, by Region, 2022
- Figure 104 : Engie SA: Annual Revenue, 2021 and 2022
- Figure 105 : Engie SA: Revenue Share, by Business Unit, 2022
- Figure 106 : Engie SA: Revenue Share, by Country/Region, 2022
- Figure 107 : ITM Power: Annual Revenue, 2021 and 2022
- Figure 108 : ITM Power: Revenue Share, by Business Unit, 2022
- Figure 109 : ITM Power: Revenue Share, by Country/Region, 2022
- Figure 110 : McPhy: Annual Revenue, 2021 and 2022
- Figure 111 : Nel ASA: Annual Revenue, 2021 and 2022
- Figure 112 : Nel ASA: Revenue Share, by Business Unit, 2022
- Figure 113 : Nel ASA: Revenue Share, by Country/Region, 2022
- Figure 114 : Nutrien Ltd.: Annual Revenue, 2021 and 2022
- Figure 115 : Nutrien Ltd.: Revenue Share, by Business Unit, 2022
- Figure 116 : Nutrien Ltd.: Revenue Share, by Country/Region, 2022
- Figure 117 : Siemens Energy AS: Annual Revenue, 2021 and 2022
- Figure 118 : Siemens Energy AS: Revenue Share, by Business Unit, 2022
- Figure 119 : Topsoe A/S: Annual Revenue, 2021 and 2022
- Figure 120 : Topsoe A/S: Revenue Share, by Region, 2022
- Figure 121 : ThyssenKrupp AG: Annual Revenue, 2021 and 2022
- Figure 122 : ThyssenKrupp AG: Revenue Share, by Business Unit, 2022
- Figure 123 : ThyssenKrupp AG: Revenue Share, by Country, 2022
- Figure 124 : Yara International ASA: Annual Revenue, 2021 and 2022
- Figure 125 : Yara International ASA: Revenue Share, by Business Unit, 2022
- Figure 126 : Yara International ASA: Revenue Share, by Product Group, 2022
- Figure 127 : Yara International ASA: Revenue Share, by Country/Region, 2022
Highlights:
The global market for green ammonia is projected to grow from $30.6 million in 2023 to $719.4 million by 2028, at a compound annual growth rate (CAGR) of 88.0% from 2023 through 2028.
European market revenue for green ammonia is projected to grow from $15.4 million in 2023 to $356.9 million by 2028, at a CAGR of 87.5% from 2023 through 2028.
Asia-Pacific market revenue for green ammonia is projected to grow from $5.2 million in 2023 to $137.0 million by 2028, at a CAGR of 92.4% from 2023 through 2028.
Report Scope:
The report discusses different technologies for producing green ammonia like solid oxide electrolysis, proton exchange membrane electrolysis, and alkaline water electrolysis. It offers a detailed analysis of different technologies and the prevalent trends and opportunities in the market. The market values are estimated based on multiple factors and analysis of manufacturers' revenues. Market dynamics within each industry are identified. Technological advancements and trends are reviewed, and other influences such as economic conditions and standards are discussed. Because this is a global study, BCC Research analyzes domestic and international technological issues and economic considerations.
The market segments of the report are focused on technical and commercial aspects of green ammonia for different end-user segments, such as power generation, transportation, fertilizer, refrigeration, and others. The report also discusses the regional policy and regulatory framework and ESG scenario for the green ammonia industry, to maintain environmental sustainability and to comply with government regulations.
The report also analyzes the regional markets for green ammonia. The segments are forecast for 2023 to 2028, with 2022 as a base year. The report offers a competitive scenario of the market, including a detailed analysis of key market players and a list of small and regional market players.
The currency used in this report is USD, with the market size indicated in USD millions. For companies reporting their revenue in USD, revenues are taken from their annual reports. For companies that reported their revenue in other currencies, i.e., euros and pounds, the average annual currency conversion rate has been used for the particular year to convert the value into USD. The conversion rate for each currency conversion is provided in the report.
Report Includes:
- 40 data tables and 38 additional tables
- An up-to-date overview and industry analysis of the global green ammonia market
- Analyses of the global and regional market trends, with historical market revenue data (sales figures) for 2022, estimates for 2023, and projections of compound annual growth rates (CAGRs) through 2028
- Highlights of the market potential and understanding the demand for green ammonia in various applications, and areas to forecast this market into various segments and sub-segments
- Estimation of the actual market size both in value and volumetric terms, and revenue forecast for global green ammonia market in USD millions, and corresponding market share analysis based on technology, application, and region
- In-depth information (facts and figures) concerning the major factors influencing the progress of this market (drivers, restraints, opportunities, and industry-specific challenges) with respect to specific growth trends, upcoming prospects, and contributions to the overall market
- Analysis of market opportunities with a holistic study of the Porter's five forces analysis and SWOT analysis considering both micro and macro environmental factors prevailing in the green ammonia industry
- Review of the impact of COVID-19 and Russia-Ukraine war on global market for green ammonia
- Understanding of the importance of ESG in the global market for green ammonia, consumer attitudes towards sustainability, risks and opportunity assessment, ratings and matrices, and ESG practices in the green ammonia industry
- Analysis of the competitive landscape featuring major stakeholder companies based on their recent developments, key financials and segmental revenues, and operational integration
- Profile descriptions of the leading market players, including BASF SE, ITM Power, NEL ASA, Siemens Energy AS, Topsoe A/S, ThyssenKrupp AG, Engie SA, McPhy, Nutrien Ltd., and Yara International ASA
Table of Contents
Chapter 1 Introduction
- Study Goals and Objectives
- Reasons for Doing This Study
- Scope of Report
- Research Methodology
- Geographic Breakdown
Chapter 2 Summary and Highlights
- Market Outlook
Chapter 3 Market Overview
- Introduction
- Green Ammonia Supply Chain
- Market Potential
- Green Hydrogen Economy
Chapter 4 Market Dynamics
- Overview
- Market Drivers
- Market Challenges
- Market Opportunities
- Porter's Five Forces Analysis
- SWOT Analysis
- Climate Policies and Regulation
- Impact of COVID-19 on Global Market for Green Ammonia
- Impact on Energy Generation and Distribution Industry
- Impact on Renewable Energy Industry
- Impact of Russia-Ukraine War on the Green Ammonia Industry
Chapter 5 Market for Green Ammonia by Technology
- Overview
- Alkaline Water Electrolysis
- Proton Exchange Membrane Electrolysis
- Solid Oxide Electrolysis
Chapter 6 Market for Green Ammonia by Application
- Overview
- Transportation
- Power Generation
- Fertilizer
- Refrigeration
- Other Applications
Chapter 7 Market for Green Ammonia by Region
- Overview
- Europe
- North America
- Asia-Pacific
- South America
- Middle East and Africa (MEA)
Chapter 8 ESG Development
- Importance of ESG in the Green Ammonia Industry
- ESG Ratings and Metrics: Understanding the Data
- ESG Practices in the Green Ammonia Industry
- ESG Score Analysis
- Risk Scale, Exposure Scale, and Management Scale
- Risk Scale
- Exposure Scale
- Management Scale
- Future of ESG: Emerging Trends and Opportunities
- Concluding Remarks from BCC Research
Chapter 9 Emerging Technologies and Developments
- Introduction
Chapter 10 Patent Analysis
- Introduction
Chapter 11 Competitive Intelligence
- Overview
- Global Investments in the Green Ammonia Industry
Chapter 12 Company Profiles
- BASF SE
- ENGIE SA
- ITM POWER
- MCPHY
- NEL ASA
- NUTRIEN LTD.
- SIEMENS ENERGY AS
- TOPSOE A/S
- THYSSENKRUPP AG
- YARA INTERNATIONAL ASA
- Company Profiles of Electrolyzer Providers
- AKER HORIZONS
- AREVA H2GEN (ACQUIRED BY GTT)
- ASAHI KASEI
- BLOOM ENERGY
- CARBOTECH
- CHENGDU VERTEX INDUSTRY CO. LTD.
- CUMMINS INC.
- ELOGEN (ACQUIRED BY GTT)
- GINER ELX (ACQUIRED BY PLUG POWER)
- HYTRON
- IGAS ENERGY PLC
- INDUSTRIE DE NORA S.P.A.
- ITM LINDE ELECTROLYSIS GMBH
- KOBELCO
- PLUG POWER INC.