|
|
市場調査レポート
商品コード
1311835
デジタルユーティリティの世界市場Global Digital Utility Market |
||||||
|
|
|||||||
|
|||||||


| デジタルユーティリティの世界市場 |
|
出版日: 2023年07月19日
発行: BCC Research
ページ情報: 英文 289 Pages
納期: 即納可能
|

- 全表示
- 概要
- 図表
- 目次
世界のデジタルユーティリティの市場規模は、2023年の2,266億米ドルから、予測期間中は12.9%のCAGRで推移し、2028年には4,152億米ドルの規模に成長すると予測されています。
北米地域は、2023年の856億米ドルから、13.1%のCAGRで推移し、2028年には1,586億米ドルの規模に成長すると予測されています。また、アジア太平洋地域は、2023年の539億米ドルから、15.2%のCAGRで推移し、2028年には1,095億米ドルの規模に成長すると予測されています。
本レポートでは、世界のデジタルユーティリティの市場を調査し、市場概要、デジタルトランスフォーメーションの影響、その他の市場影響因子および市場機会の分析、市場規模の推移・予測、各種区分・地域別の詳細分析、ESGの分析、新興技術と開発の動向、特許動向、競合情勢、主要企業のプロファイルなどをまとめています。
目次
第1章 イントロダクション
第2章 サマリー・ハイライト
第3章 市場概要
- 現在の市場概要
- ユーティリティ部門におけるデジタルトランスフォーメーションのメリット
- デジタルトランスフォーメーションの必要性
- デジタル技術とその特徴
- デジタルユーティリティ市場のサプライチェーン分析
- ポーターのファイブフォースモデル
- PESTLE分析
- COVID-19が世界のデジタルユーティリティ市場に与える影響
- ロシア・ウクライナ戦争が世界のデジタルユーティリティ市場に与える影響
第4章 市場力学
- 概要
- 市場促進要因
- 市場抑制要因
- デジタルトランスフォーメーションにおける課題
- 現在の市場動向
- 市場機会
第5章 市場内訳:技術別
- 概要
- ハードウェア
- 統合ソリューション
第6章 市場内訳:ネットワークタイプ別
- 概要
- 発電
- 送配電
- 小売
第7章 市場内訳:エンドユーザー別
- 概要
- 住宅
- 産業
- 商業
第8章 市場内訳:地域別
- 概要
- 北米
- 米国
- カナダ
- メキシコ
- 欧州
- ドイツ
- フランス
- イタリア
- スペイン
- 英国
- その他の欧州
- アジア太平洋
- 中国
- インド
- 日本
- オーストラリア
- 韓国
- その他のアジア太平洋地域
- その他の地域
- 中東・アフリカ
- 南米
第9章 ESGの発展
- 概要
- デジタルトランスフォーメーションとESG:密接な関係にある
- ユーティリティのデジタル化におけるESGの重要性
- ユーティリティ業界のESG
- ESG目標の達成のために電力会社が取れるアプローチ
- 電力部門におけるESG導入の課題と機会
- デジタルユーティリティ市場におけるESGの現状
- デジタルトランスフォーメーションによるESGの未来
- ケーススタディ:ESG導入の成功例
- BCC Researchからの総論
第10章 新たな技術・開発
- 技術概要
- ユーティリティ分野の技術動向
- ユーティリティの成長を形作る要因
第11章 特許分析
第12章 M&Aと資金調達の見通し
- デジタルユーティリティにおけるベンチャーキャピタル
第13章 競合情報
- 概要
- 市場シェア分析
- 戦略分析
- 製品マッピング分析
- 製品マッピング分析:技術タイプ別
第14章 企業プロファイル
- 概要
- ABB LTD.
- ACCENTURE PLC
- CAPGEMINI SE
- CISCO SYSTEMS INC.
- COGNIZANT
- E.ON SE
- EATON CORP. PLC
- GENERAL ELECTRIC
- INFOSYS LTD.
- INTERNATIONAL BUSINESS MACHINES CORP.
- MICROSOFT CORP.
- ORACLE CORP.
- SAP SE
- SIEMENS AG
- WIPRO LTD.
- 産業団体
第15章 付録:頭字語
List of Tables
- Summary Table : Global Digital Utility Market, by Region, Through 2028
- Table 1 : Digital Technologies and Their Features
- Table 2 : Challenges in Digital Transformation
- Table 3 : Global Digital Utility Market, by Technology, Through 2028
- Table 4 : Global Digital Utility Hardware Market, by Region, Through 2028
- Table 5 : Global Digital Utility Market for Integrated Solutions in Digital Utility, by Region, Through 2028
- Table 6 : Global Digital Utility Cloud and Software Market, by Region, Through 2028
- Table 7 : Global Digital Utility Service Market, by Region, Through 2028
- Table 8 : Global Digital Utility Market, by Network Type, Through 2028
- Table 9 : Global Digital Utility Generation Market, by Region, Through 2028
- Table 10 : Challenges and New Technologies in Transmission and Distribution of Digital Utility Networks
- Table 11 : Global Digital Utility Transmission and Distribution Market, by Region, Through 2028
- Table 12 : Global Digital Utility Energy Storage Market, by Region, Through 2028
- Table 13 : Global Digital Utility Energy Trading Market, by Region, Through 2028
- Table 14 : Global Digital Utility Market in Other Applications, by Region, Through 2028
- Table 15 : Global Market for Digital Utility in Retail, by Region, Through 2028
- Table 16 : Global Digital Utility Market, by End-Use Sector, Through 2028
- Table 17 : Global Market for Digital Utility in Residential End Uses, by Region, Through 2028
- Table 18 : Global Market for Digital Utility in Industrial End Uses, by Region, Through 2028
- Table 19 : Global Market for Digital Utility in Commercial End Uses, by Region, Through 2028
- Table 20 : Global Digital Utility Market, by Region, Through 2028
- Table 21 : North American Digital Utility Market, by Country, Through 2028
- Table 22 : North American Digital Utility Market, by Technology, Through 2028
- Table 23 : North American Digital Utility Market, by Network Type, Through 2028
- Table 24 : North American Digital Utility Market, by End-Use Sector, Through 2028
- Table 25 : European Digital Utility Market, by Country, Through 2028
- Table 26 : European Digital Utility Market, by Technology, Through 2028
- Table 27 : European Digital Utility Market, by Network Type, Through 2028
- Table 28 : European Digital Utility Market, by End-Use Sector, Through 2028
- Table 29 : Asia-Pacific Digital Utility Market, by Country, Through 2028
- Table 30 : Asia-Pacific Digital Utility Market, by Technology, Through 2028
- Table 31 : Asia-Pacific Digital Utility Market, by Network Type, Through 2028
- Table 32 : Asia-Pacific Digital Utility Market, by End-Use Sector, Through 2028
- Table 33 : Rest of World Digital Utility Market, by Subregion, Through 2028
- Table 34 : Rest of World Digital Utility Market, by Technology, Through 2028
- Table 35 : Rest of World Digital Utility Market, by Network Type, Through 2028
- Table 36 : Rest of World Digital Utility Market, by End-Use Sector, Through 2028
- Table 37 : Environmental Factors for the Utility Industry
- Table 38 : Social Factors for the Utility Industry
- Table 39 : Governance Factors for the Utility Industry
- Table 40 : ESG Score for the Digital Utility Providers
- Table 41 : Initiatives for Reducing the Footprint by Accenture
- Table 42 : Active Targets and Goals of ESG by Cisco System Inc.
- Table 43 : Completed ESG Goals by Cisco System Inc.
- Table 44 : Patents Published on Components in Digital Utility, January 2021-December 2022
- Table 45 : Number of Patents Published on Digital Utility, by Company, 2022
- Table 46 : Venture Capital in Digital Utility, January 2019-May 2023
- Table 47 : Competitive Information for Top Players in the Global Digital Utility Market, 2022
- Table 48 : Product Mapping Analysis by Technology for Top Companies
- Table 49 : ABB Ltd.: Financial Overview, 2020-2022
- Table 50 : ABB Ltd.: Key Developments, 2020-2023
- Table 51 : ABB Ltd.: Product Offerings
- Table 52 : Accenture Plc: Financial Overview, 2020-2022
- Table 53 : Accenture Plc: Key Developments, 2021 and 2022
- Table 54 : Accenture Plc: Product Offerings
- Table 55 : Capgemini SE: Financial Overview, 2020-2022
- Table 56 : Capgemini SE: Key Developments, 2019-2022
- Table 57 : Capgemini SE: Product Offering
- Table 58 : Cisco Systems Inc.: Financial Overview, 2020-2022
- Table 59 : Cisco Systems Inc.: Key Developments, 2021 and 2022
- Table 60 : Cisco Systems Inc.: Product Offerings
- Table 61 : Cognizant: Financial Overview, 2020-2022
- Table 62 : Cognizant: Key Developments, 2022
- Table 63 : Cognizant: Product Offerings
- Table 64 : E.ON SE: Financial Overview, 2020-2022
- Table 65 : E.ON SE: Key Developments, 2022
- Table 66 : E.ON SE: Product Offerings
- Table 67 : Eaton Corp. plc: Financial Overview, 2020-2022
- Table 68 : Eaton Corp. plc: Key Developments, 2021-2023
- Table 69 : Eaton Corp. plc: Product Offerings
- Table 70 : General Electric: Financial Overview, 2020-2022
- Table 71 : General Electric: Key Developments, 2021-2023
- Table 72 : General Electric: Product Offerings
- Table 73 : Infosys Ltd.: Financial Overview, 2020-2022
- Table 74 : Infosys Ltd.: Key Developments, 2023
- Table 75 : Infosys Ltd.: Product Offerings
- Table 76 : IBM Corp.: Financial Overview, 2020-2022
- Table 77 : IBM Corp.: Key Developments, 2021 and 2022
- Table 78 : IBM Corp.: Product Offerings
- Table 79 : Microsoft Corp.: Financial Overview, 2020-2022
- Table 80 : Microsoft Corp.: Key Developments, 2022
- Table 81 : Microsoft Corp.: Product Offerings
- Table 82 : Oracle Corp.: Financial Overview, 2020-2022
- Table 83 : Oracle Corp.: Key Developments, 2020-2022
- Table 84 : Oracle Corp.: Product Offerings
- Table 85 : SAP SE: Financial Overview, 2020-2022
- Table 86 : SAP SE: Key Developments, 2020-2023
- Table 87 : SAP SE: Product Offerings
- Table 88 : Siemens AG: Financial Overview, 2020-2022
- Table 89 : Siemens AG: Key Developments, 2020-2023
- Table 90 : Siemens AG: Product Offerings
- Table 91 : Wipro Ltd.: Financial Overview, 2020-2022
- Table 92 : Wipro Ltd.: Product Offerings
- Table 93 : List of Resources Used for Digital Utility Market
- Table 94 : Acronyms and Abbreviations Used in This Report
List of Figures
- Summary Figure : Global Digital Utility Market Share, by Region, 2022
- Figure 1 : Benefits of Digital Transformation in Utilities
- Figure 2 : Digital Transformation Strategy by Utilities
- Figure 3 : Supply Chain Analysis of the Digital Utility Market
- Figure 4 : Porter's Five Forces Model for the Digital Utility Market
- Figure 5 : PESTLE Analysis for Digital Utility Market
- Figure 6 : Global Digital Utility Market Dynamics
- Figure 7 : Global Renewable Power Capacity Growth, 2017-2022
- Figure 8 : Global Demand for Electricity, 2017-2022
- Figure 9 : Benefits Associated with the Smart Grid
- Figure 10 : Investments in Digital Infrastructure in Transmission and Distribution Electricity Grids, 2017-2021
- Figure 11 : Restraints on Global Digital Utility Market
- Figure 12 : Current Trends in the Global Digital Utility Market
- Figure 13 : Market Opportunities in the Global Digital Utility Market
- Figure 14 : Global Digital Utility Market Share, by Technology, 2022
- Figure 15 : Global Digital Utility Market Share, by Technology, 2028
- Figure 16 : Global Digital Utility Hardware Market Share, by Region, 2022
- Figure 17 : Global Digital Utility Hardware Market Share, by Region, 2028
- Figure 18 : Global Market Shares of Integrated Solutions in Digital Utility, by Region, 2022
- Figure 19 : Global Market Shares of Integrated Solutions in Digital Utility, by Region, 2028
- Figure 20 : Global Digital Utility Cloud and Software Market Share, by Region, 2022
- Figure 21 : Global Digital Utility Cloud and Software Market Share, by Region, 2028
- Figure 22 : Global Digital Utility Service Market Share, by Region, 2022
- Figure 23 : Global Digital Utility Service Market Share, by Region, 2028
- Figure 24 : Global Digital Utility Market Share, by Network Type, 2022
- Figure 25 : Global Digital Utility Market Share, by Network Type, 2028
- Figure 26 : Global Digital Utility Generation Market Share, by Region, 2022
- Figure 27 : Global Digital Utility Generation Market Share, by Region, 2028
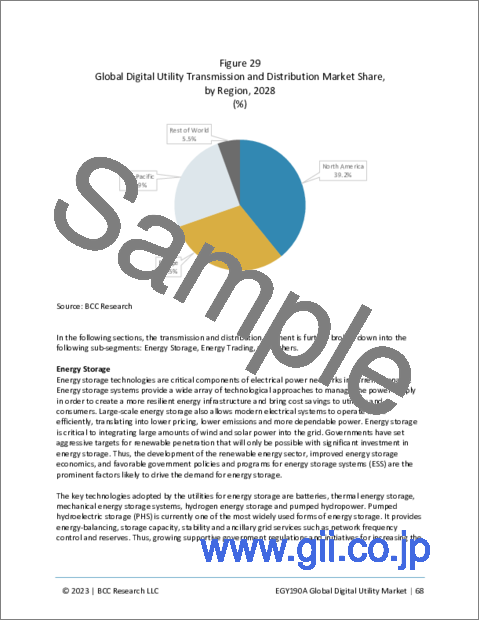
- Figure 28 : Global Digital Utility Transmission and Distribution Market Share, by Region, 2022
- Figure 29 : Global Digital Utility Transmission and Distribution Market Share, by Region, 2028
- Figure 30 : Global Digital Utility Energy Storage Market Share, by Region, 2022
- Figure 31 : Global Digital Utility Energy Storage Market Share, by Region, 2028
- Figure 32 : Global Digital Utility Energy Trading Market Share, by Region, 2022
- Figure 33 : Global Digital Utility Energy Trading Market Share, by Region, 2028
- Figure 34 : Global Market Shares of Digital Utility in Other Applications, by Region, 2022
- Figure 35 : Global Market Shares of Digital Utility in Other Applications, by Region, 2028
- Figure 36 : Global Market Shares of Digital Utility in Retail, by Region, 2022
- Figure 37 : Global Market Shares of Digital Utility in Retail, by Region, 2028
- Figure 38 : Global Digital Utility Market Share, by End-Use Sector, 2022
- Figure 39 : Global Digital Utility Market Share, by End-Use Sector, 2028
- Figure 40 : Global Market Shares of Digital Utility in Residential End Uses, by Region,2022
- Figure 41 : Global Market Shares of Digital Utility in Residential End Uses, by Region, 2028
- Figure 42 : Global Market Shares of Digital Utility in Industrial End Uses, by Region, 2022
- Figure 43 : Global Market Shares of Digital Utility in Industrial End Uses, by Region, 2028
- Figure 44 : Global Market Shares of Digital Utility in Commercial End Uses, by Region, 2022
- Figure 45 : Global Market Shares of Digital Utility in Commercial End Uses, by Region, 2028
- Figure 46 : Global Digital Utility Market Share, by Region, 2022
- Figure 47 : Global Digital Utility Market Share, by Region, 2028
- Figure 48 : North American Digital Utility Market Share, by Country, 2022
- Figure 49 : North American Digital Utility Market Share, by Country, 2028
- Figure 50 : North American Digital Utility Market Share, by Technology, 2022
- Figure 51 : North American Digital Utility Market Share, by Technology, 2028
- Figure 52 : North American Digital Utility Market Share, by Network Type, 2022
- Figure 53 : North American Digital Utility Market Share, by Network Type, 2028
- Figure 54 : North American Digital Utility Market Share, by End-Use Sector, 2022
- Figure 55 : North American Digital Utility Market Share, by End-Use Sector, 2028
- Figure 56 : U.S. Digital Utility Market, 2022-2028
- Figure 57 : Canadian Digital Utility Market, 2022-2028
- Figure 58 : Mexican Digital Utility Market, 2022-2028
- Figure 59 : European Digital Utility Market Share, by Country, 2022
- Figure 60 : European Digital Utility Market Share, by Country, 2028
- Figure 61 : European Digital Utility Market Share, by Technology, 2022
- Figure 62 : European Digital Utility Market Share, by Technology, 2028
- Figure 63 : European Digital Utility Market Share, by Network Type, 2022
- Figure 64 : European Digital Utility Market Share, by Network Type, 2028
- Figure 65 : European Digital Utility Market Share, by End-Use Sector, 2022
- Figure 66 : European Digital Utility Market Share, by End-Use Sector, 2028
- Figure 67 : German Digital Utility Market, 2022-2028
- Figure 68 : French Digital Utility Market, 2022-2028
- Figure 69 : Italian Digital Utility Market, 2022-2028
- Figure 70 : Spanish Digital Utility Market, 2022-2028
- Figure 71 : U.K. Digital Utility Market, 2022-2028
- Figure 72 : Rest of European Digital Utility Market, 2022-2028
- Figure 73 : Asia-Pacific Digital Utility Market Share, by Country, 2022
- Figure 74 : Asia-Pacific Digital Utility Market Share, by Country, 2028
- Figure 75 : Asia-Pacific Digital Utility Market Share, by Technology, 2022
- Figure 76 : Asia-Pacific Digital Utility Market Share, by Technology, 2028
- Figure 77 : Asia-Pacific Digital Utility Market Share, by Network Type, 2022
- Figure 78 : Asia-Pacific Digital Utility Market Share, by Network Type, 2028
- Figure 79 : Asia-Pacific Digital Utility Market Share, by End-Use Sector, 2022
- Figure 80 : Asia-Pacific Digital Utility Market Share, by End-Use Sector, 2028
- Figure 81 : Chinese Digital Utility Market, 2022-2028
- Figure 82 : Indian Digital Utility Market, 2022-2028
- Figure 83 : Japanese Digital Utility Market, 2022-2028
- Figure 84 : Australian Digital Utility Market, 2022-2028
- Figure 85 : South Korean Digital Utility Market, 2022-2028
- Figure 86 : Rest of Asia-Pacific Digital Utility Market, 2022-2028
- Figure 87 : Rest of World Digital Utility Market Share, by Subregion, 2022
- Figure 88 : Rest of World Digital Utility Market Share, by Subregion, 2028
- Figure 89 : Rest of World Digital Utility Market Share, by Technology, 2022
- Figure 90 : Rest of World Digital Utility Market Share, by Technology, 2028
- Figure 91 : Rest of World Digital Utility Market Share, by Network Type, 2022
- Figure 92 : Rest of World Digital Utility Market Share, by Network Type, 2028
- Figure 93 : Rest of World Digital Utility Market Share, by End-Use Sector, 2022
- Figure 94 : Rest of World Digital Utility Market Share, by End-Use Sector, 2028
- Figure 95 : Middle East and African Digital Utility Market, 2022-2028
- Figure 96 : South American Digital Utility Market, 2022-2028
- Figure 97 : Common Links Between Digital Transformation and ESG
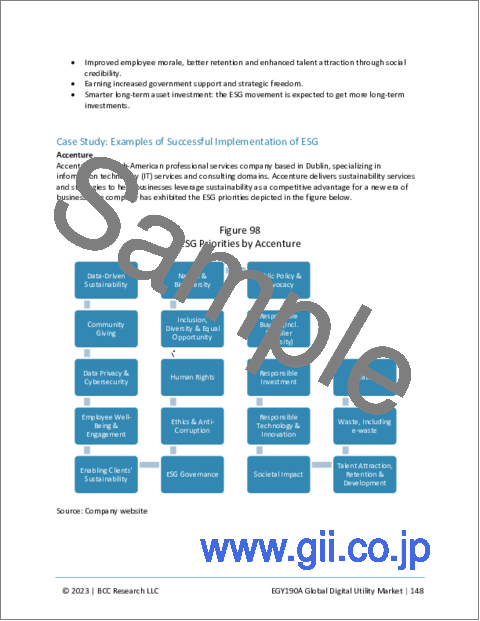
- Figure 98 : ESG Priorities by Accenture
- Figure 99 : Applications of IoT in the Energy Sector
- Figure 100 : Benefits of Artificial Intelligence in the Energy Sector
- Figure 101 : Factors Shaping the Utility Growth
- Figure 102 : Share of Patents Published on Digital Utility, by Assignee Country, 2021
- Figure 103 : Shares of Patents Published on Digital Utility, by Assignee Country, 2022
- Figure 104 : Distribution Share of Venture Capital, by Various Rounds, 2022-2023
- Figure 105 : Global Digital Utility Market Share, by Strategy, 2021-2022
- Figure 106 : ABB Ltd.: Financial Information, 2020-2022
- Figure 107 : ABB Ltd.: Revenue Share, by Business Segment, 2022
- Figure 108 : ABB Ltd.: Revenue Share, by Region, 2022
- Figure 109 : Accenture Plc: Financial Information, 2020-2022
- Figure 110 : Accenture Plc: Revenue Share, by Business Segment, 2022
- Figure 111 : Accenture Plc: Revenue Share. by Region, 2022
- Figure 112 : Capgemini SE: Financial Information, 2020-2022
- Figure 113 : Capgemini SE: Revenue Share, by Business Segment, 2022
- Figure 114 : Capgemini SE: Revenue Share, by Region, 2022
- Figure 115 : Cisco Systems Inc.: Financial Information, 2020-2022
- Figure 116 : Cisco Systems Inc.: Revenue Share, by Business Segment, 2022
- Figure 117 : Cisco Systems Inc.: Revenue Share, by Region, 2022
- Figure 118 : Cognizant: Financial Information, 2020-2022
- Figure 119 : Cognizant: Revenue Share, by Business Segment, 2022
- Figure 120 : Cognizant: Revenue Share, by Region, 2022
- Figure 121 : E.ON SE: Financial Information, 2020-2022
- Figure 122 : E.ON SE: Revenue Share, by Business Segment, 2022
- Figure 123 : Eaton Corp. plc: Financial Information, 2020-2022
- Figure 124 : Eaton Corp. plc: Revenue Share, by Business Segment, 2022
- Figure 125 : Eaton Corp. plc: Revenue Share by Region, 2022
- Figure 126 : General Electric: Financial Information, 2020-2022
- Figure 127 : General Electric: Revenue Share, by Business Segment, 2022
- Figure 128 : General Electric: Revenue Share, by Region, 2022
- Figure 129 : Infosys Ltd.: Financial Information, 2020-2022
- Figure 130 : Infosys Ltd.: Revenue Share, by Business Segment, 2022
- Figure 131 : Infosys Ltd.: Revenue Share, by Region, 2022
- Figure 132 : IBM Corp.: Financial Information, 2020-2022
- Figure 133 : IBM Corp.: Revenue Share, by Business Segment, 2022
- Figure 134 : IBM Corp.: Revenue Share, by Region, 2022
- Figure 135 : Microsoft Corp.: Financial Information, 2020-2022
- Figure 136 : Microsoft Corp.: Revenue Share, by Business Segment, 2022
- Figure 137 : Microsoft Corp.: Revenue Share, by Region, 2022
- Figure 138 : Oracle Corp.: Financial Information, 2020-2022
- Figure 139 : Oracle Corp.: Revenue Share, by Business Segment, 2022
- Figure 140 : Oracle Corp.: Revenue Share, by Region, 2022
- Figure 141 : SAP SE: Financial Information, 2020-2022
- Figure 142 : SAP SE: Revenue Share, by Business Segment, 2022
- Figure 143 : SAP SE: Revenue Share, by Region, 2022
- Figure 144 : Siemens AG: Financial Information, 2020-2022
- Figure 145 : Siemens AG: Revenue Share, by Business Segment, 2022
- Figure 146 : Siemens AG: Revenue Share, by Region, 2022
- Figure 147 : Wipro Ltd.: Financial Information, 2020-2022
- Figure 148 : Wipro Ltd.: Revenue Share, by Business Segment, 2022
- Figure 149 : Wipro Ltd.: Revenue Share, by Region, 2022
Highlights:
The global digital utility market is estimated to increase from $226.6 billion in 2023 to reach $415.2 billion by 2028, at a compound annual growth rate (CAGR) of 12.9% from 2023 through 2028.
North American digital utility market is estimated to increase from $85.6 billion in 2023 to reach $158.6 billion by 2028, at a CAGR of 13.1% from 2023 through 2028.
Asia-Pacific digital utility market is estimated to increase from $53.9 billion in 2023 to reach $109.5 billion by 2028, at a CAGR of 15.2% from 2023 through 2028.
Report Scope:
This report analyzes different ongoing technologies and their feasibility at present. It segments the digital utility market by technology type, network type and end-use industries and it also surveys the regional market development of digital utilities. Furthermore, the report segments the regional markets by major countries, such as the U.S., China, Germany, India and others, where the opportunities for advanced technologies are lucrative.
This study is prepared in a simple, easy-to-understand format; tables and figures are included to illustrate historical, current and future market scenarios. The report covers leading companies with information on product types, business footprint, revenue, etc. BCC Research has also included a list of other companies in global and regional markets. In addition, the report consists of a patent analysis for the digital utility market, representing a significant investment area for investors.
In addition, the report incorporates the impact of COVID-19 and the Russia-Ukraine war on the global and regional markets.
In this report, 2022 is used as the market's base year; estimated values are provided for 2023; and the market values are forecast from 2023 to 2028. All market values are provided in billions of dollars, and market shares and CAGRs are provided in percentages.
Report Includes:
- 51 data tables and 44 additional tables
- A brief overview and up-to-date analysis of the global digital utility market
- Analyses of the global market trends, with historical revenue (sales figures) for 2022, estimates for 2023, forecasts for 2024 and 2026, and projections of compound annual growth rates (CAGRs) through 2028
- Understanding of the current and upcoming market potential for the digital utility industry, and areas of focus to forecast this market into various segments and sub-segments
- Estimation of actual market size and revenue forecast for digital utility market in USD billion values, and corresponding market share analysis based on technology, network type, end-use industry, and region
- Discussion of major growth drivers, industry-specific challenges, regulatory aspects, and technology advancement that will shape the market for digital utility technologies as a basis for projecting demand in the next few years (2023-2028)
- Country specific data and market value analysis for the U.S., Canada, Mexico, Germany, France, Italy, Spain, the UK, Japan, China, India, Australia, South Korea, the Middle East and Africa, among others
- Analysis of market opportunities with a holistic review of the Porter's five forces analysis and PESTLE analysis considering both micro- and macro environmental factors prevailing in the market
- A relevant patent analysis on the digital utility market with emphasis on R&D investments, emerging technologies, and new developments in the marketplace
- Latest information on the recent mergers and acquisitions, partnerships, agreements, collaborations, and other strategic alliances in global digital utility marketplace
Identification of the major stakeholders and analysis of the competitive landscape based on recent developments and segmental revenues
- Descriptive company profiles of the leading global players, including Cisco Systems Inc., General Electric Co., International Business Machines Corp., Accenture plc and Siemens AG
Executive Summary
Summary:
Digitization has long been the prominent strategy pursued by major utility companies, and it has significantly contributed to reshaping and reinventing their organizations. The digital utility market is expected to grow due to the growing investments being made in adopting smart grids and the rising consumption of electricity. Also, increasing renewable power generation and growing investment prospects in advanced metering infrastructure are some of the prominent factors contributing to the growing digital utility market. Increased focus towards adoption of technologies by utilities has become a crucial strategy for businesses. It involves the implementation of cloud and big data analytics to IoT and automation. In sum, digital tech is shaping the future of the utility sector and posing new opportunities for achieving new revenue streams.
The demand for electricity is increasing at a faster pace every year. To cope with the increasing demand, energy and utility companies are upgrading to Distributed Energy Resources (DER) and Advanced Distribution Management Systems (ADMS). Such systems require highly accurate data, which is not available with existing operations. Thus, it has become evident that utilities need to adopt digitization technologies to help them run their businesses more effectively and efficiently.
Also, AI-powered solutions are being used in the energy and utilities industries to monitor and track assets such as on-site equipment, end-user equipment and personnel, and mobile devices for effective asset management. These monitoring and advanced analytics capabilities can detect or even predict faults and schedule maintenance to reduce equipment downtime. Data management and accuracy are critical to optimizing processes, as this can ultimately lead to cost savings. The energy and utility sectors are, therefore, adopting new technologies to collect and analyze data from multiple touchpoints in order to streamline operations.
Customer satisfaction is one of the primary goals of digital transformation. Personalized interactions through the online portal, mobile app and customer service team allow end users to access and transact directly with the utility. This gives customers direct access to all their account information and thereby builds loyalty.
In sum, the increasing adoption of technology for growing business opportunities is strengthening the demand for advanced technologies such as edge computing, digital twins, the Internet of Things (IoT), Artificial intelligence (AI), Enterprise risk management (ERM) and Cloud Distribution Software, among others. Machine learning and artificial intelligence (AI) can supercharge the efficiency and resilience of a utility's core business, and other technologies can lead to entirely new value-added services and business models for utilities.
Table of Contents
Chapter 1 Introduction
- Overview
- Study Goals and Objectives
- Reasons for Doing This Study
- Scope of Report
- Research Methodology
- Information Sources
- Regional Breakdown
Chapter 2 Summary and Highlights
- Market Outlook
Chapter 3 Market Overview
- Current Market Overview
- Benefits of Digital Transformation in Utilities
- Necessity of Digital Transformation
- Digital Technology and Its Features
- Supply Chain Analysis for the Digital Utility Market
- Porter's Five Forces Model
- Bargaining Power of Suppliers
- Bargaining Power of Buyers
- The Threat of New Entrants
- Threat of Substitutes
- Competitive Rivalry
- PESTLE Analysis
- COVID-19's Impact on the Global Digital Utility Market
- Russia-Ukraine War Impact on the Global Digital Utility Market
Chapter 4 Market Dynamics
- Overview
- Market Drivers
- Market Restraints
- Challenges in Digital Transformation
- Current Market Trends
- Market Opportunities
Chapter 5 Market Breakdown by Technology
- Overview
- Hardware
- Integrated Solutions
Chapter 6 Market Breakdown by Network Type
- Overview
- Generation
- Transmission and Distribution
- Retail
Chapter 7 Market Breakdown by End-Use Sector
- Overview
- Residential
- Industrial
- Commercial
Chapter 8 Market Breakdown by Region
- Overview
- North America
- U.S.
- Canada
- Mexico
- Europe
- Germany
- France
- Italy
- Spain
- U.K.
- Rest of Europe
- Asia-Pacific
- China
- India
- Japan
- Australia
- South Korea
- Rest of Asia-Pacific
- Rest of World
- Middle East and Africa
- South America
Chapter 9 ESG Development
- Overview
- Digital Transformation and ESG are Closely Related
- Importance of ESG in the Digitalization of Utilities
- ESG for the Utility Industry
- Approaches Utilities Can Take to Achieve ESG Goals
- Challenges and Opportunities for Adopting ESG in the Power Sector
- Current Status of ESG in the Digital Utility Market
- Future of ESG with Digital Transformation
- Case Study: Examples of Successful Implementation of ESG
- Concluding Remarks from BCC Research
Chapter 10 Emerging Technologies and Developments
- Technology Overview
- Technological Trends in the Utility Sector
- Factors Shaping Utility Growth
Chapter 11 Patent Analysis
- Overview
- Patent Descriptions
Chapter 12 M&A and Funding Outlook
- Venture Capital in Digital Utility
Chapter 13 Competitive Intelligence
- Overview
- Market Share Analysis
- Strategy Analysis
- Product Mapping Analysis
- Product Mapping Analysis by Technology Type
Chapter 14 Company Profiles
- Overview
- ABB LTD.
- ACCENTURE PLC
- CAPGEMINI SE
- CISCO SYSTEMS INC.
- COGNIZANT
- E.ON SE
- EATON CORP. PLC
- GENERAL ELECTRIC
- INFOSYS LTD.
- INTERNATIONAL BUSINESS MACHINES CORP.
- MICROSOFT CORP.
- ORACLE CORP.
- SAP SE
- SIEMENS AG
- WIPRO LTD.
- Industry Organizations