|
|
市場調査レポート
商品コード
1262664
経皮吸収パッチの世界市場Transdermal Patches: Global Markets |
||||||
|
|
|||||||


| 経皮吸収パッチの世界市場 |
|
出版日: 2023年04月14日
発行: BCC Research
ページ情報: 英文 262 Pages
納期: 即納可能
|
- 全表示
- 概要
- 図表
- 目次
世界の経皮吸収パッチの市場規模は、2022年の67億米ドルから、予測期間中は5.6%のCAGRで推移し、2027年には88億米ドルの規模に成長すると予測されています。
疼痛緩和パッチの部門は2022年の21億米ドルから、3.6%のCAGRで推移し、2027年には25億米ドルの規模に成長すると予測されています。また、神経薬パッチの部門は、2022年の14億米ドルから、6.1%のCAGRで推移し、2027年には18億米ドルの規模に成長すると予測されています。
当レポートでは、世界の経皮吸収パッチの市場を調査し、市場および技術の概要、市場成長への各種影響因子の分析、市場規模の推移・予測、各種セグメント・地域別の詳細分析、競合情勢、主要企業のプロファイルなどをまとめています。
目次
第1章 イントロダクション
第2章 サマリー・ハイライト
第3章 市場概要
- 経皮ドラッグデリバリーシステムの概要
- 経皮ドラッグデリバリーのメカニズム
- 経皮ドラッグデリバリーの利点
- 経皮ドラッグデリバリーの欠点
- 経皮ドラッグデリバリーシステムのタイプ:システムタイプ/形態別
- 経皮吸収パッチ
- 経皮ドラッグデリバリーシステムのタイプ:技術タイプ別
- パッシブ経皮ドラッグデリバリーシステムの各種タイプ
- アクティブ経皮ドラッグデリバリーシステム
- アクティブ経皮ドラッグデリバリーシステムの各種タイプ
- 経皮ドラッグデリバリー技術/システムの臨床応用分野:概要
- 疼痛管理
- 中枢神経系疾患
- ホルモン
- 禁煙
- 乗り物酔い
- 心血管疾患
- その他
- 疼痛管理パッチ
- 慢性疼痛の有病率
- 疼痛管理パッチの動向
第4章 市場力学
- 市場力学
- 促進要因
- 抑制要因
- 機会
第5章 製薬業界に対するCOVID-19の影響
第6章 経皮吸収パッチの新技術
- 新興技術
- 経皮吸収型貼付剤・口腔内溶解フィルム(ODF)
- Nemaura Pharmaの経皮吸収技術
第7章 世界の経皮吸収パッチ市場:製品タイプ別
- ホルモンパッチ
- 神経薬パッチ
- ニコチンパッチ
- 心血管関連のパッチ
- 鎮痛パッチ
- 市場の見通し
- その他のパッチ
第8章 世界の経皮吸収パッチ市場:設計別
- 概要
- Microderm
- MacroPerm
- イオンパッチ
第9章 世界の経皮吸収パッチ市場:技術別
第10章 世界の経皮吸収パッチ市場:用途別
- 慢性疼痛
- 急性疼痛
- 神経疾患
- ホルモン
- 禁煙
- 心血管疾患
- その他
第11章 世界の経皮吸収パッチ市場:地域別
- 北米
- 欧州
- アジア太平洋
- その他の地域
第12章 競合情勢
- 世界の企業シェア分析
第13章 企業プロファイル
- ABBVIE INC.
- ALVOGEN
- AMNEAL PHARMACEUTICALS, INC.
- BAUSCH HEALTH COMPANIES INC.
- BAYER HEALTHCARE PHARMACEUTICALS
- ENDO PHARMACEUTICALS INC.
- GLAXOSMITHKLINE PLC
- GRUNENTHAL GMBH
- HISAMITSU PHARMACEUTICAL CO., INC.
- ICURE PHARMA INC.
- JOHNSON & JOHNSON
- LAVIPHARM S. A.
- LUYE PHARMA GROUP LTD.
- NOVARTIS AG
- PERRIGO COMPANY PLC
- PURDUE PHARMA L.P.
- SPARSHA PHARMA INTERNATIONAL PVT. LTD.
- TEVA PHARMACEUTICAL INDUSTRIES LTD.
- VIATRIS INC.
List of Tables
- Summary Table : Global Market for Transdermal Patches, by Product, Through 2027
- Table 1 : Difference Between Topical and Transdermal Drug Delivery Systems
- Table 2 : Currently Marketed Transdermal Drugs
- Table 3 : Classification of Transdermal Drugs Used for Pain management
- Table 4 : Products Categorized into OTC and Prescription Drugs
- Table 5 : Classification of Transdermal Drugs Used for Central Nervous System Disorder Treatments
- Table 6 : Classification of Transdermal Drugs Used for Motion Sickness Treatment
- Table 7 : Classification of Transdermal Drugs Used for Cardiovascular Disease Treatments
- Table 8 : Classification of Transdermal Drugs Used for Other Applications
- Table 9 : Classification of Pain Management Patches
- Table 10 : Prevalence of Chronic Pain and Percentage of Population Affected, by Country, 2018
- Table 11 : Coronavirus Reported Cases and Deaths, by Country, 2020
- Table 12 : Impact of COVID-19 on the Treatment of Chronic Pain
- Table 13 : Recent Advances in Transdermal Drug Delivery Systems
- Table 14 : Global Market for Transdermal Patches, by Product, Through 2027
- Table 15 : Types of Micro Needle (MN) Patches for long-acting Contraception
- Table 16 : Transdermal Patch Systems for Neurologic Conditions
- Table 17 : Benefits of Transdermal Patch Designs
- Table 18 : Global Market for Transdermal Patches, by Type of Pain Relief Patch, Through 2027
- Table 19 : Benefits of Transdermal Patch Designs
- Table 20 : Global Market for Transdermal Patches, by Design, Through 2027
- Table 21 : Global Market for Transdermal Patches, by Technology, Through 2027
- Table 22 : Global Market for Transdermal Patches, by Application, Through 2027
- Table 23 : North American Market for Transdermal Patches, by Product, Through 2027
- Table 24 : North American Market for Transdermal Patches, by Type of Pain Relief Patch, Through 2027
- Table 25 : North American Market for Transdermal Patches, by Design, Through 2027
- Table 26 : North American Market for Transdermal Patches, by Technology, Through 2027
- Table 27 : North American Market for Transdermal Patches, by Application, Through 2027
- Table 28 : North American Market for Transdermal Patches, by Country, Through 2027
- Table 29 : U.S. Market for Transdermal Patches, by Product, Through 2027
- Table 30 : U.S. Market for Transdermal Patches, by Type of Pain Relief Patch, Through 2027
- Table 31 : U.S. Market for Transdermal Patches, by Design, Through 2027
- Table 32 : U.S. Market for Transdermal Patches, by Technology, Through 2027
- Table 33 : U.S. Market for Transdermal Patches, by Application, Through 2027
- Table 34 : Canadian Market for Transdermal Patches, by Product, Through 2027
- Table 35 : Canadian Market for Transdermal Patches, by Type of Pain Relief Patch, Through 2027
- Table 36 : Canadian Market for Transdermal Patches, by Design, Through 2027
- Table 37 : Canadian Market for Transdermal Patches, by Technology, Through 2027
- Table 38 : Canadian Market for Transdermal Patches, by Application, Through 2027
- Table 39 : Mexican Market for Transdermal Patches, by Product, Through 2027
- Table 40 : Mexican Market for Transdermal Patches, by Type of Pain Relief Patch, Through 2027
- Table 41 : Mexican Market for Transdermal Patches, by Design, Through 2027
- Table 42 : Mexican Market for Transdermal Patches, by Technology, Through 2027
- Table 43 : Mexican Market for Transdermal Patches, by Application, Through 2027
- Table 44 : European Market for Transdermal Patches, by Product, Through 2027
- Table 45 : European Market for Transdermal Patches, by Type of Pain Relief Patch, Through 2027
- Table 46 : European Market for Transdermal Patches, by Design, Through 2027
- Table 47 : European Market for Transdermal Patches, by Technology, Through 2027
- Table 48 : European Market for Transdermal Patches, by Application, Through 2027
- Table 49 : European Market for Transdermal Patches, by Country, Through 2027
- Table 50 : German Market for Transdermal Patches, by Product, Through 2027
- Table 51 : German Market for Transdermal Patches, by Type of Pain Relief Patch, Through 2027
- Table 52 : German Market for Transdermal Patches, by Design, Through 2027
- Table 53 : German Market for Transdermal Patches, by Technology, Through 2027
- Table 54 : German Market for Transdermal Patches, by Application, Through 2027
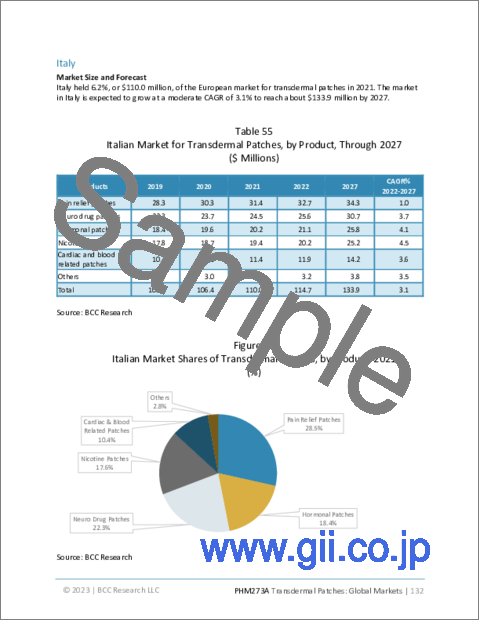
- Table 55 : Italian Market for Transdermal Patches, by Product, Through 2027
- Table 56 : Italian Market for Transdermal Patches, by Type of Pain Relief Patch, Through 2027
- Table 57 : Italian Market for Transdermal Patches, by Design, Through 2027
- Table 58 : Italian Market for Transdermal Patches, by Technology, Through 2027
- Table 59 : Italian Market for Transdermal Patches, by Application, Through 2027
- Table 60 : French Market for Transdermal Patches, by Product, Through 2027
- Table 61 : French Market for Transdermal Patches, by Type of Pain Relief Patch, Through 2027
- Table 62 : French Market for Transdermal Patches, by Design, Through 2027
- Table 63 : French Market for Transdermal Patches, by Technology, Through 2027
- Table 64 : French Market for Transdermal Patches, by Application, Through 2027
- Table 65 : UK Market for Transdermal Patches, by Product, Through 2027
- Table 66 : UK Market for Transdermal Patches, by Type of Pain Relief Patch, Through 2027
- Table 67 : UK Market for Transdermal Patches, by Design, Through 2027
- Table 68 : UK Market for Transdermal Patches, by Technology, Through 2027
- Table 69 : UK Market for Transdermal Patches, by Application, Through 2027
- Table 70 : Spanish Market for Transdermal Patches, by Product, Through 2027
- Table 71 : Spanish Market for Transdermal Patches, by Type of Pain Relief Patch, Through 2027
- Table 72 : Spanish Market for Transdermal Patches, by Design, Through 2027
- Table 73 : Spanish Market for Transdermal Patches, by Technology, Through 2027
- Table 74 : Spanish Market for Transdermal Patches, by Application, Through 2027
- Table 75 : Rest of European Market for Transdermal Patches, by Product, Through 2027
- Table 76 : Rest of European Market for Transdermal Patches, by Type of Pain Relief Patch, Through 2027
- Table 77 : Rest of European Market for Transdermal Patches, by Design, Through 2027
- Table 78 : Rest of European Market for Transdermal Patches, by Technology, Through 2027
- Table 79 : Rest of European Market for Transdermal Patches, by Application, Through 2027
- Table 80 : Asia-Pacific Market for Transdermal Patches, by Product, Through 2027
- Table 81 : Asia-Pacific Market for Transdermal Patches, by Type of Pain Relief Patch, Through 2027
- Table 82 : Asia-Pacific Market for Transdermal Patches, by Design, Through 2027
- Table 83 : Asia-Pacific Market for Transdermal Patches, by Technology, Through 2027
- Table 84 : Asia-Pacific Market for Transdermal Patches, by Application, Through 2027
- Table 85 : Asia-Pacific Market for Transdermal Patches, by Country, Through 2027
- Table 86 : Japanese Market for Transdermal Patches, by Product, Through 2027
- Table 87 : Japanese Market for Transdermal Patches, by Type of Pain Relief Patch, Through 2027
- Table 88 : Japanese Market for Transdermal Patches, by Design, Through 2027
- Table 89 : Japanese Market for Transdermal Patches, by Technology, Through 2027
- Table 90 : Japanese Market for Transdermal Patches, by Application, Through 2027
- Table 91 : Indian Market for Transdermal Patches, by Product, Through 2027
- Table 92 : Indian Market for Transdermal Patches, by Type of Pain Relief Patch, Through 2027
- Table 93 : Indian Market for Transdermal Patches, by Design, Through 2027
- Table 94 : Indian Market for Transdermal Patches, by Technology, Through 2027
- Table 95 : Indian Market for Transdermal Patches, by Application, Through 2027
- Table 96 : Australian Market for Transdermal Patches, by Product, Through 2027
- Table 97 : Australian Market for Transdermal Patches, by Type of Pain Relief Patch, Through 2027
- Table 98 : Australian Market for Transdermal Patches, by Design, Through 2027
- Table 99 : Australian Market for Transdermal Patches, by Technology, Through 2027
- Table 100 : Australian Market for Transdermal Patches, by Application, Through 2027
- Table 101 : Chinese Market for Transdermal Patches, by Product, Through 2027
- Table 102 : Chinese Market for Transdermal Patches, by Type of Pain Relief Patch, Through 2027
- Table 103 : Chinese Market for Transdermal Patches, by Design, Through 2027
- Table 104 : Chinese Market for Transdermal Patches, by Technology, Through 2027
- Table 105 : Chinese Market for Transdermal Patches, by Application, Through 2027
- Table 106 : Rest of Asia-Pacific Market for Transdermal Patches, by Product, Through 2027
- Table 107 : Rest of Asia-Pacific Market for Transdermal Patches, by Type of Pain Relief Patch, Through 2027
- Table 108 : Rest of Asia-Pacific Market for Transdermal Patches, by Design, Through 2027
- Table 109 : Rest of Asia-Pacific Market for Transdermal Patches, by Technology, Through 2027
- Table 110 : Rest of Asia-Pacific Market for Transdermal Patches, by Application, Through 2027
- Table 111 : Rest of the World Market for Transdermal Patches, by Product, Through 2027
- Table 112 : Rest of the World Market for Transdermal Patches, by Type of Pain Relief Patch, Through 2027
- Table 113 : Rest of the World Market for Transdermal Patches, by Design, Through 2027
- Table 114 : Rest of the World Market for Transdermal Patches, by Technology, Through 2027
- Table 115 : Rest of the World Market for Transdermal Patches, by Application, Through 2027
- Table 116 : Rest of the World Market for Transdermal Patches, by Country, Through 2027
- Table 117 : Brazilian Market for Transdermal Patches, by Product, Through 2027
- Table 118 : Brazilian Market for Transdermal Patches, by Type of Pain Relief Patch, Through 2027
- Table 119 : Brazilian Market for Transdermal Patches, by Design, Through 2027
- Table 120 : Brazilian Market for Transdermal Patches, by Technology, Through 2027
- Table 121 : Brazilian Market for Transdermal Patches, by Application, Through 2027
- Table 122 : Argentinian Market for Transdermal Patches, by Product, Through 2027
- Table 123 : Argentinian Market for Transdermal Patches, by Type of Pain Relief Patch, Through 2027
- Table 124 : Argentinian Market for Transdermal Patches, by Design, Through 2027
- Table 125 : Argentinian Market for Transdermal Patches, by Technology, Through 2027
- Table 126 : Argentinian Market for Transdermal Patches, by Application, Through 2027
- Table 127 : GCC Countries Market for Transdermal Patches, by Product, Through 2027
- Table 128 : GCC Countries Market for Transdermal Patches, by Type of Pain Relief Patch, Through 2027
- Table 129 : GCC Countries Market for Transdermal Patches, by Design, Through 2027
- Table 130 : GCC Countries Market for Transdermal Patches, by Technology, Through 2027
- Table 131 : GCC Countries Market for Transdermal Patches, by Application, Through 2027
- Table 132 : Rest of the World Countries Market for Transdermal Patches, by Product, Through 2027
- Table 133 : Rest of the World Countries Market for Transdermal Patches, by Type of Pain Relief Patch, Through 2027
- Table 134 : Rest of the World Countries Market for Transdermal Patches, by Design, Through 2027
- Table 135 : Rest of the World Countries Market for Transdermal Patches, by Technology, Through 2027
- Table 136 : Rest of the World Countries Market for Transdermal Patches, by Application, Through 2027
- Table 137 : Recent Company News, 2016-2022
- Table 138 : Products, Manufacturers, and Indication
- Table 139 : FDA Approved Transdermal Patches
- Table 140 : AbbVie: Product Portfolio
- Table 141 : AbbVie: Development & Strategy, 2022
- Table 142 : Alvogen: Product Portfolio
- Table 143 : Alvogen: Development & Strategy, 2020
- Table 144 : Amneal Pharmaceuticals, Inc.: Product Portfolio
- Table 145 : Amneal Pharmaceuticals, Inc.: Development & Strategy, 2021
- Table 146 : Bausch Health Companies Inc.: Product Portfolio
- Table 147 : Bausch Health Companies Inc.: Development & Strategy, 2022
- Table 148 : Bayer Healthcare Pharmaceuticals: Product Portfolio
- Table 149 : Bayer Healthcare Pharmaceuticals: Development & Strategy, 2018
- Table 150 : Endo Pharmaceuticals Inc.: Transdermal Patches Product Portfolio
- Table 151 : Endo Pharmaceuticals, Inc.: Development & Strategy, 2022
- Table 152 : GlaxoSmithKline plc: Transdermal Patch Product Portfolio
- Table 153 : GlaxoSmithKline: Development & Strategy, 2022
- Table 154 : Grunenthal: Transdermal Patches Product Portfolio
- Table 155 : Grunenthal: Development & Strategy, 2022
- Table 156 : Hisamitsu Pharmaceutical Co. Inc.: Rx Product Portfolio
- Table 157 : Hisamitsu Pharmaceutical Co. Inc.: OTC Pain Relief Products
- Table 158 : Hisamitsu Pharmaceutical Co. Inc.: Development & Strategy, 2021
- Table 159 : ICURE Pharma Inc.: Pain Management Patches Product Portfolio
- Table 160 : ICURE Pharma Inc.: Development & Strategy, 2022
- Table 161 : Johnson & Johnson: Transdermal Patches Product Portfolio
- Table 162 : Lavipharm: Transdermal Patches Product Portfolio
- Table 163 : Luye Pharma Group Ltd.: Transdermal Patches Product Portfolio
- Table 164 : Novartis AG: Transdermal Patches Product Portfolio
- Table 165 : Novartis AG: Development & Strategy, 2022
- Table 166 : Perrigo Company plc: Transdermal Drug Delivery Product Portfolio
- Table 167 : Purdue Pharma L.P.: Transdermal Patches Product Portfolio
- Table 168 : Sparsha Pharma International Pvt. Ltd.: Pain Management Patches Product Portfolio
- Table 169 : Sparsha Pharma International Pvt. Ltd: Development & Strategy, 2022
- Table 170 : Teva Pharmaceutical Industries Ltd.: Transdermal Patches Product Portfolio
- Table 171 : Teva Pharmaceutical Industries Ltd.: Development & Strategy, 2022
- Table 172 : Viatris Inc.: Transdermal Patches Product Portfolio
- Table 173 : Viatris Inc.: Development & Strategy, 2022
- Table 174 : List of Companies Certified as Innovative Pharmaceutical Companies in Korea
List of Figures
- Summary Figure : Global Market Shares of Transdermal Patches, by Product, 2021
- Figure 1 : Mechanism of Transdermal Drug Delivery System
- Figure 2 : Single Layer Drug in Adhesive Transdermal Delivery System
- Figure 3 : Multi-layer Drug in Adhesive Transdermal Delivery System
- Figure 4 : Matrix Transdermal Delivery System
- Figure 5 : Reservoir Transdermal Delivery System
- Figure 6 : Prevalence of Pain at Different Sites of the Body, 2014
- Figure 7 : Global 60+ Population, by Region, 2015-2050
- Figure 8 : Prevalence Rates of Chronic Pain in Different Age Groups, 2023
- Figure 9 : Global Projected Diabetes, Patients Aged 20-79, 2010 and 2030
- Figure 10 : Percentage of Population Affected by Chronic Pain, 2018
- Figure 11 : Identified Non-opioid Drug Distribution, by Indication, 2018
- Figure 12 : Korea Pharmaceutical Industry Development Strategy
- Figure 13 : Impact of COVID-19 on Pharma Industry
- Figure 14 : Snapshot of Major Products in the TAHO pipeline
- Figure 15 : Global Market Shares of Transdermal Patches, by Product, 2021
- Figure 16 : Global Market Shares of Transdermal Patches, by Type of Pain Relief Patch, 2021
- Figure 17 : Global Market Shares of Transdermal Patches, by Design, 2021
- Figure 18 : Global Market Shares of Transdermal Patches, by Technology, 2021
- Figure 19 : Global Market Shares for Transdermal Patches, by Application, 2021
- Figure 20 : North American Market Shares of Transdermal Patches, by Product, 2021
- Figure 21 : North American Market Shares of Transdermal Patches, by Type of Pain Relief Patch, 2021
- Figure 22 : North American Market Shares of Transdermal Patches, by Design, 2021
- Figure 23 : North American Market Shares of Transdermal Patches, by Technology, 2021
- Figure 24 : North American Market Shares of Transdermal Patches, by Application, 2021
- Figure 25 : North American Market Shares of Transdermal Patches, by Country, 2021
- Figure 26 : U.S. Market Shares of Transdermal Patches, by Product, 2021
- Figure 27 : U.S. Market Shares of Transdermal Patches, by Type of Pain Relief Patch, 2021
- Figure 28 : U.S. Market Shares of Transdermal Patches, by Design, 2021
- Figure 29 : U.S. Market Shares of Transdermal Patches, by Technology, 2021
- Figure 30 : U.S. Market Shares of Transdermal Patches, by Application, 2021
- Figure 31 : 65+ U.S. Population, 2010-2050
- Figure 32 : Canadian Market Shares of Transdermal Patches, by Product, 2021
- Figure 33 : Canadian Market Shares of Transdermal Patches, by Type of Pain Relief Patch, 2021
- Figure 34 : Canadian Market Shares of Transdermal Patches, by Design, 2021
- Figure 35 : Canadian Market Shares of Transdermal Patches, by Technology, 2021
- Figure 36 : Canadian Market Shares of Transdermal Patches, by Application, 2021
- Figure 37 : Canadian Cancer Statistics, 2022
- Figure 38 : Mexican Market Shares of Transdermal Patches, by Product, 2021
- Figure 39 : Mexican Market Shares of Transdermal Patches, by Type of Pain Relief Patch, 2021
- Figure 40 : Mexican Market Shares of Transdermal Patches, by Design, 2021
- Figure 41 : Mexican Market Shares of Transdermal Patches, by Technology, 2021
- Figure 42 : Mexican Market Shares of Transdermal Patches, by Application, 2021
- Figure 43 : European Market Shares of Transdermal Patches, by Product, 2021
- Figure 44 : European Market Shares of Transdermal Patches, by Type of Pain Relief Patch, 2021
- Figure 45 : European Market Shares of Transdermal Patches, by Design, 2021
- Figure 46 : European Market Shares of Transdermal Patches, by Technology, 2021
- Figure 47 : European Market Shares of Transdermal Patches, by Application, 2021
- Figure 48 : European Market Shares of Transdermal Patches, by Country, 2021
- Figure 49 : German Market Shares of Transdermal Patches, by Product, 2021
- Figure 50 : German Market Shares of Transdermal Patches, by Type of Pain Relief Patch, 2021
- Figure 51 : German Market Shares of Transdermal Patches, by Design, 2021
- Figure 52 : German Market Shares of Transdermal Patches, by Technology, 2021
- Figure 53 : German Market Shares of Transdermal Patches, by Application, 2021
- Figure 54 : Italian Market Shares of Transdermal Patches, by Product, 2021
- Figure 55 : Italian Market Shares of Transdermal Patches, by Type of Pain Relief Patch, 2021
- Figure 56 : Italian Market Shares of Transdermal Patches, by Design, 2021
- Figure 57 : Italian Market Shares of Transdermal Patches, by Technology, 2021
- Figure 58 : Italian Market Shares of Transdermal Patches, by Application, 2021
- Figure 59 : French Market Shares of Transdermal Patches, by Product, 2021
- Figure 60 : French Market Shares of Transdermal Patches, by Type of Pain Relief Patch, 2021
- Figure 61 : French Market Shares of Transdermal Patches, by Design, 2021
- Figure 62 : French Market Shares of Transdermal Patches, by Technology, 2021
- Figure 63 : French Market Shares of Transdermal Patches, by Application, 2021
- Figure 64 : UK Market Shares of Transdermal Patches, by Product, 2021
- Figure 65 : UK Market Shares of Transdermal Patches, by Type of Pain Relief Patch, 2021
- Figure 66 : UK Market Shares of Transdermal Patches, by Design, 2021
- Figure 67 : UK Market Shares of Transdermal Patches, by Technology, 2021
- Figure 68 : UK Market Shares of Transdermal Patches, by Application, 2021
- Figure 69 : Spanish Market Shares of Transdermal Patches, by Product, 2021
- Figure 70 : Spanish Market Shares of Transdermal Patches, by Type of Pain Relief Patch, 2021
- Figure 71 : Spanish Market Shares of Transdermal Patches, by Design, 2021
- Figure 72 : Spanish Market Shares of Transdermal Patches, by Technology, 2021
- Figure 73 : Spanish Market Shares of Transdermal Patches, by Application, 2021
- Figure 74 : Rest of European Market Shares of Transdermal Patches, by Product, 2021
- Figure 75 : Rest of European Market Shares of Transdermal Patches, by Type of Pain Relief Patch, 2021
- Figure 76 : Rest of European Market Shares of Transdermal Patches, by Design, 2021
- Figure 77 : Rest of European Market Shares of Transdermal Patches, by Technology, 2021
- Figure 78 : Rest of European Market Shares of Transdermal Patches, by Application, 2021
- Figure 79 : Asia-Pacific Market Shares of Transdermal Patches, by Product, 2021
- Figure 80 : Asia-Pacific Market Shares of Transdermal Patches, by Type of Pain Relief Patch, 2021
- Figure 81 : Asia-Pacific Market Shares of Transdermal Patches, by Design, 2021
- Figure 82 : Asia-Pacific Market Shares of Transdermal Patches, by Technology, 2021
- Figure 83 : Asia-Pacific Market Shares of Transdermal Patches, by Application, 2021
- Figure 84 : Asia-Pacific Market Shares of Transdermal Patches, by Country, 2021
- Figure 85 : Japanese Market Shares of Transdermal Patches, by Product, 2021
- Figure 86 : Japanese Market Shares of Transdermal Patches, by Type of Pain Relief Patch, 2021
- Figure 87 : Japanese Market Shares of Transdermal Patches, by Design, 2021
- Figure 88 : Japanese Market Shares of Transdermal Patches, by Technology, 2021
- Figure 89 : Japanese Market Shares of Transdermal Patches, by Application, 2021
- Figure 90 : Indian Market Shares of Transdermal Patches, by Product, 2021
- Figure 91 : Indian Market Shares of Transdermal Patches, by Type of Pain Relief Patch, 2021
- Figure 92 : Indian Market Shares of Transdermal Patches, by Design, 2021
- Figure 93 : Indian Market Shares of Transdermal Patches, by Technology, 2021
- Figure 94 : Indian Market Shares of Transdermal Patches, by Application, 2021
- Figure 95 : Australian Market Shares of Transdermal Patches, by Product, 2021
- Figure 96 : Australian Market Shares of Transdermal Patches, by Type of Pain Relief Patch, 2021
- Figure 97 : Australian Market Shares of Transdermal Patches, by Design, 2021
- Figure 98 : Australian Market Shares of Transdermal Patches, by Technology, 2021
- Figure 99 : Australian Market Shares of Transdermal Patches, by Application, 2021
- Figure 100 : Chinese Market Shares of Transdermal Patches, by Product, 2021
- Figure 101 : Chinese Market Shares of Transdermal Patches, by Type of Pain Relief Patch, 2021
- Figure 102 : Chinese Market Shares of Transdermal Patches, by Design, 2021
- Figure 103 : Chinese Market Shares of Transdermal Patches, by Technology, 2021
- Figure 104 : Chinese Market Shares of Transdermal Patches, by Application, 2021
- Figure 105 : Rest of Asia-Pacific Market Shares of Transdermal Patches, by Product, 2021
- Figure 106 : Rest of Asia-Pacific Market Shares of Transdermal Patches, by Type of Pain Relief Patch, 2021
- Figure 107 : Rest of Asia-Pacific Market Shares of Transdermal Patches, by Design, 2021
- Figure 108 : Rest of Asia-Pacific Market Shares of Transdermal Patches, by Technology, 2021
- Figure 109 : Rest of Asia-Pacific Market Shares of Transdermal Patches, by Application, 2021
- Figure 110 : Rest of the World Market Shares of Transdermal Patches, by Product, 2021
- Figure 111 : Rest of the World Market Shares of Transdermal Patches, by Type of Pain Relief Patch, 2021
- Figure 112 : Rest of the World Market Shares of Transdermal Patches, by Design, 2021
- Figure 113 : Rest of the World Market Shares of Transdermal Patches, by Technology, 2021
- Figure 114 : Rest of the World Market Shares of Transdermal Patches, by Application, 2021
- Figure 115 : Rest of the World Market Shares of Transdermal Patches, by Country, 2021
- Figure 116 : Brazilian Market Shares of Transdermal Patches, by Product, 2021
- Figure 117 : Brazilian Market Shares of Transdermal Patches, by Type of Pain Relief Patch, 2021
- Figure 118 : Brazilian Market Shares of Transdermal Patches, by Design, 2021
- Figure 119 : Brazilian Market Shares of Transdermal Patches, by Technology, 2021
- Figure 120 : Brazilian Market Shares of Transdermal Patches, by Application, 2021
- Figure 121 : Argentinian Market Shares of Transdermal Patches, by Product, 2021
- Figure 122 : Argentinian Market Shares of Transdermal Patches, by Type of Pain Relief Patch, 2021
- Figure 123 : Argentinian Market Shares of Transdermal Patches, by Design, 2021
- Figure 124 : Argentinian Market Shares of Transdermal Patches, by Technology, 2021
- Figure 125 : Argentinian Market Shares of Transdermal Patches, by Application, 2021
- Figure 126 : GCC Countries Market Shares of Transdermal Patches, by Product, 2021
- Figure 127 : GCC Countries Market Shares of Transdermal Patches, by Type of Pain Relief Patch, 2021
- Figure 128 : GCC Countries Market Shares of Transdermal Patches, by Design, 2021
- Figure 129 : GCC Countries Market Shares of Transdermal Patches, by Technology, 2021
- Figure 130 : GCC Countries Market Shares of Transdermal Patches, by Application, 2021
- Figure 131 : Rest of the World Countries Market Shares of Transdermal Patches, by Product, 2021
- Figure 132 : Rest of the World Countries Market Shares of Transdermal Patches, by Type of Pain Relief Patch, 2021
- Figure 133 : Rest of the World Countries Market Shares of Transdermal Patches, by Design, 2021
- Figure 134 : Rest of the World Countries Market Shares of Transdermal Patches, by Technology, 2021
- Figure 135 : Rest of the World Countries Market Shares of Transdermal Patches, by Application, 2021
- Figure 136 : Global Market Shares of Transdermal Patches, by Company, 2021
- Figure 137 : AbbVie: Financial Performance, 2019-2021
- Figure 138 : AbbVie: Revenue Share, by Region, 2021
- Figure 139 : Bausch Health Companies Inc.: Financial Performance, 2020 and 2021
- Figure 140 : Bausch Health Companies Inc.: Revenue Share, by Segment, 2021
- Figure 141 : Bayer Healthcare Pharmaceuticals: Financial Performance, 2020 and 2021
- Figure 142 : Endo Pharmaceuticals Inc.: Annual Revenue, 2016-2021
- Figure 143 : Endo Pharmaceuticals Inc.: Revenue Share, by Established Product, 2019
- Figure 144 : GlaxoSmithKline plc: Annual Revenue, 2017-2021
- Figure 145 : GlaxoSmithKline plc: Revenue Share, by Consumer Healthcare, 2019
- Figure 146 : Grunenthal: Annual Revenue, 2018-2022
- Figure 147 : Hisamitsu Pharmaceutical Co. Inc.: Annual Revenue, 2018-2022
- Figure 148 : ICURE Pharma Inc.: Annual Revenue, 2018-2021
- Figure 149 : Johnson & Johnson: Annual Revenue, 2016-2021
- Figure 150 : Novartis AG: Annual Revenue, 2015-2019
- Figure 151 : Teva Pharmaceutical Industries Ltd.: Generic Segment Annual Revenue, 2016-2021
- Figure 152 : Teva Pharmaceutical Industries Ltd.: Revenue Share, by Region, 2019
- Figure 153 : Viatris Inc.: Annual Revenue, 2020-2022
Highlights:
The global market for transdermal patches is estimated to increase from $6.7 billion in 2022 to reach $8.8 billion by 2027, at a compound annual growth rate (CAGR) of 5.6% from 2022 through 2027.
Pain relief patches market for transdermal patches is estimated to increase from $2.1 billion in 2022 to reach $2.5 billion by 2027, at a CAGR of 3.6% from 2022through 2027.
Neuro drug patches market for transdermal patches is estimated to increase from $1.4 billion in 2022 to reach $1.8 billion by 2027, at a CAGR of 6.1% from 2022 through 2027.
Report Scope:
This report aims to provide a comprehensive study of the global market for transdermal patches. It provides a detailed description of the different types of transdermal patch products and technology, as well as their current and historical market revenues.
Transdermal patches can be separated by their differing designs and technology, along with their applications. Transdermal patch technologies include matrix, reservoir, and other transdermal drug delivery technologies/systems.
This report also covers a detailed study of therapeutic applications of transdermal drug delivery, including pain, central nervous system disorders, hormonal applications, smoking cessation, motion sickness, cardiovascular disorders, and others. This in-depth analysis of the global market for transdermal patches includes historical data and market projections for sales segment by technology/system type, product, application, design, and region.
For in-depth understanding of the market, profiles of market participants, key marketed products, competitive landscape, key competitors, and their respective market shares have been provided. This report also discusses driving and restraining factors of the global transdermal drug delivery technologies/devices market.
Report Includes:
- 122 data tables and 53 additional tables
- An overview of the global transdermal patches market
- Estimation of the market size and analyses of global market trends, with data from 2019-2022, with projections of compound annual growth rates (CAGRs) through 2027
- Highlights of the current and future market potential and quantification of transdermal patches market based on type, design, technology, application, and region
- Identification of market drivers, restraints and other forces impacting the global market and evaluation of current market size and forecast
- Analysis of transdermal patches pipeline products with focus on promising pipeline molecules/ drugs in development, and coverage of technological advances, scientific discoveries, and new therapies
- Detailed analysis of the regulatory framework and policies, and snapshot of transdermal drug delivery system
- Market share analysis of the key companies of the industry and coverage of their proprietary technologies, strategic alliances, and other key market strategies and a relevant patent analysis
- Comprehensive company profiles of the leading players of the industry, including GlaxoSmithKline, Hisamitsu Pharmaceutical, Johnson & Johnson, Mylan Pharmaceuticals inc. (Viatris), Novartis and Teva Pharmaceutical Industries Ltd.
Table of Contents
Chapter 1 Introduction
- 1.1 Study Goals and Objectives
- 1.2 Reasons for Doing This Study
- 1.3 Scope of Report
- 1.4 Information Sources
- 1.5 Methodology
- 1.6 Geographic Breakdown
- 1.7 Analyst's Credentials
- 1.8 BCC Custom Research
- 1.9 Related BCC Research Reports
Chapter 2 Summary and Highlights
Chapter 3 Market Overview
- 3.1 Overview of Transdermal Drug Delivery Systems
- 3.2 Mechanism of Transdermal Drug Delivery
- 3.3 Advantages of Transdermal Drug Delivery
- 3.4 Disadvantages of Transdermal Drug Delivery
- 3.5 Types of Transdermal Drug Delivery Systems Based on System Types/Forms
- 3.5.1 Transdermal Patch
- 3.6 Types of Transdermal Drug Delivery Systems Based on Technology Types
- 3.6.1 Types of Passive Transdermal Drug Delivery Systems
- 3.6.2 Active Transdermal Drug Delivery Systems
- 3.6.3 Types of Active Transdermal Drug Delivery System
- 3.4 Overview of Clinical Application Areas of Transdermal Drug Delivery Technologies/Systems
- 3.4.1 Pain Management
- 3.4.2 Central Nervous System Disorders
- 3.4.3 Hormonal Applications
- 3.4.4 Smoking Cessation
- 3.4.5 Motion Sickness
- 3.4.6 Cardiovascular Diseases
- 3.4.7 Others
- 3.5 Pain Management Patches
- 3.5.1 Prevalence of Chronic Pain
- 3.5.2 Trends in Pain Management Patches
Chapter 4 Market Dynamics
- 4.1 Market Dynamics
- 4.1.1 Drivers
- 4.1.2 Restraints
- 4.1.3 Opportunities
Chapter 5 Impact of COVID-19 on Pharma Industry
- 5.1 Overview
- 5.2 Short-term Impact on the Pharma Industry
- 5.3 Long-term Impact on the Pharma Industry
- 5.4 COVID-19 and Pain Management
- 5.4.1 Telemedicine
Chapter 6 Emerging Technology in Transdermal Patches
- 6.1 Emerging Technology
- 6.1.1 Transdermal Patches and Orally Dissolving Film (ODF)
- 6.1.2 Nemaura Pharma Transdermal Technology
Chapter 7 Global Market for Transdermal Patches by Product Type
- 7.1 Introduction
- 7.2 Hormonal Patches
- 7.3 Neuro Drug Patches
- 7.4 Nicotine Patches
- 7.5 Cardiac and Blood-related Patches
- 7.6 Pain Relief Patches
- 7.6.1 Market Outlook
- 7.7 Other Patches
Chapter 8 Global Market for Transdermal Patches by Design
- 8.1 Overview
- 8.2 Microderm
- 8.3 Macroperm
- 8.4 IontoPatch
Chapter 9 Global Market for Transdermal Patches by Technology
- 9.1 Global Market for Transdermal Patches by Technology
Chapter 10 Global Market for Transdermal Patches by Application
- 10.1 Global Market for Transdermal Patches by Application
- 10.2 Chronic Pain
- 10.3 Acute Pain
- 10.4 Neural Diseases
- 10.5 Hormonal Applications
- 10.6 Smoking Cessation
- 10.7 Cardiac and Blood Diseases
- 10.8 Other Applications
Chapter 11 Global Market for Transdermal Patches by Region
- 11.1 Global Markets for Transdermal Patches by Region
- 11.2 North America
- 11.2.1 United States
- 11.2.2 Canada
- 11.2.3 Mexico
- 11.3 Europe
- 11.3.1 Germany
- 11.3.2 Italy
- 11.3.3 France
- 11.3.4 United Kingdom
- 11.3.5 Spain
- 11.3.6 Rest of Europe
- 11.4 Asia-Pacific
- 11.4.1 Japan
- 11.4.2 India
- 11.4.3 Australia
- 11.4.4 China
- 11.4.5 Rest of Asia-Pacific
- 11.5 Rest of the World
- 11.5.1 Brazil
- 11.5.2 Argentina
- 11.5.3 GCC Countries
- 11.5.4 Rest of the World Countries
Chapter 12 Competitive Landscape
- 12.1 Global Analysis of Company Shares
Chapter 13 Company Profiles
- ABBVIE INC.
- ALVOGEN
- AMNEAL PHARMACEUTICALS, INC.
- BAUSCH HEALTH COMPANIES INC.
- BAYER HEALTHCARE PHARMACEUTICALS
- ENDO PHARMACEUTICALS INC.
- GLAXOSMITHKLINE PLC
- GRUNENTHAL GMBH
- HISAMITSU PHARMACEUTICAL CO., INC.
- ICURE PHARMA INC.
- JOHNSON & JOHNSON
- LAVIPHARM S. A.
- LUYE PHARMA GROUP LTD.
- NOVARTIS AG
- PERRIGO COMPANY PLC
- PURDUE PHARMA L.P.
- SPARSHA PHARMA INTERNATIONAL PVT. LTD.
- TEVA PHARMACEUTICAL INDUSTRIES LTD.
- VIATRIS INC.