|
|
市場調査レポート
商品コード
1230310
風力タービン:技術・用途・世界市場Wind Turbines: Technologies, Applications and Global Markets |
||||||
|
|
|||||||


| 風力タービン:技術・用途・世界市場 |
|
出版日: 2023年03月02日
発行: BCC Research
ページ情報: 英文 248 Pages
納期: 即納可能
|
- 全表示
- 概要
- 図表
- 目次
世界の風力タービンの市場規模は、2022年の852億米ドルから、2027年には1,160億米ドルに達し、2022年から2027年にかけての予測期間中は6.4%のCAGRで成長すると予測されています。
北米地域は、2022年の216億米ドルから、2027年には279億米ドルに達し、同期間中はCAGR5.2%で成長すると予測されています。また、アジア太平洋地域は、2022年の448億米ドルから、2027年には629億米ドルに達し、同期間中はCAGR7.0%で成長すると予測されています。
当レポートでは、世界の風力タービンの市場を調査し、市場および技術の概要、市場成長への各種影響因子の分析、市場規模の推移・予測、各種区分・地域別の詳細分析、競合環境、主要企業のプロファイルなどをまとめています。
目次
第1章 イントロダクション
第2章 サマリー・ハイライト
第3章 市場概要
- 現在の市場概要
- 風力タービンの歴史と進化
- 風力タービン産業の発展
- 動向
- 風力タービンの進歩
- 風力タービン部品
- 政府の規制とインセンティブ:風力産業における技術的問題
- 風力発電プロジェクトの基礎
- 風力プロジェクトの開発手順
- 風力タービンの認証と試験
- 用途・利点・課題
- タービン効率の改善
- 風力タービンタイプ
- 風力タービン用途の種類
- 風力タービン市場のバリューチェーン分析
- ポーターのファイブフォースモデル
- PESTLE分析
- COVID-19の影響
- ロシア・ウクライナ戦争の影響
第4章 世界市場の力学
- 概要
- 市場力学
- 世界市場促進要因
- 世界市場抑制要因
- 現在の市場動向
- 市場機会
第5章 市場内訳:タービンタイプ別
- 概要
- タービンタイプ別
- 水平軸タービン
- 垂直軸タービン
- 北米市場:タービンタイプ別
- 欧州市場:タービンタイプ別
- アジア太平洋市場:タービンタイプ別
- その他の地域市場:タービンタイプ別
第6章 市場内訳:設置区分別
- 概要
- 設置区分別
- オンショア
- オフショア
- 北米市場:設置区分別
- 欧州市場:設置区分別
- アジア太平洋市場:設置区分別
- その他の地域市場:設置区分別
第7章 市場内訳:グリッド接続別
- グリッド接続別
- オングリッド
- オフグリッド
- 北米市場:グリッド接続別
- 欧州市場:グリッド接続別
- アジア太平洋市場:グリッド接続別
- その他の地域市場:グリッド接続別
第8章 市場内訳:エンドユーザー別
- 概要
- エンドユーザー別
- 独立系発電事業者
- 投資家所有ユーティリティ
- 公共電力会社
- 農村電気協同組合
- 北米市場:エンドユーザー別
- 欧州市場:エンドユーザー別
- アジア太平洋市場:エンドユーザー別
- その他の地域市場:エンドユーザー別
第9章 市場内訳:容量定格別
- 概要
- 容量定格別
- 2MW未満
- 2~4MW
- 4MW超
- 北米市場:容量定格別
- 欧州市場:容量定格別
- アジア太平洋市場:容量定格別
- その他の地域市場:容量定格別
第10章 市場内訳:エンドユーザー産業別
- 概要
- エンドユーザー産業別
- 住宅
- 産業
- 商業
- ユーティリティ
- 北米市場:エンドユーザー産業別
- 欧州市場:エンドユーザー産業別
- アジア太平洋市場:エンドユーザー産業別
- その他の地域市場:エンドユーザー産業別
第11章 市場内訳:地域別
- 概要
- 地域別
- 北米市場:国別
- 欧州市場:国別
- アジア太平洋市場:国別
- その他の地域市場:地域別
第12章 特許分析
第13章 競合情勢
- 概要
- 戦略分析
- 主要企業
- 市場シェア分析
- 風力タービン産業の構造
- 製品ポートフォリオ分析
- 主な展開
- 風力タービン市場の情報リソース
第14章 企業プロファイル
- CRRC CORP. LTD.
- ENERCON GMBH
- ENVISION ENERGY USA LTD.
- GENERAL ELECTRIC
- GUODIAN UNITED POWER TECHNOLOGY CO. LTD.
- HYOSUNG HEAVY INDUSTRIES
- MINGYANG SMART ENERGY GROUP CO. LTD.
- NORDEX SE
- SANY RENEWABLE ENERGY CO. LTD.
- SEAWIND OCEAN TECHNOLOGY HOLDING B.V.
- SHANGHAI ELECTRIC GROUP CO. LTD.
- SIEMENS GAMESA RENEWABLE ENERGY
- SINOVEL WIND GROUP CO. LTD.
- SUZLON ENERGY LTD.
- VESTAS WIND SYSTEMS A/S
- XINJIANG GOLDWIND SCIENCE & TECHNOLOGY CO. LTD.
- ZHEJIANG WINDEY CO. LTD.
第15章 付録:頭字語
List of Tables
- Summary Table : Global Market for Wind Turbines, by Region, Through 2027
- Table 1 : Current Achievements in the Wind Turbine Industry, 2022
- Table 2 : Sub-component Breakdown for Wind Turbines
- Table 3 : Standard Tower Height for Various Turbine Capacities
- Table 4 : Weights of Turbine Components for Various Vestas Wind Systems A/S Turbines
- Table 5 : Comparison of Capital Cost Breakdown for Typical Onshore and Offshore Wind Turbine Project
- Table 6 : New Projects for Offshore Wind Technology, August 2022-December 2022
- Table 7 : Global Market for Wind Turbines, by Type, Through 2027
- Table 8 : North American Market for Wind Turbines, by Type, Through 2027
- Table 9 : European Market for Wind Turbines, by Type, Through 2027
- Table 10 : Asia-Pacific Market for Wind Turbines, by Type, Through 2027
- Table 11 : Rest of the World Market for Wind Turbines, by Type, Through 2027
- Table 12 : Global Market for Wind Turbines, by Type of Installation, Through 2027
- Table 13 : North American Market for Wind Turbines, by Type of Installation, Through 2027
- Table 14 : European Market for Wind Turbines, by Type of Installation, Through 2027
- Table 15 : Asia-Pacific Market for Wind Turbines, by Type of Installation, Through 2027
- Table 16 : Rest of the World Market for Wind Turbines, by Type of Installation, Through 2027
- Table 17 : Global Market for Wind Turbines, by Grid Connectivity, Through 2027
- Table 18 : North American Market for Wind Turbines, by Grid Connectivity, Through 2027
- Table 19 : European Market for Wind Turbines, by Grid Connectivity, Through 2027
- Table 20 : Asia-Pacific Market for Wind Turbines, by Grid Connectivity, Through 2027
- Table 21 : Rest of the World Market for Wind Turbines, by Grid Connectivity, Through 2027
- Table 22 : Global Market for Wind Turbines, by End User, Through 2027
- Table 23 : North American Market for Wind Turbines, by End User, Through 2027
- Table 24 : European Market for Wind Turbines, by End User, Through 2027
- Table 25 : Asia-Pacific Market for Wind Turbines, by End User, Through 2027
- Table 26 : Rest of the World Market for Wind Turbines, by End User, Through 2027
- Table 27 : Global Market for Wind Turbines, by Capacity Rating, Through 2027
- Table 28 : North American Market for Wind Turbines, by Capacity Rating, Through 2027
- Table 29 : European Market for Wind Turbines, by Capacity Rating, Through 2027
- Table 30 : Asia-Pacific Market for Wind Turbines, by Capacity Rating, Through 2027
- Table 31 : Rest of the World Market for Wind Turbines, by Capacity Rating, Through 2027
- Table 32 : Global Market for Wind Turbines, by End-Use Sector, Through 2027
- Table 33 : North American Market for Wind Turbines, by End-Use Sector, Through 2027
- Table 34 : European Market for Wind Turbines, by End-Use Sector, Through 2027
- Table 35 : Asia-Pacific Market for Wind Turbines, by End-Use Sector, Through 2027
- Table 36 : Rest of the World Market for Wind Turbines, by End-Use Sector, Through 2027
- Table 37 : Global Market for Wind Turbines, by Region, Through 2027
- Table 38 : North American Market for Wind Turbines, by Country, Through 2027
- Table 39 : European Market for Wind Turbines, by Country, Through 2027
- Table 40 : Asia-Pacific Market for Wind Turbines, by Country, Through 2027
- Table 41 : Rest of the World Market for Wind Turbines, by Subregion, Through 2027
- Table 42 : Patents Published on Turbine Components, Jan. 2021-Dec. 2022
- Table 43 : Competitive Information on the Top Players in the Global Market for Wind Turbines, 2021
- Table 44 : Product Mapping Analysis for Top Companies
- Table 45 : Product Mapping by Installation Site
- Table 46 : New Product Launches in the Global Market for Wind Turbines, by Key Players, Jan. 2021-Dec. 2022
- Table 47 : Major Acquisitions in the Global Market for Wind Turbines, by Key Players, Jan. 2021-Dec. 2022
- Table 48 : Collaborations in the Global Market for Wind Turbines, by Key Players, Jan. 2021-Dec. 2022
- Table 49 : Expansions in the Global Market for Wind Turbines, by Key Players, Jan. 2021-Mar. 2022
- Table 50 : Contracts/Partnership/Agreements/Joint Ventures in the Global Market for Wind Turbines, by Key Players, Jan. 2021-Dec. 2022
- Table 51 : Information Resources in the Market for Wind Turbines
- Table 52 : CRRC Corp. Ltd.: Financial Overview, 2019-2021
- Table 53 : CRRC Corp. Ltd.: Product Portfolio
- Table 54 : ENERCON GmbH: Product Portfolio
- Table 55 : Envision Energy USA Ltd.: Product Portfolio
- Table 56 : General Electric: Recent Developments, 2022
- Table 57 : General Electric: Financial Overview, 2019-2021
- Table 58 : General Electric: Product Portfolio
- Table 59 : Guodian United Power Technology Co. Ltd.: Product Portfolio
- Table 60 : Hyosung Heavy Industries: Financial Overview, 2019-2021
- Table 61 : Hyosung Heavy Industries: Product Portfolio
- Table 62 : Ming Yang Smart Energy Group Co. Ltd.: Product Portfolio
- Table 63 : Nordex SE: Financial Overview, 2019-2021
- Table 64 : Nordex SE: Product Portfolio
- Table 65 : Sany Renewable Energy Co. Ltd.: Product Portfolio
- Table 66 : Seawind Ocean Technology Holding B.V.: Product Portfolio
- Table 67 : Shanghai Electric Wind Power Group Co. Ltd.: Financial Overview, 2019-2021
- Table 68 : Shanghai Electric Wind Power Group Co. Ltd.: Product Portfolio
- Table 69 : Siemens Gamesa: Financial Overview, 2019-2021
- Table 70 : Siemens Gamesa: Product Portfolio
- Table 71 : Sinovel Wind Group Co. Ltd.: Product Portfolio
- Table 72 : Suzlon Energy Ltd.: Financial Overview, 2019-2021
- Table 73 : Suzlon Energy Ltd.: Product Portfolio
- Table 74 : Vestas Wind Systems A/S: Recent Developments, 2022
- Table 75 : Vestas Wind Systems A/S: Financial Overview, 2019-2021
- Table 76 : Vestas Wind Systems A/S: Product Portfolio
- Table 77 : Xinjiang Goldwind Science & Technology Co. Ltd.: Financial Overview, 2019-2021
- Table 78 : Xinjiang Goldwind Science & Technology Co. Ltd.: Product Portfolio
- Table 79 : Zhejiang Windey Co. Ltd.: Product Portfolio
- Table 80 : Acronyms Used in This Report
List of Figures
Figure A : Research Methodology Steps Adopted for the Global Market for Wind Turbines
- Summary Figure : Global Market Shares of Wind Turbines, by Region, 2021
- Figure 1 : New Upgrades for Wind Turbines
- Figure 2 : Increase in Hub Height (in Feet) in Relation to Turbine Capacity
- Figure 3 : Variables and Costs Involved in Wind Energy Projects
- Figure 4 : Parameters to Achieve Equitable Cost of Wind Energy Projects
- Figure 5 : Steps for Development of Wind Projects
- Figure 6 : Certification and Testing of Wind Turbines
- Figure 7 : Benefits of Wind Energy Over Conventional Energy Sources
- Figure 8 : Drawbacks of Wind Energy
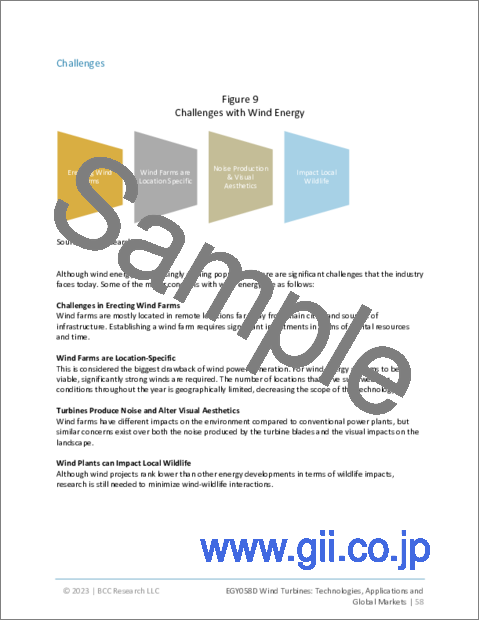
- Figure 9 : Challenges with Wind Energy
- Figure 10 : Types of Wind Turbines
- Figure 11 : Off-Grid Wind Turbine
- Figure 12 : On-Grid Wind Turbine
- Figure 13 : Value Chain for Wind Turbines
- Figure 14 : Porter's Five Forces Model of the Market for Wind Turbines
- Figure 15 : PESTLE Analysis of the Market for Wind Turbines
- Figure 16 : Driving Forces of the Global Market for Wind Turbines
- Figure 17 : Renewable Power Capacity Growth, 2017-2021
- Figure 18 : Increase in Demand for Electricity, 2017-2022
- Figure 19 : Major Restraints in the Global Market for Wind Turbines
- Figure 20 : Current Trends in the Global Market for Wind Turbines
- Figure 21 : New Offshore Wind Energy Installation Capacity, 2017-2022
- Figure 22 : Increase in Rotor Size Leads Growth in Power Rating
- Figure 23 : Opportunities in the Global Market for Wind Turbines
- Figure 24 : Global Market Shares of Wind Turbines, by Type, 2021
- Figure 25 : North American Market Shares of Wind Turbines, by Type, 2021
- Figure 26 : European Market Shares of Wind Turbines, by Type, 2021
- Figure 27 : Asia-Pacific Market Shares of Wind Turbines, by Type, 2021
- Figure 28 : Rest of the World Market Shares of Wind Turbines, by Type, 2021
- Figure 29 : Global Market Shares of Wind Turbines, by Type of Installation, 2021
- Figure 30 : North American Market Shares of Wind Turbines, by Type of Installation, 2021
- Figure 31 : European Market Shares of Wind Turbines, by Type of Installation, 2021
- Figure 32 : Asia-Pacific Market Shares of Wind Turbines, by Type of Installation, 2021
- Figure 33 : Rest of the World Market Shares of Wind Turbines, by Type of Installation, 2021
- Figure 34 : Global Market Shares of Wind Turbines, by Grid Connectivity, 2021
- Figure 35 : North American Market Shares of Wind Turbines, by Grid Connectivity, 2021
- Figure 36 : European Market Shares of Wind Turbines, by Grid Connectivity, 2021
- Figure 37 : Asia-Pacific Market Shares of Wind Turbines, by Grid Connectivity, 2021
- Figure 38 : Rest of the World Market Shares of Wind Turbines, by Grid Connectivity, 2021
- Figure 39 : Global Market Shares of Wind Turbines, by End User, 2021
- Figure 40 : North American Market Shares of Wind Turbines, by End User, 2021
- Figure 41 : European Market Shares of Wind Turbines, by End User, 2021
- Figure 42 : Asia-Pacific Market Shares of Wind Turbines, by End User, 2021
- Figure 43 : Rest of the World Market Shares of Wind Turbines, by End User, 2021
- Figure 44 : Global Market Shares of Wind Turbines, by Capacity Rating, 2021
- Figure 45 : North American Market Shares of Wind Turbines, by Capacity Rating, 2021
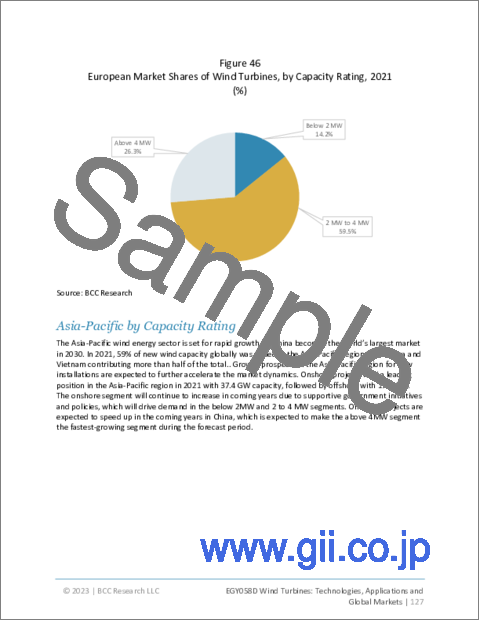
- Figure 46 : European Market Shares of Wind Turbines, by Capacity Rating, 2021
- Figure 47 : Asia-Pacific Market Shares of Wind Turbines, by Capacity Rating, 2021
- Figure 48 : Rest of the World Market Shares of Wind Turbines, by Capacity Rating, 2021
- Figure 49 : Global Market Shares of Wind Turbines, by End-Use Sector, 2021
- Figure 50 : North American Market Shares of Wind Turbines, by End-Use Sector, 2021
- Figure 51 : European Market Shares of Wind Turbines, by End-Use Sector, 2021
- Figure 52 : Asia-Pacific Market Shares of Wind Turbines, by End-Use Sector, 2021
- Figure 53 : Rest of the World Market Shares of Wind Turbines, by End-Use Sector, 2021
- Figure 54 : Global Market Shares of Wind Turbines, by Region, 2021
- Figure 55 : North American Market Shares of Wind Turbines, by Country, 2021
- Figure 56 : European Market Shares of Wind Turbines, by Country, 2021
- Figure 57 : Asia-Pacific Market Shares of Wind Turbines, by Country, 2021
- Figure 58 : Rest of the World Market Shares of Wind Turbines, by Subregion, 2021
- Figure 59 : Shares of Patents Registered on Wind Turbines, by Assignee Country, 2021
- Figure 60 : Shares of Patents Registered on Wind Turbines, by Assignee Country, 2022*
- Figure 61 : Shares of Patents Registered on Wind Turbines, by Top 10 Companies, 2021-2022
- Figure 62 : Shares of Strategic Initiatives by Top Companies in the Global Market for Wind Turbines, Jan. 2021-Dec. 2022
- Figure 63 : Wind Turbine Industry Structure
- Figure 64 : CRRC Corp. Ltd.: Sales Share, by Segment, December, 2021
- Figure 65 : CRRC Corp. Ltd.: Sales Share, by Region, December, 2021
- Figure 66 : CRRC Corp. Ltd.: SWOT Analysis
- Figure 67 : General Electric: Sales Share, by Business Segment, December, 2021
- Figure 68 : General Electric: Sales Share, by Region, December, 2021
- Figure 69 : General Electric: SWOT Analysis
- Figure 70 : Hyosung Heavy Industries: SWOT Analysis
- Figure 71 : Nordex SE: Sales Share, by Segment, December, 2021
- Figure 72 : Nordex SE: Sales Share, by Region, December, 2021
- Figure 73 : NORDEX SE.: SWOT Analysis
- Figure 74 : Shanghai Electric Wind Power Group Co. Ltd.: Sales Share, by Segment, 2021
- Figure 75 : Shanghai Electric Wind Power Group Co. Ltd.: SWOT Analysis
- Figure 76 : Siemens Gamesa: Sales Share, by Segment, as of September, 2021
- Figure 77 : Siemens Gamesa: Sales Share, by Region, as of September, 2021
- Figure 78 : Siemens Gamesa: SWOT Analysis
- Figure 79 : Suzlon Energy Ltd.: Sales Share, by Segment, as of March 2022
- Figure 80 : Suzlon Energy Ltd.: Sales Share, by Region, as of March 2022Suzlon Energy Ltd.: Sales Share, by Region, as of March 2022
- Figure 81 : Suzlon Energy Ltd.: SWOT Analysis
- Figure 82 : Vestas Wind Systems A/S: Sales Share, by Business Segment, December 2021
- Figure 83 : Vestas Wind Systems A/S: Sales Share, by Region, December 2021
- Figure 84 : Vestas Wind Systems A/S: SWOT Analysis
- Figure 85 : Xinjiang Goldwind Science & Technology Co. Ltd.: Sales Share, by Business Segment, December, 2021
- Figure 86 : Xinjiang Goldwind Science & Technology Co. Ltd.: Sales Share, by Region, December, 2021
- Figure 87 : Xinjiang Goldwind Science & Technology Co. Ltd.: SWOT Analysis
Highlights:
The global market for wind turbines is estimated to increase from $85.2 billion in 2022 to reach $116.0 billion by 2027, at a compound annual growth rate (CAGR) of 6.4% from 2022 through 2027.
North American wind turbines market is estimated to increase from $21.6 billion in 2022 to reach $27.9 billion by 2027, at a CAGR of 5.2% from 2022 through 2027.
Asia-Pacific wind turbines market is estimated to increase from $44.8 billion in 2022 to reach $62.9 billion by 2027, at a CAGR of 7.0% from 2022 through 2027.
Report Scope:
This report analyzes different turbine types, installations type, grid connectivity, end use, capacity rating, end user, and regional market development of wind turbines. Furthermore, we also segment the market analysis by major countries in this report, such as the U.S., China, Germany, and others where the opportunities for wind turbines are lucrative.
The report is prepared in a simple, easy-to-understand format; tables and figures are included to illustrate historical, current, and future market scenarios. The report also covers leading companies with information on product types, business footprint, revenue, etc. We have also included a list of other companies in global and regional markets. Also, the report includes a patent analysis for the wind turbines market, which represents a significant investment area for investors.
The report incorporates the impact of COVID-19 and the Russia-Ukraine war on the global and regional markets.
In this report 2021 is used as the market's base year, estimated values are provided for 2022 and market values are forecast for the period of 2022 to 2027. All market values are provided in millions of dollars, and market shares and CAGRs are provided in percentages.
Report Includes:
- 35 data tables and 46 additional tables
- An overview of the global market for wind turbines
- Analyses of global market trends, with data from 2021 and 2022, estimates for 2023, 2025, and projections of compound annual growth rates (CAGRs) through 2027
- Coverage of history, evolution, applications, and benefits of wind turbine and discussion on market opportunities, major issues and trends affecting the industry
- Segmentation of the market by turbine type, installation, grid connectivity, service, end use, capacity rating, and region
- Insight into the recent industry structure, regulations and policies, pipeline products, and the vendor landscape of the market leading participants
- Company profiles of the leading global players, including Vestas Wind Systems A/S, Siemens Gamesa, General Electric, Ming Yang Smart Energy Group Co. Ltd., Envision Group, and Nordex SE
Table of Contents
Chapter 1 Introduction
- 1.1 Introduction
- 1.2 Study Goals and Objectives
- 1.3 Reasons for Doing This Study
- 1.4 Scope of Report
- 1.5 What's New in This Update?
- 1.6 Information Sources
- 1.7 Intended Audience
- 1.8 Research Methodology
- 1.9 Geographical Breakdown
- 1.10 Analyst's Credentials
- 1.11 BCC Custom Research
- 1.12 Related BCC Research Reports
Chapter 2 Summary and Highlights
Chapter 3 Market Overview
- 3.1 Current Market Overview
- 3.1.1 Characterizing Wind Resources
- 3.1.2 Economic Prospects of Wind Energy
- 3.1.3 The Cost of Wind Power is Competitive with Conventional Power Plants
- 3.2 History and Evolution of Wind Turbines
- 3.2.1 Wind Energy History
- 3.2.2 Wind Energy Present
- 3.2.3 Wind Energy Future
- 3.3 Developments in the Wind Turbine Industry
- 3.3.1 Catenary Moored Semi-Submersible Platforms (CMSSP) Platform
- 3.3.2 Tension Leg Platforms (TLP) Platform
- 3.3.3 Spar Buoys
- 3.3.4 Pitch Bearings
- 3.3.5 Rotor Size and Blade Shape
- 3.3.6 Robotic Inspection
- 3.4 Trends
- 3.4.1 Increased Interest in the Renewable Sources of Energy
- 3.4.2 Heightened Concern about Carbon Emissions
- 3.4.3 Selling Excess Electricity to the Utilities
- 3.4.4 Early Stage of Industry
- 3.5 Wind Turbine Advances
- 3.6 Wind Turbine Components
- 3.6.1 Subcomponents for Wind Turbines
- 3.7 Government Regulations and Incentives: Technological Issues in the Wind Industry
- 3.7.1 Incentives for Wind Energy
- 3.7.2 Permits and Legal Aspects
- 3.7.3 Ecological Impact of Wind Turbines
- 3.7.4 Production Tax Credit
- 3.7.5 Government Incentives for the Construction of New Renewable Sources of Energy
- 3.7.6 Wind Turbine and Component Technology Issues
- 3.8 Basis of Wind Energy Projects
- 3.8.1 Wind Energy Project Costs
- 3.8.2 Cost of Producing Wind Energy
- 3.9 Steps for Development of Wind Projects
- 3.10 Certification and Testing of Wind Turbines
- 3.10.1 Design Assessment
- 3.10.2 Type Testing
- 3.10.3 Manufacturing Evaluation
- 3.10.4 Performance Characteristics
- 3.10.5 International Standards
- 3.11 Applications, Advantages, and Challenges
- 3.11.1 Applications
- 3.11.2 Advantages of Wind Energy
- 3.11.3 Disadvantages of Wind Energy
- 3.11.4 Challenges
- 3.12 Improving Turbine Efficiencies
- 3.12.1 Improved Turbine Efficiencies Through Design Innovations
- 3.12.2 Improved Turbine Efficiencies Using Carbon Fiber
- 3.13 Types of Wind Turbines
- 3.13.1 Horizontal-Axis Wind Turbine
- 3.13.2 Vertical-Axis Wind Turbine
- 3.14 Wind Turbine Application Types
- 3.14.1 Off-Grid
- 3.14.2 On-Grid
- 3.15 Value Chain Analysis of the Market for Wind Turbines
- 3.15.1 Raw and Processed Materials
- 3.15.2 Subcomponents
- 3.15.3 Components
- 3.15.4 Logistics and Transportation
- 3.15.5 End Product
- 3.15.6 End-Use Industries
- 3.16 Porter's Five Forces Model
- 3.16.1 Supplier Power
- 3.16.2 Buyer Power
- 3.16.3 Threat of New Entrants
- 3.16.4 Threat of Substitutes
- 3.16.5 Competitive Rivalry
- 3.17 PESTLE Analysis
- 3.17.1 Political
- 3.17.2 Economic
- 3.17.3 Sociological
- 3.17.4 Technological
- 3.17.5 Legal
- 3.17.6 Environment
- 3.18 Impact of COVID-19 on the Global Market for Wind Turbines
- 3.19 Impact of the Russia-Ukraine War on the Global Market for Wind Turbines
Chapter 4 Global Market Dynamics
- 4.1 Overview
- 4.2 Market Dynamics
- 4.2.1 Global Market Drivers
- 4.2.2 Global Market Restraints
- 4.2.3 Current Market Trends
- 4.2.4 Market Opportunities
Chapter 5 Market Breakdown by Turbine Type
- 5.1 Overview
- 5.2 Global Market by Turbine Type
- 5.2.1 Horizontal-Axis Turbines
- 5.2.2 Vertical-Axis Turbines
- 5.3 North American Market by Turbine Type
- 5.4 European Market by Turbine Type
- 5.5 Asia-Pacific Market by Turbine Type
- 5.6 Rest of the World Market by Turbine Type
Chapter 6 Market Breakdown by Type of Installation
- 6.1 Overview
- 6.2 Global Market by Type of Installation
- 6.2.1 Onshore
- 6.2.2 Offshore
- 6.3 North American Market by Type of Installation
- 6.4 European Market by Type of Installation
- 6.5 Asia-Pacific Market by Type of Installation
- 6.6 Rest of the World Market by Type of Installation
Chapter 7 Market Breakdown by Grid Connectivity
- 7.1 Global Market by Grid Connectivity
- 7.1.1 On-grid
- 7.1.2 Off-grid
- 7.2 North American Market by Grid Connectivity
- 7.3 European Market by Grid Connectivity
- 7.4 Asia-Pacific Market by Grid Connectivity
- 7.5 Rest of the World Market by Grid Connectivity
Chapter 8 Market Breakdown by End User
- 8.1 Overview
- 8.2 Global Market by End User
- 8.2.1 Independent Power Producers
- 8.2.2 Investor-Owned Utilities
- 8.2.3 Public Power Utilities
- 8.2.4 Rural Electric Cooperatives
- 8.3 North American Market by End User
- 8.4 European Market by End User
- 8.5 Asia-Pacific Market by End User
- 8.6 Rest of the World Market by End User
Chapter 9 Market Breakdown by Capacity Rating
- 9.1 Overview
- 9.2 Global Market by Capacity Rating
- 9.2.1 Below 2 MW
- 9.2.2 2 MW to 4 MW
- 9.2.3 Above 4 MW
- 9.3 North American Market by Capacity Rating
- 9.4 European Market by Capacity Rating
- 9.5 Asia-Pacific by Capacity Rating
- 9.6 Rest of the World Market by Capacity Rating
Chapter 10 Market Breakdown by End-Use Sector
- 10.1 Overview
- 10.2 Global Market by End-Use Sector
- 10.2.1 Residential
- 10.2.2 Industrial
- 10.2.3 Commercial
- 10.2.4 Utility
- 10.3 North American Market by End-Use Sector
- 10.4 European Market by End-Use Sector
- 10.5 Asia-Pacific by End-Use Sector
- 10.6 Rest of the World Market by End-Use Sector
Chapter 11 Market Breakdown by Region
- 11.1 Overview
- 11.2 Global Market for Wind Turbines by Region
- 11.3 North American Market for Wind Turbines by Country
- 11.3.1 U.S.
- 11.3.2 Canada
- 11.3.3 Mexico
- 11.4 European Market for Wind Turbines by Country
- 11.4.1 Germany
- 11.4.2 Turkey
- 11.4.3 France
- 11.4.4 Denmark
- 11.4.5 U.K.
- 11.4.6 The Netherlands
- 11.4.7 Sweden
- 11.4.8 Rest of Europe
- 11.5 Asia-Pacific Market for Wind Turbines by Country
- 11.5.1 China
- 11.5.2 India
- 11.5.3 Japan
- 11.5.4 Australia
- 11.5.5 Vietnam
- 11.5.6 Rest of Asia-Pacific
- 11.6 Rest of the World Market for Wind Turbines by Subregion
- 11.6.1 South America
- 11.6.2 Middle East and Africa
Chapter 12 Patent Analysis
- 12.1 Overview
- 12.2 Descriptions of Patent Related to Wind Turbines
Chapter 13 Competitive Landscape
- 13.1 Overview
- 13.2 Strategic Analysis
- 13.2.1 Agreements/Contracts
- 13.2.2 13.2.1 Product Launches
- 13.2.3 Collaborations
- 13.2.4 Acquisitions
- 13.3 Leading Players in the Global Market for Wind Turbines
- 13.4 Market Share Analysis
- 13.5 Wind Turbine Industry Structure
- 13.5.1 Manufacturers
- 13.5.2 Developers
- 13.5.3 Owners
- 13.5.4 Power Purchasers
- 13.6 Product Portfolio Analysis
- 13.6.1 Product Mapping Analysis by Turbine Size Capacity
- 13.6.2 Product Mapping Analysis by Installation Site
- 13.7 Key Developments
- 13.8 Information Resources in the Market for Wind Turbines
Chapter 14 Company Profiles
- CRRC CORP. LTD.
- ENERCON GMBH
- ENVISION ENERGY USA LTD.
- GENERAL ELECTRIC
- GUODIAN UNITED POWER TECHNOLOGY CO. LTD.
- HYOSUNG HEAVY INDUSTRIES
- MINGYANG SMART ENERGY GROUP CO. LTD.
- NORDEX SE
- SANY RENEWABLE ENERGY CO. LTD.
- SEAWIND OCEAN TECHNOLOGY HOLDING B.V.
- SHANGHAI ELECTRIC GROUP CO. LTD.
- SIEMENS GAMESA RENEWABLE ENERGY
- SINOVEL WIND GROUP CO. LTD.
- SUZLON ENERGY LTD.
- VESTAS WIND SYSTEMS A/S
- XINJIANG GOLDWIND SCIENCE & TECHNOLOGY CO. LTD.
- ZHEJIANG WINDEY CO. LTD.