|
|
市場調査レポート
商品コード
1420116
シミュレーション・分析の世界市場(2024年版):コンポーネント別、展開別、最終用途別、地域別、国別の分析、市場考察、予測(2024年~2029年)Global Simulation and Analysis Market (2024 Edition): Analysis By Component (Software, Service) Deployment (On-Premise, Cloud), By End-use, By Region, By Country: Market Insights and Forecast (2024-2029) |
||||||
|
|||||||
|
|||||||

| シミュレーション・分析の世界市場(2024年版):コンポーネント別、展開別、最終用途別、地域別、国別の分析、市場考察、予測(2024年~2029年) |
|
出版日: 2024年02月01日
発行: Azoth Analytics
ページ情報: 英文 250 Pages
納期: 即納可能
|

全表示
- 概要
- 図表
- 目次
世界のシミュレーション・分析の市場規模は、予測期間の2024年~2029年にCAGRで8.6%の拡大が予測されます。世界のシミュレーション・分析市場は、主要企業によるシミュレーションツールの大幅な採用により、驚異的な速度で成長する見込みです。市場規模は2024年の102億6,000万米ドルから2029年に155億米ドルに達する見込みです。シミュレーションツールの重要性は、スマートマニュファクチャリングとネットワーク化を特徴とする第4次産業革命の到来とともに高まっています。大きな市場金額を持つ世界のシミュレーション・分析市場は、ダイナミックな成長中のビジネスです。航空宇宙、自動車、製造、医療など、幅広い産業を対象としています。プロセスの最適化、製品開発、業務効率化などのさまざまな部門におけるシミュレーションソフトウェアの利用の拡大が、市場金額を押し上げる主な要因となっています。
仮想テスト/トレーニングソリューションに対する需要の増加、技術改良、多くの産業におけるシミュレーションの統合が、世界のシミュレーション・分析市場の大幅な成長を促進しています。シミュレーション・分析ソリューションは、航空宇宙、自動車、医療、製造、防衛などのさまざまな産業で、テスト、製品開発、トレーニング、経営最適化などにますます利用されるようになっています。
シミュレーションソフトウェアの進歩
急速な技術開発により、性能と機能を向上させた複雑で機能的なシミュレーターが登場しています。こうした開発により、さまざまな産業の企業がより詳細でリアルなシミュレーションを実行できるようになり、複雑な実世界の状況をより正確にシミュレートできるようになりました。シミュレーションソフトの開発により、仮想モデルの精度が向上し、シミュレーションを活用できる産業や用途が広がっています。
さらに、シミュレーションソフトウェアが高度化するにつれて、製造、製品開発などの重要な活動の生産性と効率が向上しています。予測モデリング、最適化、シナリオ分析は、最新のシミュレーションプログラムに含まれる強力なアルゴリズムやAI、機械学習によって可能になります。意思決定の改善、経費削減、プロセスの合理化を目指す企業にとって、シミュレーションソフトウェアの開発は有力な選択肢となります。目標達成におけるこうした先進の手法の重要性を理解する部門が増えるにつれ、シミュレーション・分析市場は、組織がよりよい意思決定を行い、イノベーションを生み出し、より深い知見を得ることを可能にするこうしたツールの結果として成長すると予測されます。
複雑性と統合の問題
シミュレーション・分析ツールに関連する複雑性と統合に関する懸念が、世界市場の拡大に対する大きな障壁となっています。これらの革新的なツールの複雑な性質は、効率的な実装と使用に特定の知識を必要とすることが多く、主要課題の1つとなっています。シミュレーションソフトウェアを現在のワークフローやシステムに統合することは困難であり、古いシステムでは問題が生じる可能性があります。企業は、多様なシミュレーションツールやシステム間のシームレスな相互作用を確保する上で課題に直面する可能性があり、これらの技術の総体的な有効性と利便性の妨げになります。よりよい意思決定と効率化にシミュレーションの利点を活用したいと考える産業では、ユーザーフレンドリーなインターフェースとシームレスな統合が不可欠となっています。シミュレーション・分析ソリューションが広く採用され、企業がさまざまな部門でこれらのツールから得られる知見や最適化の恩恵を十分に享受するためには、こうした複雑性や統合の問題を解決する必要があります。
当レポートでは、世界のシミュレーション・分析市場について調査し、市場規模と予測、地域とセグメントの分析、主要動向と機会などの情報を提供しています。
目次
第1章 市場の背景
- 範囲と製品の見通し
- エグゼクティブサマリー
- 調査手法
第2章 戦略的推奨事項
第3章 世界のシミュレーション・分析市場:実績と予測(2019年~2029年)
- シミュレーション・分析市場に対するマクロ経済要因の影響の分析
- 世界のシミュレーション・分析市場:各カテゴリの世界のIT支出
- 世界のシミュレーション・分析市場:原則、競合力学
- 世界のシミュレーション・分析市場:ソフトウェア製品の売上と粗利益
- 世界のシミュレーション・分析市場:ダッシュボード
- 世界のシミュレーション・分析市場:市場金額の評価(2019年~2029年)
- シミュレーション・分析市場に対するCOVID-19の影響
- 世界のシミュレーション・分析市場セグメンテーション:コンポーネント別
- 世界のシミュレーション・分析市場:コンポーネント別、概要
- 世界のシミュレーション・分析の市場規模:ソフトウェア(金額)(2019年~2029年)
- 世界のシミュレーション・分析の市場規模:サービス(金額)(2019年~2029年)
- 世界のシミュレーション・分析市場セグメンテーション:展開別
- 世界のシミュレーション・分析市場:展開別、概要
- 世界のシミュレーション・分析の市場規模:オンプレミス(金額)(2019年~2029年)
- 世界のシミュレーション・分析の市場規模:クラウド(金額)(2019年~2029年)
- 世界のシミュレーション・分析市場セグメンテーション:最終用途別
- 世界のシミュレーション・分析市場:最終用途別、概要
- 世界のシミュレーション・分析の市場規模:自動車(金額)(2019年~2029年)
- 世界のシミュレーション・分析の市場規模:航空宇宙・防衛(金額)(2019年~2029年)
- 世界のシミュレーション・分析の市場規模:工業製造(金額)(2019年~2029年)
- 世界のシミュレーション・分析の市場規模:医療(金額)(2019年~2029年)
- 世界のシミュレーション・分析の市場規模:その他(金額)(2019年~2029年)
第4章 世界のシミュレーション・分析市場:地域の分析
- 研究の地域範囲
- 地域のスナップショット
第5章 南北アメリカのシミュレーション・分析市場:実績と予測(2019年~2029年)
- 南北アメリカのシミュレーション・分析市場:スナップショット
- 南北アメリカのシミュレーション・分析市場:市場金額の評価(2019年~2029年)
- 南北アメリカのシミュレーション・分析市場:主な要因
- 南北アメリカのシミュレーション・分析市場:セグメント分析
- 南北アメリカのシミュレーション・分析市場セグメンテーション:コンポーネント別
- 南北アメリカのシミュレーション・分析市場セグメンテーション:展開別
- 南北アメリカのシミュレーション・分析市場セグメンテーション:最終用途別
- 南北アメリカのシミュレーション・分析市場セグメンテーション:国別
- 南北アメリカのシミュレーション・分析市場:国別、概要
- 米国のシミュレーション・分析市場:市場規模とCAGR(2019年~2029年)
- カナダのシミュレーション・分析市場:市場規模とCAGR(2019年~2029年)
- ブラジルのシミュレーション・分析市場:市場規模とCAGR(2019年~2029年)
- その他の南北アメリカのシミュレーション・分析市場:市場規模とCAGR(2019年~2029年)
第6章 欧州のシミュレーション・分析市場:実績と予測(2019年~2029年)
- 欧州のシミュレーション・分析市場:スナップショット
- 欧州のシミュレーション・分析市場:市場金額の評価(2019年~2029年)
- 欧州のシミュレーション・分析市場:主な要因
- 欧州のシミュレーション・分析市場:セグメント分析
- 欧州のシミュレーション・分析市場セグメンテーション:コンポーネント別
- 欧州のシミュレーション・分析市場セグメンテーション:展開別
- 欧州のシミュレーション・分析市場セグメンテーション:最終用途別
- 欧州のシミュレーション・分析市場セグメンテーション:国別
- 欧州のシミュレーション・分析市場:国別、概要
- ドイツのシミュレーション・分析市場:市場規模とCAGR(2019年~2029年)
- 英国のシミュレーション・分析市場:市場規模とCAGR(2019年~2029年)
- フランスのシミュレーション・分析市場:市場規模とCAGR(2019年~2029年)
- その他の欧州のシミュレーション・分析市場:市場規模とCAGR(2019年~2029年)
第7章 アジア太平洋のシミュレーション・分析市場:実績と予測(2019年~2029年)
- アジア太平洋のシミュレーション・分析市場:スナップショット
- アジア太平洋のシミュレーション・分析市場:市場金額の評価(2019年~2029年)
- アジア太平洋のシミュレーション・分析市場:主な要因
- アジア太平洋のシミュレーション・分析市場:セグメント分析
- アジア太平洋のシミュレーション・分析市場セグメンテーション:コンポーネント別
- アジア太平洋のシミュレーション・分析市場セグメンテーション:展開別
- アジア太平洋のシミュレーション・分析市場セグメンテーション:最終用途別
- アジア太平洋のシミュレーション・分析市場セグメンテーション:国別
- アジア太平洋のシミュレーション・分析市場:国別、概要
- 中国のシミュレーション・分析市場:市場規模とCAGR(2019年~2029年)
- 日本のシミュレーション・分析市場:市場規模とCAGR(2019年~2029年)
- 韓国のシミュレーション・分析市場:市場規模とCAGR(2019年~2029年)
- インドのシミュレーション・分析市場:市場規模とCAGR(2019年~2029年)
- その他のアジア太平洋のシミュレーション・分析市場:市場規模とCAGR(2019年~2029年)
第8章 中東・アフリカのシミュレーション・分析市場:実績と予測(2019年~2029年)
- 中東・アフリカのシミュレーション・分析市場:スナップショット
- 中東・アフリカのシミュレーション・分析市場:市場金額の評価(2019年~2029年)
- 中東・アフリカのシミュレーション・分析市場:主な要因
- 中東・アフリカのシミュレーション・分析市場:セグメント分析
- 中東・アフリカのシミュレーション・分析市場セグメンテーション:コンポーネント別
- 中東・アフリカのシミュレーション・分析市場セグメンテーション:展開別
- 中東・アフリカのシミュレーション・分析市場セグメンテーション:最終用途別
第9章 市場力学
- 世界のシミュレーション・分析市場に対する市場力学の影響の評価
- 促進要因
- 抑制要因
- 動向
第10章 産業エコシステム分析
- バリューチェーン分析
- ポーターのファイブフォース分析モデル
第11章 競合ポジショニング
- 企業の製品ポジショニング
- 市場ポジションマトリクス
- シミュレーション・分析市場の市場シェア分析
- 企業プロファイル
- Altair Engineering Inc.
- Ansys, Inc.
- Autodesk, Inc.
- Dassault Systemes
- Certara, Inc.
- Hexagon AB
- Keysight Technologies
- Simulations Plus, Inc.
- Gamma Technologies
- Siemens Digital Industries Software
List of Figures
List of Figures
- Figure 1: Worldwide IT Spending By Category
- Figure 2: Worldwide IT Spending Growth Y/Y 2023/2024
- Figure 3: Software Product Sales of Altair Engineering Inc. and R&D Spend Growth
- Figure 4: Software Product vs Software Related Services vs Client Engineering Services Gross Margin
- Figure 5: Global Simulation and Analysis Market Size, By Value, 2019-2022 (USD Billion)
- Figure 6: Global Simulation and Analysis Market Size, By Value, 2023-2029 (USD Billion)
- Figure 7: Global Simulation and Analysis Market CAGR (%), By Value, 2019-2022, 2024-2029
- Figure 8: Global Simulation and Analysis Market Size, By Software, By Value, 2019H-2029F (USD Billion & CAGR)
- Figure 9: Global Simulation and Analysis Market Absolute Opportunity, By Software, 2019-2029 (USD Billion)
- Figure 10: Global Simulation and Analysis Market Size, By Service, By Value, 2019H-2029F (USD Billion & CAGR)
- Figure 11: Global Simulation and Analysis Market Absolute Opportunity, By Service, 2019-2029 (USD Billion)
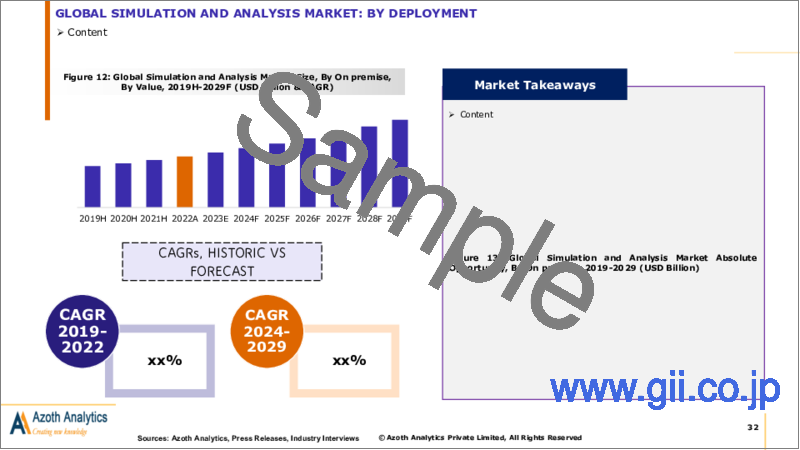
- Figure 12: Global Simulation and Analysis Market Size, By On-premise, By Value, 2019H-2029F (USD Billion & CAGR)
- Figure 13: Global Simulation and Analysis Market Absolute Opportunity, By On-premise, 2019-2029 (USD Billion)
- Figure 14: Global Simulation and Analysis Market Size, By Cloud, By Value, 2019H-2029F (USD Billion & CAGR)
- Figure 15: Global Simulation and Analysis Market Absolute Opportunity, By Cloud, 2019-2029 (USD Billion)
- Figure 16: Global Simulation and Analysis Market Size, By Automotive, By Value, 2019H-2029F (USD Billion & CAGR)
- Figure 17: Global Simulation and Analysis Market Absolute Opportunity, By Automotive, 2019-2029 (USD Billion)
- Figure 18: Global Simulation and Analysis Market Size, By Aerospace & Defense, By Value, 2019H-2029F (USD Billion & CAGR)
- Figure 19: Global Simulation and Analysis Market Absolute Opportunity, By Aerospace & Defense, 2019-2029 (USD Billion)
- Figure 20: Global Simulation and Analysis Market Size, By Industrial Manufacturing, By Value, 2019H-2029F (USD Billion & CAGR)
- Figure 21: Global Simulation and Analysis Market Absolute Opportunity, By Industrial Manufacturing, 2019-2029 (USD Billion)
- Figure 22: Global Simulation and Analysis Market Size, By Healthcare, By Value, 2019H-2029F (USD Billion & CAGR)
- Figure 23: Global Simulation and Analysis Market Absolute Opportunity, By Healthcare, 2019-2029 (USD Billion)
- Figure 24: Global Simulation and Analysis Market Size, By Others, By Value, 2019H-2029F (USD Billion & CAGR)
- Figure 25: Global Simulation and Analysis Market Absolute Opportunity, By Others, 2019-2029 (USD Billion)
- Figure 26: Americas Simulation and Analysis Market Size, By Value, 2019H-2029F (USD Billion)
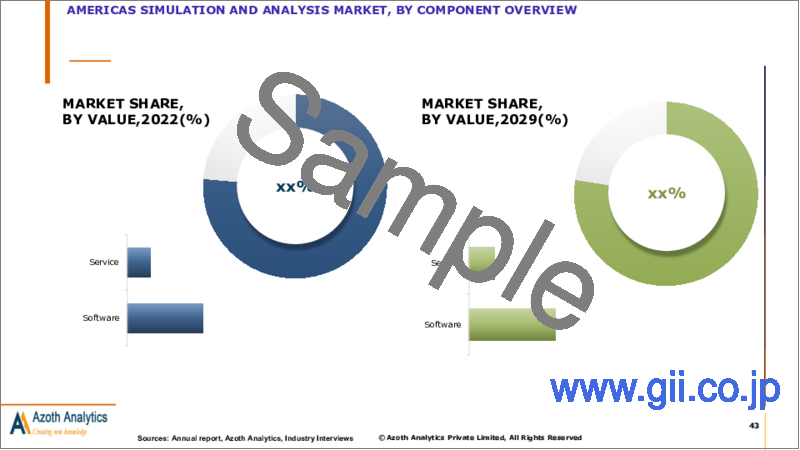
- Figure 27: Americas Simulation and Analysis Market Share, By Deployment, 2022 (%)
- Figure 28: Americas Simulation and Analysis Market, By Software, By Value, 2019H-2029F (USD Billion & CAGR)
- Figure 29: Americas Simulation and Analysis Market, By Service, By Value, 2019H-2029F (USD Billion & CAGR)
- Figure 30: Americas Simulation and Analysis Market, By On premise, By Value, 2019H-2029F (USD Billion & CAGR)
- Figure 31: Americas Simulation and Analysis Market, By Cloud, By Value, 2019H-2029F (USD Billion & CAGR)
- Figure 32: Americas Simulation and Analysis Market, By Automotive, By Value, 2019H-2029F (USD Billion & CAGR)
- Figure 33: Americas Simulation and Analysis Market, By Aerospace & Defense, By Value, 2019H-2029F (USD Billion & CAGR)
- Figure 34: Americas Simulation and Analysis Market, By Industrial Manufacturing, By Value, 2019H-2029F (USD Billion & CAGR)
- Figure 35: Americas Simulation and Analysis Market, By Healthcare, By Value, 2019H-2029F (USD Billion & CAGR)
- Figure 36: Americas Simulation and Analysis Market, By Others, By Value, 2019H-2029F (USD Billion & CAGR)
- Figure 37: United States Simulation and Analysis Market, By Value, 2019-2029 (USD Billion & CAGR)
- Figure 38: United States Simulation and Analysis Market Value, By Deployment, 2022 (USD Billion)
- Figure 39: United States Simulation and Analysis Market Share, By Component, By Value, 2022 (%)
- Figure 40: United States Simulation and Analysis Market Share, By Deployment, 2022 (%)
- Figure 41: United States Simulation and Analysis Market Share, By End-use, By Value, 2022 (%)
- Figure 42: Canada Simulation and Analysis Market, By Value, 2019-2029 (USD Billion & CAGR)
- Figure 43: Canada Simulation and Analysis Market Value, By Deployment, 2022 (USD Billion)
- Figure 44: Canada Simulation and Analysis Market Share, By Component, By Value, 2022 (%)
- Figure 45: Canada Simulation and Analysis Market Share, By Deployment, 2022 (%)
- Figure 46: Canada Simulation and Analysis Market Share, By End-use, By Value, 2022 (%)
- Figure 47: Brazil Simulation and Analysis Market, By Value, 2019-2029 (USD Billion & CAGR)
- Figure 48: Brazil Simulation and Analysis Market Value, By Deployment, 2022 (USD Billion)
- Figure 49: Brazil Simulation and Analysis Market Share, By Component, By Value, 2022 (%)
- Figure 50: Brazil Simulation and Analysis Market Share, By Deployment, 2022 (%)
- Figure 51: Brazil Simulation and Analysis Market Share, By End-use, By Value, 2022 (%)
- Figure 52: Rest of Americas Simulation and Analysis Market, By Value, 2019-2029 (USD Billion & CAGR)
- Figure 53: Rest of Americas Simulation and Analysis Market Value, By Deployment, 2022 (USD Billion)
- Figure 54: Rest of Americas Simulation and Analysis Market Share, By Component, By Value, 2022 (%)
- Figure 55: Rest of Americas Simulation and Analysis Market Share, By Deployment, 2022 (%)
- Figure 56: Rest of Americas Simulation and Analysis Market Share, By End-use, 2022 (%)
- Figure 57: Europe Simulation and Analysis Market Size, By Value, 2019H-2029F (USD Billion)
- Figure 58: Europe Simulation and Analysis Market Share, By Deployment, 2022 (%)
- Figure 59: Europe Simulation and Analysis Market, By Software, By Value, 2019H-2029F (USD Billion & CAGR)
- Figure 60: Europe Simulation and Analysis Market, By Service, By Value, 2019H-2029F (USD Billion & CAGR)
- Figure 61: Europe Simulation and Analysis Market, By On premise, By Value, 2019H-2029F (USD Billion & CAGR)
- Figure 62: Europe Simulation and Analysis Market, By Cloud, By Value, 2019H-2029F (USD Billion & CAGR)
- Figure 63: Europe Simulation and Analysis Market, By Automotive, By Value, 2019H-2029F (USD Billion & CAGR)
- Figure 64: Europe Simulation and Analysis Market, By Aerospace & Defense, By Value, 2019H-2029F (USD Billion & CAGR)
- Figure 65: Europe Simulation and Analysis Market, By Industrial Manufacturing, By Value, 2019H-2029F (USD Billion & CAGR)
- Figure 66: Europe Simulation and Analysis Market, By Healthcare, By Value, 2019H-2029F (USD Billion & CAGR)
- Figure 67: Europe Simulation and Analysis Market, By Others, By Value, 2019H-2029F (USD Billion & CAGR)
- Figure 68: Germany Simulation and Analysis Market, By Value, 2019-2029 (USD Billion & CAGR)
- Figure 69: Germany Simulation and Analysis Market Value, By Deployment, 2022 (USD Billion)
- Figure 70: Germany Simulation and Analysis Market Share, By Component, By Value, 2022 (%)
- Figure 71: Germany Simulation and Analysis Market Share, By Deployment, 2022 (%)
- Figure 72: Germany Simulation and Analysis Market Share, By End-use, By Value, 2022 (%)
- Figure 73: United Kingdom Simulation and Analysis Market, By Value, 2019-2029 (USD Billion & CAGR)
- Figure 74: United Kingdom Simulation and Analysis Market Value, By Deployment, 2022 (USD Billion)
- Figure 75: United Kingdom Simulation and Analysis Market Share, By Component, By Value, 2022 (%)
- Figure 76: United Kingdom Simulation and Analysis Market Share, By Deployment, 2022 (%)
- Figure 77: United Kingdom Simulation and Analysis Market Share, By End-use, By Value, 2022 (%)
- Figure 78: France Simulation and Analysis Market, By Value, 2019-2029 (USD Billion & CAGR)
- Figure 79: France Simulation and Analysis Market Value, By Deployment, 2022 (USD Billion)
- Figure 80: France Simulation and Analysis Market Share, By Component, By Value, 2022 (%)
- Figure 81: France Simulation and Analysis Market Share, By Deployment, 2022 (%)
- Figure 82: France Simulation and Analysis Market Share, By End-use, By Value, 2022 (%)
- Figure 83: Rest of Europe Simulation and Analysis Market, By Value, 2019-2029 (USD Billion & CAGR)
- Figure 84: Rest of Europe Simulation and Analysis Market Value, By Deployment, 2022 (USD Billion)
- Figure 85: Rest of Europe Simulation and Analysis Market Share, By Component, By Value, 2022 (%)
- Figure 86: Rest of Europe Simulation and Analysis Market Share, By Deployment, 2022 (%)
- Figure 87: Rest of Europe Simulation and Analysis Market Share, By End-use, By Value, 2022 (%)
- Figure 88: Asia Pacific Simulation and Analysis Market Size, By Value, 2019H-2029F (USD Billion)
- Figure 89: Asia Pacific Simulation and Analysis Market Share, By Deployment, 2022 (%)
- Figure 90: Asia Pacific Simulation and Analysis Market, By Software, By Value, 2019H-2029F (USD Billion & CAGR)
- Figure 91: Asia Pacific Simulation and Analysis Market, By Service, By Value, 2019H-2029F (USD Billion & CAGR)
- Figure 92: Asia Pacific Simulation and Analysis Market, By On premise, By Value, 2019H-2029F (USD Billion & CAGR)
- Figure 93: Asia Pacific Simulation and Analysis Market, By Cloud, By Value, 2019H-2029F (USD Billion & CAGR)
- Figure 94: Asia Pacific Simulation and Analysis Market, By Automotive, By Value, 2019H-2029F (USD Billion & CAGR)
- Figure 95: Asia Pacific Simulation and Analysis Market, By Aerospace & Defense, By Value, 2019H-2029F (USD Billion & CAGR)
- Figure 96: Asia Pacific Simulation and Analysis Market, By Industrial Manufacturing, By Value, 2019H-2029F (USD Billion & CAGR)
- Figure 97: Asia Pacific Simulation and Analysis Market, By Healthcare, By Value, 2019H-2029F (USD Billion & CAGR)
- Figure 98: Asia Pacific Simulation and Analysis Market, By Others, By Value, 2019H-2029F (USD Billion & CAGR)
- Figure 99: China Simulation and Analysis Market, By Value, 2019-2029 (USD Billion & CAGR)
- Figure 100: China Simulation and Analysis Market Value, By Deployment, 2022 (USD Billion)
- Figure 101: China Simulation and Analysis Market Share, By Component, By Value, 2022 (%)
- Figure 102: China Simulation and Analysis Market Share, By Deployment, 2022 (%)
- Figure 103: China Simulation and Analysis Market Share, By End-use, By Value, 2022 (%)
- Figure 104: Japan Simulation and Analysis Market, By Value, 2019-2029 (USD Billion & CAGR)
- Figure 105: Japan Simulation and Analysis Market Value, By Deployment, 2022 (USD Billion)
- Figure 106: Japan Simulation and Analysis Market Share, By Component, By Value, 2022 (%)
- Figure 107: Japan Simulation and Analysis Market Share, By Deployment, 2022 (%)
- Figure 108: Japan Simulation and Analysis Market Share, By End-use, By Value, 2022 (%)
- Figure 109: South Korea Simulation and Analysis Market, By Value, 2019-2029 (USD Billion & CAGR)
- Figure 110: South Korea Simulation and Analysis Market Value, By Deployment, 2022 (USD Billion)
- Figure 111: South Korea Simulation and Analysis Market Share, By Component, By Value, 2022 (%)
- Figure 112: South Korea Simulation and Analysis Market Share, By Deployment, 2022 (%)
- Figure 113: South Korea Simulation and Analysis Market Share, By End-use, By Value, 2022 (%)
- Figure 114: India Simulation and Analysis Market, By Value, 2019-2029 (USD Billion & CAGR)
- Figure 115: India Simulation and Analysis Market Value, By Deployment, 2022 (USD Billion)
- Figure 116: India Simulation and Analysis Market Share, By Component, By Value, 2022 (%)
- Figure 117: India Simulation and Analysis Market Share, By Deployment, 2022 (%)
- Figure 118: India Simulation and Analysis Market Share, By End-use, By Value, 2022 (%)
- Figure 119: Rest of Asia Pacific Simulation and Analysis Market, By Value, 2019-2029 (USD Billion & CAGR)
- Figure 120: Rest of Asia Pacific Simulation and Analysis Market Value, By Deployment, 2022 (USD Billion)
- Figure 121: Rest of Asia Pacific Simulation and Analysis Market Share, By Component, By Value, 2022 (%)
- Figure 122: Rest of Asia Pacific Simulation and Analysis Market Share, By Deployment, 2022 (%)
- Figure 123: Rest of Asia Pacific Simulation and Analysis Market Share, By End-use, By Value, 2022 (%)
- Figure 124: Middle east & Africa Simulation and Analysis Market Size, By Value, 2019H-2029F (USD Billion)
- Figure 125: Middle east & Africa Simulation and Analysis Market Share, By Deployment, 2022 (%)
- Figure 126: Middle east & Africa Simulation and Analysis Market, By Software, By Value, 2019H-2029F (USD Billion & CAGR)
- Figure 127: Middle east & Africa Simulation and Analysis Market, By Service, By Value, 2019H-2029F (USD Billion & CAGR)
- Figure 128: Middle east & Africa Simulation and Analysis Market, By On premise, By Value, 2019H-2029F (USD Billion & CAGR)
- Figure 129: Middle East & Africa Simulation and Analysis Market, By Cloud, By Value, 2019H-2029F (USD Billion & CAGR)
- Figure 130: Middle East & Africa Simulation and Analysis Market, By Automotive, By Value, 2019H-2029F (USD Billion & CAGR)
- Figure 131: Middle East & Africa Simulation and Analysis Market, By Aerospace & Defense, By Value, 2019H-2029F (USD Billion & CAGR)
- Figure 132: Middle East & Africa Simulation and Analysis Market, By Industrial Manufacturing, By Value, 2019H-2029F (USD Billion & CAGR)
- Figure 133: Middle East & Africa Simulation and Analysis Market, By Healthcare, By Value, 2019H-2029F (USD Billion & CAGR)
- Figure 134: Middle east & Africa Simulation and Analysis Market, By Others, By Value, 2019H-2029F (USD Billion & CAGR)
- Figure 135: Global Impact of Drivers and Restraints
- Figure 136: Market Share of Prominent Companies of Simulation and Analysis Market, 2022 (%)
- Figure 137: Altair Engineering Inc. Revenues, 2020-2022 (USD Million)
- Figure 138: Altair Engineering Inc. Revenue By Product, 2022 (%)
- Figure 139: Altair Engineering Inc., Revenue By Business Segment, 2022 (%)
- Figure 140: Altair Engineering Inc., Revenue By Geographic Segment, 2022 (%)
- Figure 141: Ansys, Inc. Revenues, 2020-2022 (USD Million)
- Figure 142: Ansys, Inc. Revenue By Business Segment, 2022 (%)
- Figure 143: Ansys, Inc., By Geographic Segment, 2022
- Figure 144: Autodesk, Inc. Revenues, 2020-2022 (USD Million)
- Figure 145: Autodesk, Inc. Revenue By Business Segment, 2022 (%)
- Figure 146: Autodesk, Inc. Revenue By Geographic Segment, 2022 (%)
- Figure 147: Dassault Systemes Revenues, 2020-2022 (USD Million)
- Figure 148: Dassault Systemes Revenue By Business Segment, 2022 (%)
- Figure 149: Dassault Systemes Revenue By Geographic Segment, 2022 (%)
- Figure 150: Dassault Systemes Revenue By Main Product, 2022 (%)
- Figure 151: Dassault Systemes Revenue By Sector, 2022 (%)
- Figure 152: Certara, Inc. Revenues, 2020-2022 (USD Million)
- Figure 153: Certara, Inc. Revenue By Business Segment, 2022 (%)
- Figure 154: Certara, Inc. Revenue By Geographic Segment, 2022 (%)
- Figure 155: Hexagon Revenues, 2020-2022 (USD Million)
- Figure 156: Hexagon Revenue By Business Segment, 2022 (%)
- Figure 157: Hexagon Revenue, By Geographic Segments, 2022 (%)
- Figure 158: Keysight Technologies Revenues, 2020-2022 (USD Million)
- Figure 159: Keysight Technologies Revenue, By Business Segments, 2022 (%)
- Figure 160: Keysight Technologies Revenue, By Geographic Segments, 2022 (%)
- Figure 161: Keysight Technologies Revenue By End Market, 2022 (%)
List of Tables
Table A1: Global Impact of Macro Economic Factors, By Region
Table A2: Key Players and their Products according to Disciplines
Table A3: United States Simulation and Analysis Market, By Component, By Value, 2019-2022 (USD Billion)
Table A4: United States Simulation and Analysis Market, By Component, By Value, 2023-2029 (USD Billion)
Table A5: United States Simulation and Analysis Market, By Deployment, By Value, 2019-2022 (USD Billion)
Table A6: United States Simulation and Analysis Market, By Deployment, By Value, 2023-2029 (USD Billion)
Table A7: United States Simulation and Analysis Market, By End-use, By Value, 2019-2022 (USD Billion)
Table A8: United States Simulation and Analysis Market, By End-use, By Value, 2023-2029 (USD Billion)
Table A9: Canada Simulation and Analysis Market, By Component, By Value, 2019-2022 (USD Billion)
Table A10: Canada Simulation and Analysis Market, By Component, By Value, 2023-2029 (USD Billion)
Table A11: Canada Simulation and Analysis Market, By Deployment, By Value, 2019-2022 (USD Billion)
Table A12: Canada Simulation and Analysis Market, By Deployment, By Value, 2023-2029 (USD Billion)
Table A13: Canada Simulation and Analysis Market, By End-use, By Value, 2019-2022 (USD Billion)
Table A14: Canada Simulation and Analysis Market, By End-use, By Value, 2023-2029 (USD Billion)
Table A15: Brazil Simulation and Analysis Market, By Component, By Value, 2019-2022 (USD Billion)
Table A16: Brazil Simulation and Analysis Market, By Component, By Value, 2023-2029 (USD Billion)
Table A17: Brazil Simulation and Analysis Market, By Deployment, By Value, 2019-2022 (USD Billion)
Table A18: Brazil Simulation and Analysis Market, By Deployment, By Value, 2023-2029 (USD Billion)
Table A19: Brazil Simulation and Analysis Market, By End-use, By Value, 2019-2022 (USD Billion)
Table A20: Brazil Simulation and Analysis Market, By End-use, By Value, 2023-2029 (USD Billion)
Table A21: Rest of Americas Simulation and Analysis Market, By Component, By Value, 2019-2022 (USD Billion)
Table A22: Rest of Americas Simulation and Analysis Market, By Component, By Value, 2023-2029 (USD Billion)
Table A23: Rest of Americas Simulation and Analysis Market, By Deployment, By Value, 2019-2022 (USD Billion)
Table A24: Rest of Americas Simulation and Analysis Market, By Deployment, By Value, 2023-2029 (USD Billion)
Table A25: Rest of Americas Simulation and Analysis Market, By End-use, By Value, 2019-2022 (USD Billion)
Table A26: Rest of Americas Simulation and Analysis Market, By End-use, By Value, 2019-2022 (USD Billion)
Table A27: Germany Simulation and Analysis Market, By Component, By Value, 2019-2022 (USD Billion)
Table A28: Germany Simulation and Analysis Market, By Component, By Value, 2023-2029 (USD Billion)
Table A29: Germany Simulation and Analysis Market, By Deployment, By Value, 2019-2022 (USD Billion)
Table A30: Germany Simulation and Analysis Market, By Deployment, By Value, 2023-2029 (USD Billion)
Table A31: Germany Simulation and Analysis Market, By End-use, By Value, 2019-2022 (USD Billion)
Table A32: Germany Simulation and Analysis Market, By End-use, By Value, 2023-2029 (USD Billion)
Table A33: United Kingdom Simulation and Analysis Market, By Component, By Value, 2019-2022 (USD Billion)
Table A34: United Kingdom Simulation and Analysis Market, By Component, By Value, 2023-2029 (USD Billion)
Table A35: United Kingdom Simulation and Analysis Market, By Deployment, By Value, 2019-2022 (USD Billion)
Table A36: United Kingdom Simulation and Analysis Market, By Deployment, By Value, 2023-2029 (USD Billion)
Table A37: United Kingdom Simulation and Analysis Market, By End-use, By Value, 2019-2022 (USD Billion)
Table A38: United Kingdom Simulation and Analysis Market, By End-use, By Value, 2023-2029 (USD Billion)
Table A39: France Simulation and Analysis Market, By Component, By Value, 2019-2022 (USD Billion)
Table A40: France Simulation and Analysis Market, By Component, By Value, 2023-2029 (USD Billion)
Table A41: France Simulation and Analysis Market, By Deployment, By Value, 2019-2022 (USD Billion)
Table A42: France Simulation and Analysis Market, By Deployment, By Value, 2023-2029 (USD Billion)
Table A43: France Simulation and Analysis Market, By End-use, By Value, 2019-2022 (USD Billion)
Table A44: France Simulation and Analysis Market, By End-use, By Value, 2023-2029 (USD Billion)
Table A45: Rest of Europe Simulation and Analysis Market, By Component, By Value, 2019-2022 (USD Billion)
Table A46: Rest of Europe Simulation and Analysis Market, By Component, By Value, 2023-2029 (USD Billion)
Table A47: Rest of Europe Simulation and Analysis Market, By Deployment, By Value, 2019-2022 (USD Billion)
Table A48: Rest of Europe Simulation and Analysis Market, By Deployment, By Value, 2023-2029 (USD Billion)
Table A49: Rest of Europe Simulation and Analysis Market, By End-use, By Value, 2019-2022 (USD Billion)
Table A50: Rest of Europe Simulation and Analysis Market, By End-use, By Value, 2023-2029 (USD Billion)
Table A51: China Simulation and Analysis Market, By Component, By Value, 2019-2022 (USD Billion)
Table A52: China Simulation and Analysis Market, By Component, By Value, 2023-2029 (USD Billion)
Table A53: China Simulation and Analysis Market, By Deployment, By Value, 2019-2022 (USD Billion)
Table A54: China Simulation and Analysis Market, By Deployment, By Value, 2023-2029 (USD Billion)
Table A55: China Simulation and Analysis Market, By End-use, By Value, 2019-2022 (USD Billion)
Table A56: China Simulation and Analysis Market, By End-use, By Value, 2023-2029 (USD Billion)
Table A57: Japan Simulation and Analysis Market, By Component, By Value, 2019-2022 (USD Billion)
Table A58: Japan Simulation and Analysis Market, By Component, By Value, 2023-2029 (USD Billion)
Table A59: Japan Simulation and Analysis Market, By Deployment, By Value, 2019-2022 (USD Billion)
Table A60: Japan Simulation and Analysis Market, By Deployment, By Value, 2023-2029 (USD Billion)
Table A61: Japan Simulation and Analysis Market, By End-use, By Value, 2019-2022 (USD Billion)
Table A62: Japan Simulation and Analysis Market, By End-use, By Value, 2023-2029 (USD Billion)
Table A63: South Korea Simulation and Analysis Market, By Component, By Value, 2019-2022 (USD Billion)
Table A64: South Korea Simulation and Analysis Market, By Component, By Value, 2023-2029 (USD Billion)
Table A65: South Korea Simulation and Analysis Market, By Deployment, By Value, 2019-2022 (USD Billion)
Table A66: South Korea Simulation and Analysis Market, By Deployment, By Value, 2023-2029 (USD Billion)
Table A67: South Korea Simulation and Analysis Market, By End-use, By Value, 2019-2022 (USD Billion)
Table A68: South Korea Simulation and Analysis Market, By End-use, By Value, 2023-2029 (USD Billion)
Table A69: India Simulation and Analysis Market, By Component, By Value, 2019-2022 (USD Billion)
Table A70: India Simulation and Analysis Market, By Component, By Value, 2023-2029 (USD Billion)
Table A71: India Simulation and Analysis Market, By Deployment, By Value, 2019-2022 (USD Billion)
Table A72: India Simulation and Analysis Market, By Deployment, By Value, 2023-2029 (USD Billion)
Table A73: India Simulation and Analysis Market, By End-use, By Value, 2019-2022 (USD Billion)
Table A74: India Simulation and Analysis Market, By End-use, By Value, 2023-2029 (USD Billion)
Table A75: Rest of Asia Pacific Simulation and Analysis Market, By Component, By Value, 2019-2022 (USD Billion)
Table A76: Rest of Asia Pacific Simulation and Analysis Market, By Component, By Value, 2023-2029 (USD Billion)
Table A77: Rest of Asia Pacific Simulation and Analysis Market, By Deployment, By Value, 2019-2022 (USD Billion)
Table A78: Rest of Asia Pacific Simulation and Analysis Market, By Deployment, By Value, 2023-2029 (USD Billion)
Table A79: Rest of Asia Pacific Simulation and Analysis Market, By End-use, By Value, 2019-2022 (USD Billion)
Table A80: Rest of Asia Pacific Simulation and Analysis Market, By End-use, By Value, 2023-2029 (USD Billion)
Table A81: Altair Engineering Inc. Financials, 2020-2022
Table A82: Ansys, Inc. Financials, 2020-2022
Table A83: Autodesk, Inc. Financials, 2020-2022
Table A84: Dassault Systemes Financials, 2020-2022
Table A85: Certara, Inc. Financials, 2020-2022
Table A86: Hexagon Financials, 2020-2022
Table A87: Keysight Technologies Financials, 2020-2022
Executive Summary
Azoth Analytics has released a research report titled "Global Simulation and Analysis Market (2024 Edition)" which provides a complete analysis of the Global Simulation and Analysis Market industry in terms of market segmentation By Component (Software, Service) Deployment (On-premise, Cloud) and End-use (Automotive, Aerospace & Defense, Industrial Manufacturing, Healthcare, Others). The report analyzes the Global Simulation and Analysis Market for the historical period of 2019-2022, the estimated year 2023 and the forecast period of 2024-2029.
The report analyses the Simulation and Analysis Market by Region (Americas, Europe, Asia Pacific, Middle East & Africa) and 10 Countries (United States, Canada, Brazil, Germany, United Kingdom, France, China, Japan, South Korea, India). The research study also assesses growth indicators, restraints, sales growth and demand risk, and other important statistics, as well as a full assessment of current and future market trends that are relevant to the market's evolution.
During the forecast period, 2024-2029, the Global Simulation and Analysis Market is expected to expand at a CAGR of 8.6%. The global Simulation and Analysis market is expected to grow at an extraordinary rate driven by the significant adoption of simulation tools from key players. The Global Simulation and Analysis market is expected to increase from USD 10.26 billion in 2024 to USD 15.50 billion in 2029, according to Azoth Analytics' estimates. The significance of simulation tools has increased with the advent of the Fourth Industrial Revolution, which is marked by smart manufacturing and networking. With significant market value, the global simulation and analysis market is a dynamic, growing business. It covers a wide range of industries, such as aerospace, automotive, manufacturing, and healthcare. The growing utilization of simulation software in various sectors for process optimization, product development, and operational efficiency is the primary factor driving the market value.
The increasing demand for virtual testing and training solutions, technical improvements, and the integration of simulation across many industries are driving considerable growth in the global simulation and analysis market. Simulation and analysis solutions are being used more and more in a variety of industries, such as aerospace, automotive, healthcare, manufacturing, and defence, for testing, product development, training, and operational optimization.
Growing Advancements in Simulation Software
The rapid development of technology has led to the emergence of increasingly complex and functional simulators that provide improved performance and capabilities. These developments allow companies in a range of industries to run more detailed and lifelike simulations, more accurately simulating complicated real-world situations. The development of simulation software has increased the precision of virtual models and broadened the industries and applications in which they can be used successfully.
Furthermore, as simulation software becomes more sophisticated, manufacturing, product development, and other crucial activities become more productive and efficient. Predictive modelling, optimization, and scenario analysis are made possible by the powerful algorithms, artificial intelligence, and machine learning included in modern simulation programs. The development of simulation software is a strong option for enterprises looking to improve decision-making, reduce expenses, and streamline processes. As more sectors come to understand the importance of these advanced methods in accomplishing their goals, the Simulation and Analysis Market is expected to grow as a result of these tools, which enable organizations to make better decisions, generate innovation, and obtain deeper insights.
Complexity and Integration Issues
The complexity and concerns with integration related to simulation and analysis tools pose significant barriers to the expansion of the worldwide market. The complex nature of these innovative tools, which frequently call for specific knowledge for efficient implementation and use, is one of the main challenges. It can be difficult to integrate simulation software into current workflows and systems, which might cause problems with older systems. Enterprises may encounter challenges in ensuring seamless interaction among diverse simulation tools and systems, hindering the general effectiveness and convenience of these technologies. User-friendly interfaces and seamless integration are becoming essential as industries want to exploit simulation's advantages for better decision-making and efficiency. For simulation and analytic solutions to be widely adopted and for companies to fully benefit from the insights and optimizations these tools can provide across a variety of sectors, these complexity and integration issues must be resolved.
Scope of the Report
- The report analyses the Global Simulation and Analysis Market by Value (USD Billion).
- The report presents the analysis of the Global Simulation and Analysis Market for the historical period of 2019-2022, the estimated year 2023 and the forecast period of 2024-2029.
- The report analyses the Global Simulation and Analysis Market by Component (Software, Service).
- The report analyses the Simulation and Analysis Market by Deployment (On-premise, Cloud).
- The report analyses the Simulation and Analysis Market by End-use (Automotive, Aerospace & Defense, Industrial Manufacturing, Healthcare, Others).
- The report analyses the Simulation and Analysis Market by Region (Americas, Europe, Asia Pacific, Middle East & Africa).
- The report analyses the Simulation and Analysis Market by Country (United States, Canada, Brazil, Germany, United Kingdom, France, China, Japan, South Korea, India).
- The key insights of the report have been presented through the frameworks of SWOT and Porter's Five Forces Analysis.
- Also, the major opportunities, trends, drivers and challenges of the industry have been analyzed in the report.
- The report tracks competitive developments, strategies, mergers and acquisitions and new product development. The companies analysed in the report include Altair Engineering Inc., Ansys, Inc., Autodesk, Inc., Dassault Systemes, Certara, Inc., Hexagon AB, Keysight Technologies, Simulations Plus, Inc., Gamma Technologies and Siemens Digital Industries Software.
Table of Contents
1. Market Background
- 1.1 Scope and Product Outlook
- 1.2 Executive Summary
- 1.3 Research Methodology
2. Strategic Recommendations
3. Global Simulation and Analysis Market: Historic and Forecast (2019-2029)
- 3.1 Impact Analysis of Macro Economic Factors on Simulation and Analysis Market
- 3.2 Global Simulation and Analysis Market: Worldwide IT Spending By Category
- 3.3 Global Simulation and Analysis Market: Disciplines and Competitive Dynamics
- 3.4 Global Simulation and Analysis Market: Software Product Sales & Gross Margin
- 3.5 Global Simulation and Analysis Market: Dashboard
- 3.6 Global Simulation and Analysis Market: Market Value Assessment, 2019-2029 (USD Billion)
- 3.7 Impact of COVID-19 on Simulation and Analysis Market
- 3.8 Global Simulation and Analysis Market Segmentation: By Component
- 3.8.1 Global Simulation and Analysis Market, By Component Overview
- 3.8.2 Global Simulation and Analysis Market Size, By Software, By Value, 2019H-2029F (USD Billion & CAGR)
- 3.8.3 Global Simulation and Analysis Market Size, By Service, By Value, 2019H-2029F (USD Billion & CAGR)
- 3.9 Global Simulation and Analysis Market Segmentation: By Deployment
- 3.9.1 Global Simulation and Analysis Market, By Deployment Overview
- 3.9.2 Global Simulation and Analysis Market Size, By On-premise, By Value, 2019H-2029F (USD Billion & CAGR)
- 3.9.3 Global Simulation and Analysis Market Size, By Cloud, By Value, 2019H-2029F (USD Billion & CAGR)
- 3.10 Global Simulation and Analysis Market Segmentation: By End-use
- 3.10.1 Global Simulation and Analysis Market, By End-use Overview
- 3.10.2 Global Simulation and Analysis Market Size, By Automotive, By Value, 2019H-2029F (USD Billion & CAGR)
- 3.10.3 Global Simulation and Analysis Market Size, By Aerospace & Defense, By Value, 2019H-2029F (USD Billion & CAGR)
- 3.10.4 Global Simulation and Analysis Market Size, By Industrial Manufacturing, By Value, 2019H-2029F (USD Billion & CAGR)
- 3.10.5 Global Simulation and Analysis Market Size, By Healthcare, By Value, 2019H-2029F (USD Billion & CAGR)
- 3.10.6 Global Simulation and Analysis Market Size, By Others, By Value, 2019H-2029F (USD Billion & CAGR)
4. Global Simulation and Analysis Market: Regional Analysis
- 4.1 Regional Coverage of the Study
- 4.2 Regional Snapshot
5. Americas Simulation and Analysis Market: Historic and Forecast (2019-2029)
- 5.1 Americas Simulation and Analysis Market: Snapshot
- 5.2 Americas Simulation and Analysis Market: Market Value Assessment, 2019-2029 (USD Billion & CAGR)
- 5.3 Americas Simulation and Analysis Market: Key Factors
- 5.4 Americas Simulation and Analysis Market: Segment Analysis
- 5.5 Americas Simulation and Analysis Market Segmentation: By Component
- 5.5.1 Americas Simulation and Analysis Market, By Component Overview
- 5.5.2 Americas Simulation and Analysis Market Size, By Software, By Value, 2019H-2029F (USD Billion & CAGR)
- 5.5.3 Americas Simulation and Analysis Market Size, By Service, By Value, 2019H-2029F (USD Billion & CAGR)
- 5.6 Americas Simulation and Analysis Market Segmentation: By Deployment
- 5.6.1 Americas Simulation and Analysis Market, By Deployment Overview
- 5.6.2 Americas Simulation and Analysis Market Size, By On-premise, By Value, 2019H-2029F (USD Billion & CAGR)
- 5.6.3 Americas Simulation and Analysis Market Size, By Cloud, By Value, 2019H-2029F (USD Billion & CAGR)
- 5.7 Americas Simulation and Analysis Market Segmentation: By End-use
- 5.7.1 Americas Simulation and Analysis Market, By End-use Overview
- 5.7.2 Americas Simulation and Analysis Market Size, By Automotive, By Value, 2019H-2029F (USD Billion & CAGR)
- 5.7.3 Americas Simulation and Analysis Market Size, By Aerospace & Defense, By Value, 2019H-2029F (USD Billion & CAGR)
- 5.7.4 Americas Simulation and Analysis Market Size, By Industrial Manufacturing, By Value, 2019H-2029F (USD Billion & CAGR)
- 5.7.5 Americas Simulation and Analysis Market Size, By Healthcare, By Value, 2019H-2029F (USD Billion & CAGR)
- 5.7.6 Americas Simulation and Analysis Market Size, By Others, By Value, 2019H-2029F (USD Billion & CAGR)
- 5.8 Americas Simulation and Analysis Market Segmentation: By Country
- 5.8.1 Americas Simulation and Analysis Market, By Country Overview
- 5.8.2 United States Simulation and Analysis Market: Market Size and CAGR, 2019-2029 (USD Billion & CAGR)
- 5.8.2.1 United States Simulation and Analysis Market, By Component
- 5.8.2.2 United States Simulation and Analysis Market, By Deployment
- 5.8.2.3 United States Simulation and Analysis Market, By End-use
- 5.8.3 Canada Simulation and Analysis Market: Market Size and CAGR, 2019-2029 (USD Billion & CAGR)
- 5.8.3.1 Canada Simulation and Analysis Market, By Component
- 5.8.3.2 Canada Simulation and Analysis Market, By Deployment
- 5.8.3.3 Canada Simulation and Analysis Market, By End-use
- 5.8.4 Brazil Simulation and Analysis Market: Market Size and CAGR, 2019-2029 (USD Billion & CAGR)
- 5.8.4.1 Brazil Simulation and Analysis Market, By Component
- 5.8.4.2 Brazil Simulation and Analysis Market, By Deployment
- 5.8.4.3 Brazil Simulation and Analysis Market, By End-use
- 5.8.5 Rest of Americas Simulation and Analysis Market: Market Size and CAGR, 2019-2029 (USD Billion & CAGR)
- 5.8.5.1 Rest of Americas Simulation and Analysis Market, By Component
- 5.8.5.2 Rest of Americas Simulation and Analysis Market, By Deployment
- 5.8.5.3 Rest of Americas Simulation and Analysis Market, By End-use
6. Europe Simulation and Analysis Market: Historic and Forecast (2019-2029)
- 6.1 Europe Simulation and Analysis Market: Snapshot
- 6.2 Europe Simulation and Analysis Market: Market Value Assessment, 2019-2029 (USD Billion & CAGR)
- 6.3 Europe Simulation and Analysis Market: Key Factors
- 6.4 Europe Simulation and Analysis Market: Segment Analysis
- 6.5 Europe Simulation and Analysis Market Segmentation: By Component
- 6.5.1 Europe Simulation and Analysis Market, By Component Overview
- 6.5.2 Europe Simulation and Analysis Market Size, By Software, By Value, 2019H-2029F (USD Billion & CAGR)
- 6.5.3 Europe Simulation and Analysis Market Size, By Service, By Value, 2019H-2029F (USD Billion & CAGR)
- 6.6 Europe Simulation and Analysis Market Segmentation: By Deployment
- 6.6.1 Europe Simulation and Analysis Market, By Deployment Overview
- 6.6.2 Europe Simulation and Analysis Market Size, By On premise, By Value, 2019H-2029F (USD Billion & CAGR)
- 6.6.3 Europe Simulation and Analysis Market Size, By Cloud, By Value, 2019H-2029F (USD Billion & CAGR)
- 6.7 Europe Simulation and Analysis Market Segmentation: By End-use
- 6.7.1 Europe Simulation and Analysis Market, By End-use Overview
- 6.7.2 Europe Simulation and Analysis Market Size, By Automotive, By Value, 2019H-2029F (USD Billion & CAGR)
- 6.7.3 Europe Simulation and Analysis Market Size, By Aerospace & Defense, By Value, 2019H-2029F (USD Billion & CAGR)
- 6.7.4 Europe Simulation and Analysis Market Size, By Industrial Manufacturing, By Value, 2019H-2029F (USD Billion & CAGR)
- 6.7.5 Europe Simulation and Analysis Market Size, By Healthcare, By Value, 2019H-2029F (USD Billion & CAGR)
- 6.7.6 Europe Simulation and Analysis Market Size, By Others, By Value, 2019H-2029F (USD Billion & CAGR)
- 6.8 Europe Simulation and Analysis Market Segmentation: By Country
- 6.8.1 Europe Simulation and Analysis Market, By Country Overview
- 6.8.2 Germany Simulation and Analysis Market: Market Size and CAGR, 2019-2029 (USD Billion & CAGR)
- 6.8.2.1 Germany Simulation and Analysis Market, By Component
- 6.8.2.2 Germany Simulation and Analysis Market, By Deployment
- 6.8.2.3 Germany Simulation and Analysis Market, By End-use
- 6.8.3 United Kingdom Simulation and Analysis Market: Market Size and CAGR, 2019-2029 (USD Billion & CAGR)
- 6.8.3.1 United Kingdom Simulation and Analysis Market, By Component
- 6.8.3.2 United Kingdom Simulation and Analysis Market, By Deployment
- 6.8.3.3 United Kingdom Simulation and Analysis Market, By End-use
- 6.8.4 France Simulation and Analysis Market: Market Size and CAGR, 2019-2029 (USD Billion & CAGR)
- 6.8.4.1 France Simulation and Analysis Market, By Component
- 6.8.4.2 France Simulation and Analysis Market, By Deployment
- 6.8.4.3 France Simulation and Analysis Market, By End-use
- 6.8.5 Rest of Europe Simulation and Analysis Market: Market Size and CAGR, 2019-2029 (USD Billion & CAGR)
- 6.8.5.1 Rest of Europe Simulation and Analysis Market, By Component
- 6.8.5.2 Rest of Europe Simulation and Analysis Market, By Deployment
- 6.8.5.3 Rest of Europe Simulation and Analysis Market, By End-use
7. Asia Pacific Simulation and Analysis Market: Historic and Forecast (2019-2029)
- 7.1 Asia Pacific Simulation and Analysis Market: Snapshot
- 7.2 Asia Pacific Simulation and Analysis Market: Market Value Assessment, 2019-2029 (USD Billion & CAGR)
- 7.3 Asia Pacific Simulation and Analysis Market: Key Factors
- 7.4 Asia Pacific Simulation and Analysis Market: Segment Analysis
- 7.5 Asia Pacific Simulation and Analysis Market Segmentation: By Component
- 7.5.1 Asia Pacific Simulation and Analysis Market, By Component Overview
- 7.5.2 Asia Pacific Simulation and Analysis Market Size, By Software, By Value, 2019H-2029F (USD Billion & CAGR)
- 7.5.3 Asia Pacific Simulation and Analysis Market Size, By Service, By Value, 2019H-2029F (USD Billion & CAGR)
- 7.6 Asia Pacific Simulation and Analysis Market Segmentation: By Deployment
- 7.6.1 Asia Pacific Simulation and Analysis Market, By Deployment Overview
- 7.6.2 Asia Pacific Simulation and Analysis Market Size, By On-premise, By Value, 2019H-2029F (USD Billion & CAGR)
- 7.6.3 Asia Pacific Simulation and Analysis Market Size, By Cloud, By Value, 2019H-2029F (USD Billion & CAGR)
- 7.7 Asia Pacific Simulation and Analysis Market Segmentation: By End-use
- 7.7.1 Asia Pacific Simulation and Analysis Market, By End-use Overview
- 7.7.2 Asia Pacific Simulation and Analysis Market Size, By Automotive, By Value, 2019H-2029F (USD Billion & CAGR)
- 7.7.3 Asia Pacific Simulation and Analysis Market Size, By Aerospace & Defense, By Value, 2019H-2029F (USD Billion & CAGR)
- 7.7.4 Asia Pacific Simulation and Analysis Market Size, By Industrial Manufacturing, By Value, 2019H-2029F (USD Billion & CAGR)
- 7.7.5 Asia Pacific Simulation and Analysis Market Size, By Healthcare, By Value, 2019H-2029F (USD Billion & CAGR)
- 7.7.6 Asia Pacific Simulation and Analysis Market Size, By Others, By Value, 2019H-2029F (USD Billion & CAGR)
- 7.8 Asia Pacific Simulation and Analysis Market Segmentation: By Country
- 7.8.1 Asia Pacific Simulation and Analysis Market, By Country Overview
- 7.8.2 China Simulation and Analysis Market: Market Size and CAGR, 2019-2029 (USD Billion & CAGR)
- 7.8.2.1 China Simulation and Analysis Market, By Component
- 7.8.2.2 China Simulation and Analysis Market, By Deployment
- 7.8.2.3 China Simulation and Analysis Market, By End-use
- 7.8.3 Japan Simulation and Analysis Market: Market Size and CAGR, 2019-2029 (USD Billion & CAGR)
- 7.8.3.1 Japan Simulation and Analysis Market, By Component
- 7.8.3.2 Japan Simulation and Analysis Market, By Deployment
- 7.8.3.3 Japan Simulation and Analysis Market, By End-use
- 7.8.4 South Korea Simulation and Analysis Market: Market Size and CAGR, 2019-2029 (USD Billion & CAGR)
- 7.8.4.1 South Korea Simulation and Analysis Market, By Component
- 7.8.4.2 South Korea Simulation and Analysis Market, By Deployment
- 7.8.4.3 South Korea Simulation and Analysis Market, By End-use
- 7.8.5 India Simulation and Analysis Market: Market Size and CAGR, 2019-2029 (USD Billion & CAGR)
- 7.8.5.1 India Simulation and Analysis Market, By Component
- 7.8.5.2 India Simulation and Analysis Market, By Deployment
- 7.8.5.3 India Simulation and Analysis Market, By End-use
- 7.8.6 Rest of Asia Pacific Simulation and Analysis Market: Market Size and CAGR, 2019-2029 (USD Billion & CAGR)
- 7.8.6.1 Rest of Asia Pacific Simulation and Analysis Market, By Component
- 7.8.6.2 Rest of Asia Pacific Simulation and Analysis Market, By Deployment
- 7.8.6.3 Rest of Asia Pacific Simulation and Analysis Market, By End-use
8. Middle East & Africa Simulation and Analysis Market: Historic and Forecast (2019-2029)
- 8.1 Middle East & Africa Simulation and Analysis Market: Snapshot
- 8.2 Middle East & Africa Simulation and Analysis Market: Market Value Assessment, 2019-2029 (USD Billion & CAGR)
- 8.3 Middle East & Africa Simulation and Analysis Market: Key Factors
- 8.4 Middle East & Africa Simulation and Analysis Market: Segment Analysis
- 8.5 Middle East & Africa Simulation and Analysis Market Segmentation: By Component
- 8.5.1 Middle East & Africa Simulation and Analysis Market, By Component Overview
- 8.5.2 Middle East & Africa Simulation and Analysis Market Size, By Software, By Value, 2019H-2029F (USD Billion & CAGR)
- 8.5.3 Middle East & Africa Simulation and Analysis Market Size, By Service, By Value, 2019H-2029F (USD Billion & CAGR)
- 8.6 Middle East & Africa Simulation and Analysis Market Segmentation: By Deployment
- 8.6.1 Middle East & Africa Simulation and Analysis Market, By Deployment Overview
- 8.6.2 Middle East & Africa Simulation and Analysis Market Size, By On-premise, By Value, 2019H-2029F (USD Billion & CAGR)
- 8.6.3 Middle East & Africa Simulation and Analysis Market Size, By Cloud, By Value, 2019H-2029F (USD Billion & CAGR)
- 8.7 Middle East & Africa Simulation and Analysis Market Segmentation: By End-use
- 8.7.1 Middle East & Africa Simulation and Analysis Market, By End-use Overview
- 8.7.2 Middle East & Africa Simulation and Analysis Market Size, By Automotive, By Value, 2019H-2029F (USD Billion & CAGR)
- 8.7.3 Middle East & Africa Simulation and Analysis Market Size, By Aerospace & Defense, By Value, 2019H-2029F (USD Billion & CAGR)
- 8.7.4 Middle East & Africa Simulation and Analysis Market Size, By Industrial Manufacturing, By Value, 2019H-2029F (USD Billion & CAGR)
- 8.7.5 Middle East & Africa Simulation and Analysis Market Size, By Healthcare, By Value, 2019H-2029F (USD Billion & CAGR)
- 8.7.6 Middle East & Africa Simulation and Analysis Market Size, By Others, By Value, 2019H-2029F (USD Billion & CAGR)
9. Market Dynamics
- 9.1 Impact Assessment of Market Dynamics on Global Simulation and Analysis Market
- 9.2 Drivers
- 9.3 Restraints
- 9.4 Trends
10. Industry Ecosystem Analysis
- 10.1 Value Chain Analysis
- 10.2 Porter's Five Forces Model
11. Competitive Positioning
- 11.1 Companies' Product Positioning
- 11.2 Market Position Matrix
- 11.3 Market Share Analysis of Simulation and Analysis Market
- 11.4 Company Profiles
- 11.4.1 Altair Engineering Inc.
- 11.4.2 Ansys, Inc.
- 11.4.3 Autodesk, Inc.
- 11.4.4 Dassault Systemes
- 11.4.5 Certara, Inc.
- 11.4.6 Hexagon AB
- 11.4.7 Keysight Technologies
- 11.4.8 Simulations Plus, Inc.
- 11.4.9 Gamma Technologies
- 11.4.10 Siemens Digital Industries Software
