|
|
市場調査レポート
商品コード
1400506
LNGトラックの世界市場(2024年版):金額、数量、トラックタイプ別、重量タイプ別、用途別、地域別、国別の分析、市場考察、予測(2019年~2029年)Global LNG Truck Market (2024 Edition): Analysis By Value and Volume, Truck Type (Tractor Truck, Dump Truck, Others), Weight Type (Light, Medium, Heavy), By Application, By Region, By Country: Market Insights and Forecast (2019-2029) |
||||||
|
|||||||
|
|||||||


| LNGトラックの世界市場(2024年版):金額、数量、トラックタイプ別、重量タイプ別、用途別、地域別、国別の分析、市場考察、予測(2019年~2029年) |
|
出版日: 2024年01月01日
発行: Azoth Analytics
ページ情報: 英文 260 Pages
納期: 即納可能
|

全表示
- 概要
- 図表
- 目次
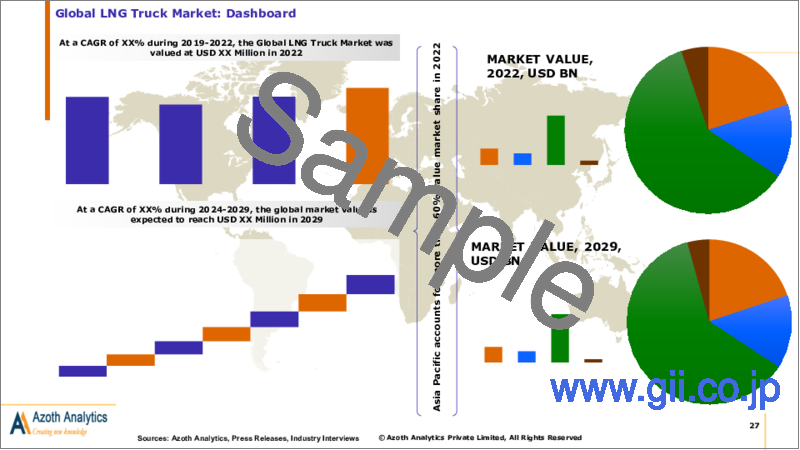
世界のLNGトラックの市場規模は、2019年~2022年にCAGRで3.3%の成長を示しました。2022年の市場規模は18億2,000万米ドルで、2029年に36億米ドルに達すると予測されます。LNGトラックはディーゼルトラックに比べ、窒素酸化物(NOx)、粒子状物質、温室効果ガスの排出が少ないです。これは多くの地域における厳しい排出規制と一致しており、LNGトラックを環境基準遵守への魅力的な選択肢としています。さらに、LNGはディーゼル燃料に比べて多くの場合コストの節減をもたらすため、LNGトラック市場は世界的に高い需要があります。さまざまな地域の政府や規制機関は、よりクリーンな燃料の採用を奨励するインセンティブや政策を実施しています。インセンティブには、LNGトラックを使用するフリートに対する税控除、補助金、規制免除などが含まれます。
市場は予測期間にCAGRで10.24%の成長が予測されます。LNGはディーゼルに比べて炭素含有量が少ないことで知られ、燃焼時の温室効果ガス排出が削減されます。LNGトラックの低排出プロファイルは、気候変動や大気質への懸念に対処しようとする企業や政府にアピールしており、企業や運送業者は、燃料源としてLNGを採用することの経済、環境、規制上の利点を認識しています。
さらに、世界のLNGトラックの台頭の背景には、環境の持続可能性への重視があります。輸送部門が温室効果ガス排出の大きな原因となっていることから、よりクリーンな燃料への移行が急務となっています。ディーゼルに比べて排出の少ないLNGは、気候変動と闘い、大気汚染物質を削減する世界の取り組みと一致しています。世界のさまざまな地域における厳しい排出規制は、運送業者がこれらの基準への適合を求めることから、LNGトラックの採用をさらに加速させています。
さらに、よりクリーンな技術の採用を支援するため、政府と民間団体は、給油ステーションを含むLNGインフラの開発に投資する可能性があります。このようなインフラの拡大は、LNGトラックの普及にとって極めて重要です。LNGは、従来のディーゼルよりも汚染物質や温室効果ガスの排出が少なく、よりクリーンな燃料と考えられています。LNGトラックの採用は環境目標に沿うものであり、輸送部門の全体的なカーボンフットプリントの削減に役立ちます。
当レポートでは、世界のLNGトラック市場について調査し、市場規模と予測、地域とセグメントの分析、主な動向と機会などの情報を提供しています。
目次
第1章 市場の背景
- 範囲と製品の見通し
- エグゼクティブサマリー
- 調査手法
第2章 アナリストの推奨事項
第3章 世界のLNGトラック市場:実績と予測(2019年~2029年)
- 世界のLNGトラック市場に対するマクロ経済要因の影響の分析
- LNGトラックとディーゼルトラックの排気管におけるCO2を含むGHG排出の比較
- ドイツにおけるセミトレーラー(耐用年数5年)のLNGトラックのユーザーコスト
- 世界のLNG輸入(2020年~2050年)
- 世界のLNGトラック市場:ダッシュボード
- 世界のLNGトラック市場:市場規模とCAGR(2019年~2029年)
- 世界のLNGトラック市場:トラック台数
- 世界のLNGトラック市場:市場金額の評価
- 評価:世界のLNGトラック市場に対するCOVID-19の影響度
- 世界のLNGトラック市場セグメンテーション:タイプ別
- 世界のLNGトラック市場:タイプ別、概要
- 世界のLNGトラックの市場規模:トラクタートラック(金額)(2019年~2029年)
- 世界のLNGトラックの市場規模:ダンプトラック(金額)(2019年~2029年)
- 世界のLNGトラックの市場規模:その他のタイプ(金額)(2019年~2029年)
- 世界のLNGトラック市場セグメンテーション:用途別
- 世界のLNGトラック市場:用途別、概要
- 世界のLNGトラックの市場規模:建設、鉱業(金額)(2019年~2029年)
- 世界のLNGトラックの市場規模:輸送、ロジスティクス(金額)(2019年~2029年)
- 世界のLNGトラックの市場規模:その他の用途(金額)(2019年~2029年)
- 世界のLNGトラック市場セグメンテーション:重量タイプ別
- 世界のLNGトラック市場:重量タイプ別、概要
- 世界のLNGトラックの市場規模:小型トラック(金額)(2019年~2029年)
- 世界のLNGトラックの市場規模:中型トラック(金額)(2019年~2029年)
- 世界のLNGトラックの市場規模:大型トラック(金額)(2019年~2029年)
第4章 LNGトラック市場、地域分析
- 研究の地域範囲
- 地域のスナップショット
第5章 南北アメリカのLNGトラック市場:実績と予測(2019年~2029年)
- 南北アメリカのLNGトラック市場:スナップショット
- 南北アメリカのLNGトラック市場:市場規模とCAGR(2019年~2029年)
- 南北アメリカのLNGトラック市場:トラック台数
- 南北アメリカのLNGトラック市場:主な要因
- 南北アメリカのLNGトラック市場:セグメント分析
- 南北アメリカのLNGトラック市場セグメンテーション:タイプ別
- 南北アメリカのLNGトラック市場セグメンテーション:用途別
- 南北アメリカのLNGトラック市場セグメンテーション:重量タイプ別
- 南北アメリカのLNGトラック市場セグメンテーション:国別
- 南北アメリカのLNGトラック市場:国別、概要
- 米国のLNGトラック市場:市場規模とCAGR(2019年~2029年)
- カナダのLNGトラック市場:市場規模とCAGR(2019年~2029年)
- ブラジルのLNGトラック市場:市場規模とCAGR(2019年~2029年)
- その他の南北アメリカのLNGトラック市場:市場規模とCAGR(2019年~2029年)
第6章 欧州のLNGトラック市場:実績と予測(2019年~2029年)
- 欧州のLNGトラック市場:スナップショット
- 欧州のLNGトラック市場:市場規模とCAGR(2019年~2029年)
- 欧州のLNGトラック市場:トラック台数
- 欧州のLNGトラック市場:主な要因
- 欧州のLNGトラック市場:セグメント分析
- 欧州のLNGトラック市場セグメンテーション:タイプ別
- 欧州のLNGトラック市場セグメンテーション:用途別
- 欧州のLNGトラック市場セグメンテーション:重量タイプ別
- 欧州のLNGトラック市場セグメンテーション:国別
- 欧州のLNGトラック市場:国別、概要
- ドイツのLNGトラック市場:市場規模とCAGR(2019年~2029年)
- 英国のLNGトラック市場:市場規模とCAGR(2019年~2029年)
- フランスのLNGトラック市場:市場規模とCAGR(2019年~2029年)
- イタリアのLNGトラック市場:市場規模とCAGR(2019年~2029年)
- その他の欧州のLNGトラック市場:市場規模とCAGR(2019年~2029年)
第7章 アジア太平洋のLNGトラック市場:実績と予測(2019年~2029年)
- アジア太平洋のLNGトラック市場:スナップショット
- アジア太平洋のLNGトラック市場:市場規模とCAGR(2019年~2029年)
- アジア太平洋のLNGトラック市場:トラック台数
- アジア太平洋のLNGトラック市場:主な要因
- アジア太平洋のLNGトラック市場:セグメント分析
- アジア太平洋のLNGトラック市場セグメンテーション:タイプ別
- アジア太平洋のLNGトラック市場セグメンテーション:用途別
- アジア太平洋のLNGトラック市場セグメンテーション:重量タイプ別
- アジア太平洋のLNGトラック市場セグメンテーション:国別
- アジア太平洋のLNGトラック市場:国別、概要
- 中国のLNGトラック市場:市場規模とCAGR(2019年~2029年)
- 日本のLNGトラック市場:市場規模とCAGR(2019年~2029年)
- インドのLNGトラック市場:市場規模とCAGR(2019年~2029年)
- その他のアジア太平洋の地域のLNGトラック市場:市場規模とCAGR(2019年~2029年)
第8章 中東・アフリカのLNGトラック市場:実績と予測
- 中東・アフリカのLNGトラック市場:スナップショット
- 中東・アフリカのLNGトラック市場:市場規模とCAGR(2019年~2029年)
- 中東・アフリカのLNGトラック市場:トラック台数
- 中東・アフリカのLNGトラック市場:主な要因
- 中東・アフリカのLNGトラック市場:セグメント分析
- 中東・アフリカのLNGトラック市場セグメンテーション:タイプ別
- 中東・アフリカのLNGトラック市場セグメンテーション:用途別
- 中東・アフリカのLNGトラック市場セグメンテーション:重量タイプ別
第9章 市場力学
- LNGトラック市場に対する市場力学の影響の評価
- 促進要因
- 抑制要因
- 動向
第10章 産業エコシステム分析
- バリューチェーン分析
- ポーター分析
第11章 競合ポジショニング
- 企業の製品ポジショニング
- 市場ポジションマトリクス
- LNGトラック市場の市場シェア分析
- 企業プロファイル
- Volvo Group
- Traton Group
- Iveco Group NV
- Tata Motors Ltd
- Mercedes Benz Group AG
- FAW Jiefang Group Co. LTD
- Sinotruk Hong Kong Ltd
- Ashok Leyland Ltd
- Beiqi Foton Motor Co Ltd
- Blue Energy Motors
List of Figures
List of Figures
- Figure 1: Tank-to-wheel GHG emission
- Figure 2: User costs of a semitrailer in €2019/km
- Figure 3: Global LNG imports - 2020
- Figure 4: Global LNG imports - 2050-Conservative Forecast
- Figure 5: Global LNG Truck Market Size, By Value, 2019-2022 (USD Million)
- Figure 6: Global LNG Truck Market Size, By Value, 2023-2029 (USD Million)
- Figure 7: Global LNG Truck Market Share, By Application, 2022 (%)
- Figure 8: Global LNG Truck Market Size, By Volume Sales, 2019-2022 (Number of Trucks)
- Figure 9: Global LNG Truck Market Size, By Volume Sales, 2023-2029 (Number of Trucks)
- Figure 10: Global LNG Truck Market Size, By Tractor Truck, By Value, 2019H-2029F (USD Millions & CAGR)
- Figure 11: Global LNG Truck Market Absolute Opportunity, By Tractor Truck, 2019-2029 (USD Million)
- Figure 12: Global LNG Truck Market Size, By Dump Truck, By Value, 2019H-2029F (USD Millions & CAGR)
- Figure 13: Global LNG Truck Market Absolute Opportunity, By Dump Truck, 2019-2029 (USD Million)
- Figure 14: Global LNG Truck Market Size, By Other Types, By Value, 2019H-2029F (USD Millions & CAGR)
- Figure 15: Global LNG Truck Market Absolute Opportunity, By Other Types, 2019-2029 (USD Million)
- Figure 16: Global LNG Truck Market Size, By Construction and Mining, By Value, 2019H-2029F (USD Millions & CAGR)
- Figure 17: Global LNG Truck Market Absolute Opportunity, By Construction and Mining, 2019-2029 (USD Million)
- Figure 18: Global LNG Truck Market Size, By Freight and Logistics, By Value, 2019H-2029F (USD Millions & CAGR)
- Figure 19: Global LNG Truck Market Absolute Opportunity, By Freight and Logistics, 2019-2029 (USD Million)
- Figure 20: Global LNG Truck Market Size, By Other Applications, By Value, 2019H-2029F (USD Millions & CAGR)
- Figure 21: Global LNG Truck Market Absolute Opportunity, By Other Applications, 2019-2029 (USD Million)
- Figure 22: Global LNG Truck Market Size, By Light Truck, By Value, 2019H-2029F (USD Millions & CAGR)
- Figure 23: Global LNG Truck Market Absolute Opportunity, By Light Truck, 2019-2029 (USD Million)
- Figure 24: Global LNG Truck Market Size, By Medium Truck, By Value, 2019H-2029F (USD Millions & CAGR)
- Figure 25: Global LNG Truck Market Absolute Opportunity, By Medium Truck, 2019-2029 (USD Million)
- Figure 26: Global LNG Truck Market Size, By Heavy Truck, By Value, 2019H-2029F (USD Millions & CAGR)
- Figure 27: Global LNG Truck Market Absolute Opportunity, By Heavy Truck, 2019-2029 (USD Million)
- Figure 28: Americas LNG Truck Market Size, By Value, 2019H-2029F (USD Million)
- Figure 29: Americas LNG Truck Market Share, By Application, 2022 (%)
- Figure 30: Americas LNG Truck Market Size, By Volume Sales, 2019-2022 (Number of Trucks)
- Figure 31: Americas LNG Truck Market Size, By Volume Sales, 2023-2029 (Number of Trucks)
- Figure 32: Americas LNG Truck Market, By Tractor Truck, By Value, 2019H-2029F (USD Millions & CAGR)
- Figure 33: Americas LNG Truck Market, By Dump Truck, By Value, 2019H-2029F (USD Millions & CAGR)
- Figure 34: Americas LNG Truck Market, By Other Types, By Value, 2019H-2029F (USD Millions & CAGR)
- Figure 35: Americas LNG Truck Market, By Construction and Mining, By Value, 2019H-2029F (USD Millions & CAGR)
- Figure 36: Americas LNG Truck Market, By Freight and Logistics, By Value, 2019H-2029F (USD Millions & CAGR)
- Figure 37: Americas LNG Truck Market, By Other Applications, By Value, 2019H-2029F (USD Millions & CAGR)
- Figure 38: Americas LNG Truck Market, By Light Truck, By Value, 2019H-2029F (USD Millions & CAGR)
- Figure 39: Americas LNG Truck Market, By Medium Truck, By Value, 2019H-2029F (USD Millions & CAGR)
- Figure 40: Americas LNG Truck Market, By Heavy Truck, By Value, 2019H-2029F (USD Millions & CAGR)
- Figure 41: United States LNG Truck Market, By Value, 2019-2029 (USD Millions & CAGR)
- Figure 42: United States LNG Truck Market Value, By Application, 2022 (USD Million)
- Figure 43: United States LNG Truck Market Share, By Type, By Value, 2022 (%)
- Figure 44: United States LNG Truck Market Share, By Application, By Value, 2022 (%)
- Figure 45: United States LNG Truck Market Share, By Weight Type, By Value, 2022 (%)
- Figure 46: Canada LNG Truck Market, By Value, 2019-2029 (USD Millions & CAGR)
- Figure 47: Canada LNG Truck Market Value, By Application, 2022 (USD Million)
- Figure 48: Canada LNG Truck Market Share, By Type, By Value, 2022 (%)
- Figure 49: Canada LNG Truck Market Share, By Application, By Value, 2022 (%)
- Figure 50: Canada LNG Truck Market Share, By Weight Type, By Value, 2022 (%)
- Figure 51: Brazil LNG Truck Market, By Value, 2019-2029 (USD Millions & CAGR)
- Figure 52: Brazil LNG Truck Market Value, By Application, 2022 (USD Million)
- Figure 53: Brazil LNG Truck Market Share, By Type, By Value, 2022 (%)
- Figure 54: Brazil LNG Truck Market Share, By Application, By Value, 2022 (%)
- Figure 55: Brazil LNG Truck Market Share, By Weight Type, By Value, 2022 (%)
- Figure 56: Rest of Americas LNG Truck Market, By Value, 2019-2029 (USD Millions & CAGR)
- Figure 57: Rest of Americas LNG Truck Market Value, By Application, 2022 (USD Million)
- Figure 58: Rest of Americas LNG Truck Market Share, By Type, By Value, 2022 (%)
- Figure 59: Rest of Americas LNG Truck Market Share, By Application, By Value, 2022 (%)
- Figure 60: Rest of Americas LNG Truck Market Share, By Weight Type, By Value, 2022 (%)
- Figure 61: Europe LNG Truck Market Size, By Value, 2019H-2029F (USD Million)
- Figure 62: Europe LNG Truck Market Share, By Application, 2022 (%)
- Figure 63: Europe LNG Truck Market Size, By Volume Sales, 2019-2022 (Number of Trucks)
- Figure 64: Europe LNG Truck Market Size, By Volume Sales, 2023-2029 (Number of Trucks)
- Figure 65: Europe LNG Truck Market, By Tractor Truck, By Value, 2019H-2029F (USD Millions & CAGR)
- Figure 66: Europe LNG Truck Market, By Dump Truck, By Value, 2019H-2029F (USD Millions & CAGR)
- Figure 67: Europe LNG Truck Market, By Other Types, By Value, 2019H-2029F (USD Millions & CAGR)
- Figure 68: Europe LNG Truck Market, By Construction and Mining, By Value, 2019H-2029F (USD Millions & CAGR)
- Figure 69: Europe LNG Truck Market, By Freight and Logistics, By Value, 2019H-2029F (USD Millions & CAGR)
- Figure 70: Europe LNG Truck Market, By Other Applications, By Value, 2019H-2029F (USD Millions & CAGR)
- Figure 71: Europe LNG Truck Market, By Light Truck, By Value, 2019H-2029F (USD Millions & CAGR)
- Figure 72: Europe LNG Truck Market, By Medium Truck, By Value, 2019H-2029F (USD Millions & CAGR)
- Figure 73: Europe LNG Truck Market, By Heavy Truck, By Value, 2019H-2029F (USD Millions & CAGR)
- Figure 74: Germany LNG Truck Market, By Value, 2019-2029 (USD Millions & CAGR)
- Figure 75: Germany LNG Truck Market Value, By Application, 2022 (USD Million)
- Figure 76: Germany LNG Truck Market Share, By Type, By Value, 2022 (%)
- Figure 77: Germany LNG Truck Market Share, By Application, By Value, 2022 (%)
- Figure 78: Germany LNG Truck Market Share, By Weight Type, By Value, 2022 (%)
- Figure 79: United Kingdom LNG Truck Market, By Value, 2019-2029 (USD Millions & CAGR)
- Figure 80: United Kingdom LNG Truck Market Value, By Application, 2022 (USD Million)
- Figure 81: United Kingdom LNG Truck Market Share, By Type, By Value, 2022 (%)
- Figure 82: United Kingdom LNG Truck Market Share, By Application, By Value, 2022 (%)
- Figure 83: United Kingdom LNG Truck Market Share, By Weight Type, By Value, 2022 (%)
- Figure 84: France LNG Truck Market, By Value, 2019-2029 (USD Millions & CAGR)
- Figure 85: France LNG Truck Market Value, By Application, 2022 (USD Million)
- Figure 86: France LNG Truck Market Share, By Type, By Value, 2022 (%)
- Figure 87: France LNG Truck Market Share, By Application, By Value, 2022 (%)
- Figure 88: France LNG Truck Market Share, By Weight Type, By Value, 2022 (%)
- Figure 89: Italy LNG Truck Market, By Value, 2019-2029 (USD Millions & CAGR)
- Figure 90: Italy LNG Truck Market Value, By Application, 2022 (USD Million)
- Figure 91: Italy LNG Truck Market Share, By Type, By Value, 2022 (%)
- Figure 92: Italy LNG Truck Market Share, By Application, By Value, 2022 (%)
- Figure 93: Italy LNG Truck Market Share, By Weight Type, By Value, 2022 (%)
- Figure 94: Rest of Europe LNG Truck Market, By Value, 2019-2029 (USD Millions & CAGR)
- Figure 95: Rest of Europe LNG Truck Market Value, By Application, 2022 (USD Million)
- Figure 96: Rest of Europe LNG Truck Market Share, By Type, By Value, 2022 (%)
- Figure 97: Rest of Europe LNG Truck Market Share, By Application, By Value, 2022 (%)
- Figure 98: Rest of Europe LNG Truck Market Share, By Weight Type, By Value, 2022 (%)
- Figure 99: Asia Pacific LNG Truck Market Size, By Value, 2019H-2029F (USD Million)
- Figure 100: Asia Pacific LNG Truck Market Share, By Application, 2022 (%)
- Figure 101: Asia Pacific LNG Truck Market Size, By Volume Sales, 2019-2022 (Number of Trucks)
- Figure 102: Asia Pacific LNG Truck Market Size, By Volume Sales, 2023-2029 (Number of Trucks)
- Figure 103: Asia Pacific LNG Truck Market, By Tractor Truck, By Value, 2019H-2029F (USD Millions & CAGR)
- Figure 104: Asia Pacific LNG Truck Market, By Dump Truck, By Value, 2019H-2029F (USD Millions & CAGR)
- Figure 105: Asia Pacific LNG Truck Market, By Other Types, By Value, 2019H-2029F (USD Millions & CAGR)
- Figure 106: Asia Pacific LNG Truck Market, By Construction and Mining, By Value, 2019H-2029F (USD Millions & CAGR)
- Figure 107: Asia Pacific LNG Truck Market, By Freight and Logistics, By Value, 2019H-2029F (USD Millions & CAGR)
- Figure 108: Asia Pacific LNG Truck Market, By Other Applications, By Value, 2019H-2029F (USD Millions & CAGR)
- Figure 109: Asia Pacific LNG Truck Market, By Light Truck, By Value, 2019H-2029F (USD Millions & CAGR)
- Figure 110: Asia Pacific LNG Truck Market, By Medium Truck, By Value, 2019H-2029F (USD Millions & CAGR)
- Figure 111: Asia Pacific LNG Truck Market, By Heavy Truck, By Value, 2019H-2029F (USD Millions & CAGR)
- Figure 112: China LNG Truck Market, By Value, 2019-2029 (USD Millions & CAGR)
- Figure 113: China LNG Truck Market Value, By Application, 2022 (USD Million)
- Figure 114: China LNG Truck Market Share, By Type, By Value, 2022 (%)
- Figure 115: China LNG Truck Market Share, By Application, By Value, 2022 (%)
- Figure 116: China LNG Truck Market Share, By Weight Type, By Value, 2022 (%)
- Figure 117: Japan LNG Truck Market, By Value, 2019-2029 (USD Millions & CAGR)
- Figure 118: Japan LNG Truck Market Value, By Application, 2022 (USD Million)
- Figure 119: Japan LNG Truck Market Share, By Type, By Value, 2022 (%)
- Figure 120: Japan LNG Truck Market Share, By Application, By Value, 2022 (%)
- Figure 121: Japan LNG Truck Market Share, By Weight Type, By Value, 2022 (%)
- Figure 122: India LNG Truck Market, By Value, 2019-2029 (USD Millions & CAGR)
- Figure 123: India LNG Truck Market Value, By Application, 2022 (USD Million)
- Figure 124: India LNG Truck Market Share, By Type, By Value, 2022 (%)
- Figure 125: India LNG Truck Market Share, By Application, By Value, 2022 (%)
- Figure 126: India LNG Truck Market Share, By Weight Type, By Value, 2022 (%)
- Figure 127: Rest of Asia Pacific LNG Truck Market, By Value, 2019-2029 (USD Millions & CAGR)
- Figure 128: Rest of Asia Pacific LNG Truck Market Value, By Application, 2022 (USD Million)
- Figure 129: Rest of Asia Pacific LNG Truck Market Share, By Type, By Value, 2022 (%)
- Figure 130: Rest of Asia Pacific LNG Truck Market Share, By Application, By Value, 2022 (%)
- Figure 131: Rest of Asia Pacific LNG Truck Market Share, By Weight Type, By Value, 2022 (%)
- Figure 132: Middle East and Africa LNG Truck Market Size, By Value, 2019H-2029F (USD Million)
- Figure 133: Middle East and Africa LNG Truck Market Share, By Application, 2022 (%)
- Figure 134: Middle East and Africa LNG Truck Market Size, By Volume Sales, 2019-2022 (Number of Trucks)
- Figure 135: Middle East and Africa LNG Truck Market Size, By Volume Sales, 2023-2029 (Number of Trucks)
- Figure 136: Middle East and Africa LNG Truck Market, By Tractor Truck, By Value, 2019H-2029F (USD Millions & CAGR)
- Figure 137: Middle East and Africa LNG Truck Market, By Dump Truck, By Value, 2019H-2029F (USD Millions & CAGR)
- Figure 138: Middle East and Africa LNG Truck Market, By Other Types, By Value, 2019H-2029F (USD Millions & CAGR)
- Figure 139: Middle East and Africa LNG Truck Market, By Construction and Mining, By Value, 2019H-2029F (USD Millions & CAGR)
- Figure 140: Middle East and Africa LNG Truck Market, By Freight and Logistics, By Value, 2019H-2029F (USD Millions & CAGR)
- Figure 141: Middle East and Africa LNG Truck Market, By Other Applications, By Value, 2019H-2029F (USD Millions & CAGR)
- Figure 142: Middle East and Africa LNG Truck Market, By Light Truck, By Value, 2019H-2029F (USD Millions & CAGR)
- Figure 143: Middle East and Africa LNG Truck Market, By Medium Truck, By Value, 2019H-2029F (USD Millions & CAGR)
- Figure 144: Middle East and Africa LNG Truck Market, By Heavy Truck, By Value, 2019H-2029F (USD Millions & CAGR)
- Figure 145: Market Share of Prominent Companies of LNG Truck Market, 2022 (%)
- Figure 146: Volve Revenue, 2020-2022 (USD Million)
- Figure 147: Volve Revenue, By Geographical Segments, 2022 (%)
- Figure 148: Volve Revenue, By Business Segments, 2022 (%)
- Figure 149: Traton Revenue, 2020-2022 (USD Million)
- Figure 150: Traton Revenue, By Geographical Segments, 2022 (%)
- Figure 151: Traton Revenue, By Reporting Segments, 2022 (%)
- Figure 152: Iveco Revenue, 2020-2022 (USD Million)
- Figure 153: Iveco Revenue, By Geographical Segments, 2022 (%)
- Figure 154: Iveco Revenue, By Reporting Segments, 2022 (%)
- Figure 155: Tata Motors Revenue, 2021-2023 (USD Million)
- Figure 156: Tata Motors Revenue, By Geographical Segments, 2022 (%)
- Figure 157: Tata Motors Revenue, By Operating Segments, 2022 (%)
- Figure 158: Mercedes Benz Revenue, 2020-2022 (USD Million)
- Figure 159: Mercedes Benz Revenue, By Geographical Segments, 2022 (%)
- Figure 160: Mercedes Benz Revenue, By Business Segments, 2022 (%)
- Figure 161: FAW Revenue, 2020-2022 (USD Million)
- Figure 162: FAW Revenue, By Product Segments, 2022 (%)
- Figure 163: FAW Revenue, By Product Segments, 2021 (%)
- Figure 164: Sinotruk Revenue, 2020-2022 (USD Million)
- Figure 165: Sinotruk Revenue, By Geographical Segments, 2022 (%)
- Figure 166: Sinotruk Revenue, By Product Segments, 2021 (%)
- Figure 167: Ashok Revenue, 2021-2023 (USD Million)
- Figure 168: Ashok Revenue, By Geographical Segments, 2022 (%)
- Figure 169: Ashok Revenue, By Product Segments, 2021 (%)
List of Tables
Table A1: Global Impact of Macro Economic Factors, By Region
Table A2: United States LNG Truck Market, By Type, By Value, 2019-2022 (USD Million)
Table A3: United States LNG Truck Market, By Type, By Value, 2023-2029 (USD Million)
Table A4: United States LNG Truck Market, By Application, By Value, 2019-2022 (USD Million)
Table A5: United States LNG Truck Market, By Application, By Value, 2023-2029 (USD Million)
Table A6: United States LNG Truck Market, By Weight Type, By Value, 2019-2022 (USD Million)
Table A7: United States LNG Truck Market, By Weight Type, By Value, 2023-2029 (USD Million)
Table A8: Canada LNG Truck Market, By Type, By Value, 2019-2022 (USD Million)
Table A9: Canada LNG Truck Market, By Type, By Value, 2023-2029 (USD Million)
Table A10: Canada LNG Truck Market, By Application, By Value, 2019-2022 (USD Million)
Table A11: Canada LNG Truck Market, By Application, By Value, 2023-2029 (USD Million)
Table A12: Canada LNG Truck Market, By Weight Type, By Value, 2019-2022 (USD Million)
Table A13: Canada LNG Truck Market, By Weight Type, By Value, 2023-2029 (USD Million)
Table A14: Brazil LNG Truck Market, By Type, By Value, 2019-2022 (USD Million)
Table A15: Brazil LNG Truck Market, By Type, By Value, 2023-2029 (USD Million)
Table A16: Brazil LNG Truck Market, By Application, By Value, 2019-2022 (USD Million)
Table A17: Brazil LNG Truck Market, By Application, By Value, 2023-2029 (USD Million)
Table A18: Brazil LNG Truck Market, By Weight Type, By Value, 2019-2022 (USD Million)
Table A19: Brazil LNG Truck Market, By Weight Type, By Value, 2023-2029 (USD Million)
Table A20: Rest of Americas LNG Truck Market, By Type, By Value, 2019-2022 (USD Million)
Table A21: Rest of Americas LNG Truck Market, By Type, By Value, 2023-2029 (USD Million)
Table A22: Rest of Americas LNG Truck Market, By Application, By Value, 2019-2022 (USD Million)
Table A23: Rest of Americas LNG Truck Market, By Application, By Value, 2023-2029 (USD Million)
Table A24: Rest of Americas LNG Truck Market, By Weight Type, By Value, 2019-2022 (USD Million)
Table A25: Rest of Americas LNG Truck Market, By Weight Type, By Value, 2023-2029 (USD Million)
Table A26: Germany LNG Truck Market, By Type, By Value, 2019-2022 (USD Million)
Table A27: Germany LNG Truck Market, By Type, By Value, 2023-2029 (USD Million)
Table A28: Germany LNG Truck Market, By Application, By Value, 2019-2022 (USD Million)
Table A29: Germany LNG Truck Market, By Application, By Value, 2023-2029 (USD Million)
Table A30: Germany LNG Truck Market, By Weight Type, By Value, 2019-2022 (USD Million)
Table A31: Germany LNG Truck Market, By Weight Type, By Value, 2023-2029 (USD Million)
Table A32: United Kingdom LNG Truck Market, By Type, By Value, 2019-2022 (USD Million)
Table A33: United Kingdom LNG Truck Market, By Type, By Value, 2023-2029 (USD Million)
Table A34: United Kingdom LNG Truck Market, By Application, By Value, 2019-2022 (USD Million)
Table A35: United Kingdom LNG Truck Market, By Application, By Value, 2023-2029 (USD Million)
Table A36: United Kingdom LNG Truck Market, By Weight Type, By Value, 2019-2022 (USD Million
Table A37: United Kingdom LNG Truck Market, By Weight Type, By Value, 2023-2029 (USD Million)
Table A38: France LNG Truck Market, By Type, By Value, 2019-2022 (USD Million)
Table A39: France LNG Truck Market, By Type, By Value, 2023-2029 (USD Million)
Table A40: France LNG Truck Market, By Application, By Value, 2019-2022 (USD Million)
Table A41: France LNG Truck Market, By Application, By Value, 2023-2029 (USD Million)
Table A42: France LNG Truck Market, By Weight Type, By Value, 2019-2022 (USD Million)
Table A43: France LNG Truck Market, By Weight Type, By Value, 2023-2029 (USD Million)
Table A44: Italy LNG Truck Market, By Type, By Value, 2019-2022 (USD Million)
Table A45: Italy LNG Truck Market, By Type, By Value, 2023-2029 (USD Million)
Table A46: Italy LNG Truck Market, By Application, By Value, 2019-2022 (USD Million)
Table A47: Italy LNG Truck Market, By Application, By Value, 2023-2029 (USD Million)
Table A48: Italy LNG Truck Market, By Weight Type, By Value, 2019-2022 (USD Million)
Table A49: Italy LNG Truck Market, By Weight Type, By Value, 2023-2029 (USD Million)
Table A50: Rest of Europe LNG Truck Market, By Type, By Value, 2019-2022 (USD Million)
Table A51: Rest of Europe LNG Truck Market, By Type, By Value, 2023-2029 (USD Million)
Table A52: Rest of Europe LNG Truck Market, By Application, By Value, 2019-2022 (USD Million)
Table A53: Rest of Europe LNG Truck Market, By Application, By Value, 2023-2029 (USD Million)
Table A54: Rest of Europe LNG Truck Market, By Weight Type, By Value, 2019-2022 (USD Million)
Table A55: Rest of Europe LNG Truck Market, By Weight Type, By Value, 2023-2029 (USD Million)
Table A56: China LNG Truck Market, By Type, By Value, 2019-2022 (USD Million)
Table A57: China LNG Truck Market, By Type, By Value, 2023-2029 (USD Million)
Table A58: China LNG Truck Market, By Application, By Value, 2019-2022 (USD Million)
Table A59: China LNG Truck Market, By Application, By Value, 2023-2029 (USD Million)
Table A60: China LNG Truck Market, By Weight Type, By Value, 2019-2022 (USD Million)
Table A61: China LNG Truck Market, By Weight Type, By Value, 2023-2029 (USD Million)
Table A62: Japan LNG Truck Market, By Type, By Value, 2019-2022 (USD Million)
Table A63: Japan LNG Truck Market, By Type, By Value, 2023-2029 (USD Million)
Table A64: Japan LNG Truck Market, By Application, By Value, 2019-2022 (USD Million)
Table A65: Japan LNG Truck Market, By Application, By Value, 2023-2029 (USD Million)
Table A66: Japan LNG Truck Market, By Weight Type, By Value, 2019-2022 (USD Million)
Table A67: Japan LNG Truck Market, By Weight Type, By Value, 2023-2029 (USD Million)
Table A68: India LNG Truck Market, By Type, By Value, 2019-2022 (USD Million)
Table A69: India LNG Truck Market, By Type, By Value, 2023-2029 (USD Million)
Table A70: India LNG Truck Market, By Application, By Value, 2019-2022 (USD Million)
Table A71: India LNG Truck Market, By Application, By Value, 2023-2029 (USD Million)
Table A72: India LNG Truck Market, By Weight Type, By Value, 2019-2022 (USD Million)
Table A73: India LNG Truck Market, By Weight Type, By Value, 2023-2029 (USD Million)
Table A74: Rest of Asia Pacific LNG Truck Market, By Type, By Value, 2019-2022 (USD Million)
Table A75: Rest of Asia Pacific LNG Truck Market, By Type, By Value, 2023-2029 (USD Million)
Table A76: Rest of Asia Pacific LNG Truck Market, By Application, By Value, 2019-2022 (USD Million)
Table A77: Rest of Asia Pacific LNG Truck Market, By Application, By Value, 2023-2029 (USD Million)
Table A78: Rest of Asia Pacific LNG Truck Market, By Weight Type, By Value, 2019-2022 (USD Million)
Table A79: Rest of Asia Pacific LNG Truck Market, By Weight Type, By Value, 2023-2029 (USD Million)
Table A80: Volve Key Company Financials, 2020-2022
Table A81: Traton Key Company Financials, 2020-2022
Table A82: Iveco Key Company Financials, 2020-2022
Table A83: Tata Motors Key Company Financials, 2020-2022
Table A84: Mercedes Benz Key Company Financials, 2020-2022
Table A85: FAW Key Company Financials, 2020-2022
Table A86: Sinotruk Key Company Financials, 2020-2022
Table A87: Ashok Key Company Financials, 2021-2023
Executive Summary
Azoth Analytics has released a research report titled "Global LNG Truck Market (2023 Edition)" which provides a complete analysis of the Global LNG Truck industry in terms of value and volume (number of LNG trucks), market segmentation by Type (Tractor Truck, Dump Truck, Other Types), Application (Construction and Mining, Freight and Logistics and Other Applications), Weight Type (Light Truck, Medium Truck and Heavy Truck) for the historical period of 2019-2022, the estimates of 2023 and the forecast period of 2024-2029.
The Global LNG Truck market showcased growth at a CAGR of 3.3% during 2019-2022. The market was valued at USD 1.82 Billion in 2022 which is expected to reach USD 3.6 Billion in 2029. LNG trucks produce lower emissions of nitrogen oxides (NOx), particulate matter, and greenhouse gases compared to diesel trucks. This aligns with stringent emissions regulations in many regions, making LNG trucks an attractive option for compliance with environmental standards. Moreover, LNG often offers cost savings compared to diesel fuel due to which there is high demand for the LNG truck market globally. Governments and regulatory bodies in various regions are implementing incentives and policies to encourage the adoption of cleaner fuels. Incentives may include tax credits, subsidies, and regulatory exemptions for fleets using LNG trucks.
The Global LNG Truck Market is expected to grow in the forecast period and register growth at a CAGR of 10.24% during the forecast period. LNG is known for its lower carbon content compared to diesel, resulting in reduced greenhouse gas emissions when burned. The lower emissions profile of LNG trucks appeals to companies and governments aiming to address climate change and air quality concerns, as businesses and fleet operators recognize the economic, environmental, and regulatory advantages of adopting LNG as a fuel source.
Moreover, one of the key drivers behind the global rise of LNG trucks is the increasing emphasis on environmental sustainability. With the transportation sector being a major contributor to greenhouse gas emissions, there is a growing urgency to transition to cleaner fuels. LNG, with its lower emissions profile compared to diesel, aligns with global efforts to combat climate change and reduce air pollutants. Stringent emissions regulations in various regions worldwide have further accelerated the adoption of LNG trucks, as fleet operators seek compliance with these standards.
Due to global warming to no more than 1.5°C - as called for in the Paris Agreement - emissions need to be reduced by 45% by 2030 and reach net zero by 2050. Increasing emission standards often favour cleaner technologies, including alternative fuels like LNG. The LNG truck market can experience growth as fleet operators seek compliance with stringent emission policies.
LNG trucks, known for producing lower emissions compared to traditional diesel vehicles, become more competitive in regions with strict emission policies. This can contribute to market share gains for LNG trucks in the commercial vehicle sector. Governments may offer incentives, subsidies, or tax breaks to encourage the adoption of vehicles that meet or exceed stringent emission standards. These incentives can enhance the economic attractiveness of LNG trucks, driving increased adoption.
Moreover, to support the adoption of cleaner technologies, governments and private entities may invest in the development of LNG infrastructure, including refuelling stations. This infrastructure expansion is crucial for the widespread adoption of LNG trucks. LNG is considered a cleaner-burning fuel, emitting fewer pollutants and greenhouse gases than traditional diesel. The adoption of LNG trucks aligns with environmental goals and helps reduce the overall carbon footprint of the transportation sector.
Scope of the Report:
- The report analyses the LNG Truck Market by Value (USD Million) and By Volume (Number of Units).
- The report presents the analysis of the LNG Truck Market for the historical period of 2019-2022, the estimated year 2023 and the forecast period of 2024-2029.
- The report analyses the LNG Truck Market By Type (Tractor Truck, Dump Truck and Other Types)
- The report analyses the LNG Truck Market By Application (Construction and Mining, Freight and Logistics and Other Applications).
- The report analyses the LNG Truck Market By Weight Type (Light Truck, Medium Truck and Heavy Truck).
- The key insights of the report have been presented through the frameworks of SWOT and Porter's Five Forces Analysis. Also, the attractiveness of the market has been presented by region, By Types, by mode of operation & by end users.
- Also, the major opportunities, trends, drivers and challenges of the industry have been analyzed in the report.
- The report tracks competitive developments, strategies, mergers and acquisitions and new product development. The companies analysed in the report include of are Volvo Group and Traton Group, Iveco Group NV, Tata Motors Ltd, Mercedes Benz Group AG, FAW Jiefang Group Co. LTD, Sinotruk Hong Kong Ltd, Ashok Leyland Ltd, Beiqi Foton Motor Co Ltd and Blue Energy Motors.
Table of Contents
1. Market Background
- 1.1 Scope and Product Outlook
- 1.2 Executive Summary
- 1.3 Research Methodology
2. Analyst Recommendations
3. Global LNG Truck Market: Historic and Forecast (2019-2029)
- 3.1 Impact Analysis of Macro Economic Factors on Global LNG Truck Market
- 3.2 Comparison of LNG Truck and Diesel Truck in Tailpipe GHG Emissions Including CO2
- 3.3 LNG Truck User costs of a semitrailer (5 years lifetime) in Germany
- 3.4 Global LNG imports from 2020 to 2050
- 3.5 Global LNG Truck Market: Dashboard
- 3.6 Global LNG Truck Market: Market Size and CAGR, 2019-2029 (USD Million & CAGR)
- 3.7 Global LNG Truck Market: Volume Number of Trucks
- 3.8 Global LNG Truck Market: Market Value Assessment
- 3.9 Assessment: Degree of Impact of COVID-19 on Global LNG Truck Market
- 3.10 Global LNG Truck Market Segmentation: By Type
- 3.10.1 Global LNG Truck Market, By Type Overview
- 3.10.2 Global LNG Truck Market Size, By Tractor Truck, By Value, 2019H-2029F (USD Million & CAGR)
- 3.10.3 Global LNG Truck Market Size, By Dump Truck, By Value, 2019H-2029F (USD Million & CAGR)
- 3.10.4 Global LNG Truck Market Size, By Other Types, By Value, 2019H-2029F (USD Million & CAGR)
- 3.11 Global LNG Truck Market Segmentation: By Application
- 3.11.1 Global LNG Truck Market, By Application Overview
- 3.11.2 Global LNG Truck Market Size, By Construction and Mining, By Value, 2019H-2029F (USD Million & CAGR)
- 3.11.3 Global LNG Truck Market Size, By Freight and Logistics, By Value, 2019H-2029F (USD Million & CAGR)
- 3.11.4 Global LNG Truck Market Size, By Other Applications, By Value, 2019H-2029F (USD Million & CAGR)
- 3.12 Global LNG Truck Market Segmentation: By Weight Type
- 3.12.1 Global LNG Truck Market, By Weight Type Overview
- 3.12.2 Global LNG Truck Market Size, By Light Truck, By Value, 2019H-2029F (USD Million & CAGR)
- 3.12.3 Global LNG Truck Market Size, By Medium Truck, By Value, 2019H-2029F (USD Million & CAGR)
- 3.12.4 Global LNG Truck Market Size, By Heavy Truck, By Value, 2019H-2029F (USD Million & CAGR)
4. LNG Truck Market, Regional Analysis
- 4.1 Regional Coverage of the Study
- 4.2 Regional Snapshot
5. Americas LNG Truck Market: Historic and Forecast (2019-2029)
- 5.1 Americas LNG Truck Market: Snapshot
- 5.2 Americas LNG Truck Market: Market Size and CAGR, 2019-2029 (USD Million & CAGR)
- 5.3 Americas LNG Truck Market: Volume Number of Trucks
- 5.4 Americas LNG Truck Market: Key Factors
- 5.5 Americas LNG Truck Market: Segment Analysis
- 5.6 Americas LNG Truck Market Segmentation: By Type
- 5.6.1 Americas LNG Truck Market, By Type Overview
- 5.6.2 Americas LNG Truck Market Size, By Tractor Truck, By Value, 2019H-2029F (USD Million & CAGR)
- 5.6.3 Americas LNG Truck Market Size, By Dump Truck, By Value, 2019H-2029F (USD Million & CAGR)
- 5.6.4 Americas LNG Truck Market Size, By Other Types, By Value, 2019H-2029F (USD Million & CAGR)
- 5.7 Americas LNG Truck Market Segmentation: By Application
- 5.7.1 Americas LNG Truck Market, By Application Overview
- 5.7.2 Americas LNG Truck Market Size, By Construction and Mining, By Value, 2019H-2029F (USD Million & CAGR)
- 5.7.3 Americas LNG Truck Market Size, By Freight and Logistics, By Value, 2019H-2029F (USD Million & CAGR)
- 5.7.4 Americas LNG Truck Market Size, By Other Applications, By Value, 2019H-2029F (USD Million & CAGR)
- 5.8 Americas LNG Truck Market Segmentation: By Weight Type
- 5.8.1 Americas LNG Truck Market, By Weight Type Overview
- 5.8.2 Americas LNG Truck Market Size, By Light Truck, By Value, 2019H-2029F (USD Million & CAGR)
- 5.8.3 Americas LNG Truck Market Size, By Medium Truck, By Value, 2019H-2029F (USD Million & CAGR)
- 5.8.4 Americas LNG Truck Market Size, By Heavy Truck, By Value, 2019H-2029F (USD Million & CAGR)
- 5.9 Americas LNG Truck Market Segmentation: By Country
- 5.9.1 Americas LNG Truck Market, by Country Overview
- 5.9.2 United States LNG Truck Market: Market Size and CAGR, 2019-2029 (USD Million & CAGR)
- 5.9.2.1 United States LNG Truck Market, By Type
- 5.9.2.2 United States LNG Truck Market, By Application
- 5.9.2.3 United States LNG Truck Market, By Weight Type
- 5.9.3 Canada LNG Truck Market: Market Size and CAGR, 2019-2029 (USD Million & CAGR)
- 5.9.3.1 Canada LNG Truck Market, By Type
- 5.9.3.2 Canada LNG Truck Market, By Application
- 5.9.3.3 Canada LNG Truck Market, By Weight Type
- 5.9.4 Brazil LNG Truck Market: Market Size and CAGR, 2019-2029 (USD Million & CAGR)
- 5.9.4.1 Brazil LNG Truck Market, By Type
- 5.9.4.2 Brazil LNG Truck Market, By Application
- 5.9.4.3 Brazil LNG Truck Market, By Weight Type
- 5.9.5 Rest of Americas LNG Truck Market: Market Size and CAGR, 2019-2029 (USD Million & CAGR)
- 5.9.5.1 Rest of Americas LNG Truck Market, By Type
- 5.9.5.2 Rest of Americas LNG Truck Market, By Application
- 5.9.5.3 Rest of Americas LNG Truck Market, By Weight Type
6. Europe LNG Truck Market: Historic and Forecast (2019-2029)
- 6.1 Europe LNG Truck Market: Snapshot
- 6.2 Europe LNG Truck Market: Market Size and CAGR, 2019-2029 (USD Million & CAGR)
- 6.3 Europe LNG Truck Market: Volume Number of Trucks
- 6.4 Europe LNG Truck Market: Key Factors
- 6.5 Europe LNG Truck Market: Segment Analysis
- 6.6 Europe LNG Truck Market Segmentation: By Type
- 6.6.1 Europe LNG Truck Market, By Type Overview
- 6.6.2 Europe LNG Truck Market Size, By Tractor Truck, By Value, 2019H-2029F (USD Million & CAGR)
- 6.6.3 Europe LNG Truck Market Size, By Dump Truck, By Value, 2019H-2029F (USD Million & CAGR)
- 6.6.4 Europe LNG Truck Market Size, By Other Types, By Value, 2019H-2029F (USD Million & CAGR)
- 6.7 Europe LNG Truck Market Segmentation: By Application
- 6.7.1 Europe LNG Truck Market, By Application Overview
- 6.7.2 Europe LNG Truck Market Size, By Construction and Mining, By Value, 2019H-2029F (USD Million & CAGR)
- 6.7.3 Europe LNG Truck Market Size, By Freight and Logistics, By Value, 2019H-2029F (USD Million & CAGR)
- 6.7.4 Europe LNG Truck Market Size, By Other Applications, By Value, 2019H-2029F (USD Million & CAGR)
- 6.8 Europe LNG Truck Market Segmentation: By Weight Type
- 6.8.1 Europe LNG Truck Market, By Weight Type Overview
- 6.8.2 Europe LNG Truck Market Size, By Light Truck, By Value, 2019H-2029F (USD Million & CAGR)
- 6.8.3 Europe LNG Truck Market Size, By Medium Truck, By Value, 2019H-2029F (USD Million & CAGR)
- 6.8.4 Europe LNG Truck Market Size, By Heavy Truck, By Value, 2019H-2029F (USD Million & CAGR)
- 6.9 Europe LNG Truck Market Segmentation: By Country
- 6.9.1 Europe LNG Truck Market, by Country Overview
- 6.9.2 Germany LNG Truck Market: Market Size and CAGR, 2019-2029 (USD Million & CAGR)
- 6.9.2.1 Germany LNG Truck Market, By Type
- 6.9.2.2 Germany LNG Truck Market, By Application
- 6.9.2.3 Germany LNG Truck Market, By Weight Type
- 6.9.3 United Kingdom LNG Truck Market: Market Size and CAGR, 2019-2029 (USD Million & CAGR)
- 6.9.3.1 United Kingdom LNG Truck Market, By Type
- 6.9.3.2 United Kingdom LNG Truck Market, By Application
- 6.9.3.4 United Kingdom LNG Truck Market, By Weight Type
- 6.9.4 France LNG Truck Market: Market Size and CAGR, 2019-2029 (USD Million & CAGR)
- 6.9.4.1 France LNG Truck Market, By Type
- 6.9.4.2 France LNG Truck Market, By Application
- 6.9.4.3 France LNG Truck Market, By Weight Type
- 6.9.5 Italy LNG Truck Market: Market Size and CAGR, 2019-2029 (USD Million & CAGR)
- 6.9.5.1 Italy LNG Truck Market, By Type
- 6.9.5.2 Italy LNG Truck Market, By Application
- 6.9.5.3 Italy LNG Truck Market, By Weight Type
- 6.9.6 Rest of Europe LNG Truck Market: Market Size and CAGR, 2019-2029 (USD Million & CAGR)
- 6.9.6.1 Rest of Europe LNG Truck Market, By Type
- 6.9.6.2 Rest of Europe LNG Truck Market, By Application
- 6.9.6.3 Rest of Europe LNG Truck Market, By Weight Type
7. Asia Pacific LNG Truck Market: Historic and Forecast (2019-2029)
- 7.1 Asia Pacific LNG Truck Market: Snapshot
- 7.2 Asia Pacific LNG Truck Market: Market Size and CAGR, 2019-2029 (USD Million & CAGR)
- 7.3 Asia Pacific LNG Truck Market: Volume Number of Trucks
- 7.4 Asia Pacific LNG Truck Market: Key Factors
- 7.5 Asia Pacific LNG Truck Market: Segment Analysis
- 7.6 Asia Pacific LNG Truck Market Segmentation: By Type
- 7.6.1 Asia Pacific LNG Truck Market, By Type Overview
- 7.6.2 Asia Pacific LNG Truck Market Size, By Tractor Truck, By Value, 2019H-2029F (USD Million & CAGR)
- 7.6.3 Asia Pacific LNG Truck Market Size, By Dump Truck, By Value, 2019H-2029F (USD Million & CAGR)
- 7.6.4 Asia Pacific LNG Truck Market Size, By Other Types, By Value, 2019H-2029F (USD Million & CAGR)
- 7.7 Asia Pacific LNG Truck Market Segmentation: By Application
- 7.7.1 Asia Pacific LNG Truck Market, By Application Overview
- 7.7.2 Asia Pacific LNG Truck Market Size, By Construction and Mining, By Value, 2019H-2029F (USD Million & CAGR)
- 7.7.3 Asia Pacific LNG Truck Market Size, By Freight and Logistics, By Value, 2019H-2029F (USD Million & CAGR)
- 7.7.4 Asia Pacific LNG Truck Market Size, By Other Applications, By Value, 2019H-2029F (USD Million & CAGR)
- 7.8 Asia Pacific LNG Truck Market Segmentation: By Weight Type
- 7.8.1 Asia Pacific LNG Truck Market, By Weight Type Overview
- 7.8.2 Asia Pacific LNG Truck Market Size, By Light Truck, By Value, 2019H-2029F (USD Million & CAGR)
- 7.8.3 Asia Pacific LNG Truck Market Size, By Medium Truck, By Value, 2019H-2029F (USD Million & CAGR)
- 7.8.4 Asia Pacific LNG Truck Market Size, By Heavy Truck, By Value, 2019H-2029F (USD Million & CAGR)
- 7.9 Asia Pacific LNG Truck Market Segmentation: By Country
- 7.9.1 Asia Pacific LNG Truck Market, by Country Overview
- 7.9.2 China LNG Truck Market: Market Size and CAGR, 2019-2029 (USD Million & CAGR)
- 7.9.2.1 China LNG Truck Market, By Type
- 7.9.2.2 China LNG Truck Market, By Application
- 7.9.2.3 China LNG Truck Market, By Weight Type
- 7.9.3 Japan LNG Truck Market: Market Size and CAGR, 2019-2029 (USD Million & CAGR)
- 7.9.3.1 Japan LNG Truck Market, By Type
- 7.9.3.2 Japan LNG Truck Market, By Application
- 7.9.3.3 Japan LNG Truck Market, By Weight Type
- 7.9.4 India LNG Truck Market: Market Size and CAGR, 2019-2029 (USD Million & CAGR)
- 7.9.4.1 India LNG Truck Market, By Type
- 7.9.4.2 India LNG Truck Market, By Application
- 7.9.4.3 India LNG Truck Market, By Weight Type
- 7.9.5 Rest of Asia Pacific LNG Truck Market: Market Size and CAGR, 2019-2029 (USD Million & CAGR)
- 7.9.5.1 Rest of Asia Pacific LNG Truck Market, By Type
- 7.9.5.2 Rest of Asia Pacific LNG Truck Market, By Application
- 7.9.5.3 Rest of Asia Pacific LNG Truck Market, By Weight Type
8. Middle East & Africa LNG Truck Market: Historic and Forecast
- 8.1 Middle East & Africa LNG Truck Market: Snapshot
- 8.2 Middle East & Africa LNG Truck Market: Market Size and CAGR, 2019-2029 (USD Million & CAGR)
- 8.3 Middle East & Africa LNG Truck Market: Volume Number of Trucks
- 8.4 Middle East & Africa LNG Truck Market: Key Factors
- 8.5 Middle East and Africa LNG Truck Market: Segment Analysis
- 8.6 Middle East & Africa LNG Truck Market Segmentation: By Type
- 8.6.1 Middle East & Africa LNG Truck Market, By Type Overview
- 8.6.2 Middle East & Africa LNG Truck Market Size, By Tractor Truck, By Value, 2019H-2029F (USD Million & CAGR)
- 8.6.3 Middle East & Africa LNG Truck Market Size, By Dump Truck, By Value, 2019H-2029F (USD Million & CAGR)
- 8.6.3 Middle East & Africa LNG Truck Market Size, By Other Types, By Value, 2019H-2029F (USD Million & CAGR)
- 8.7 Middle East & Africa LNG Truck Market Segmentation: By Application
- 8.7.1 Middle East & Africa LNG Truck Market, By Application Overview
- 8.7.2 Middle East & Africa LNG Truck Market Size, By Construction and Mining, By Value, 2019H-2029F (USD Million & CAGR)
- 8.7.3 Middle East & Africa LNG Truck Market Size, By Freight and Logistics, By Value, 2019H-2029F (USD Million & CAGR)
- 8.7.4 Middle East & Africa LNG Truck Market Size, By Other Applications, By Value, 2019H-2029F (USD Million & CAGR)
- 8.8 Middle East & Africa LNG Truck Market Segmentation: By Weight Type
- 8.8.1 Middle East & Africa LNG Truck Market, By Weight Type Overview
- 8.8.2 Middle East & Africa LNG Truck Market Size, By Light Truck, By Value, 2019H-2029F (USD Million & CAGR)
- 8.8.3 Middle East & Africa LNG Truck Market Size, By Medium Truck, By Value, 2019H-2029F (USD Million & CAGR)
- 8.8.4 Middle East & Africa LNG Truck Market Size, By Heavy Truck, By Value, 2019H-2029F (USD Million & CAGR)
9. Market Dynamics
- 9.1 Impact Assessment of Market Dynamics on the LNG Truck Market
- 9.2 Drivers
- 9.3 Restraints
- 9.4 Trends
10. Industry Ecosystem Analysis
- 10.1 Value Chain Analysis
- 10.2 Porter Analysis
11. Competitive Positioning
- 11.1 Companies' Product Positioning
- 11.2 Market Position Matrix
- 11.3 Market Share Analysis of LNG Truck Market
- 11.4 Company Profiles
- 11.4.1 Volvo Group
- 11.4.2 Traton Group
- 11.4.3 Iveco Group NV
- 11.4.4 Tata Motors Ltd
- 11.4.5 Mercedes Benz Group AG
- 11.4.6 FAW Jiefang Group Co. LTD
- 11.4.7 Sinotruk Hong Kong Ltd
- 11.4.8 Ashok Leyland Ltd
- 11.4.9 Beiqi Foton Motor Co Ltd
- 11.4.10 Blue Energy Motors
