
|
市場調査レポート
商品コード
1851561
液化天然ガス(LNG):市場シェア分析、産業動向、統計、成長予測(2025年~2030年)Liquefied Natural Gas (LNG) - Market Share Analysis, Industry Trends & Statistics, Growth Forecasts (2025 - 2030) |
||||||
カスタマイズ可能
適宜更新あり
|
|||||||
| 液化天然ガス(LNG):市場シェア分析、産業動向、統計、成長予測(2025年~2030年) |
|
出版日: 2025年07月05日
発行: Mordor Intelligence
ページ情報: 英文 125 Pages
納期: 2~3営業日
|

概要
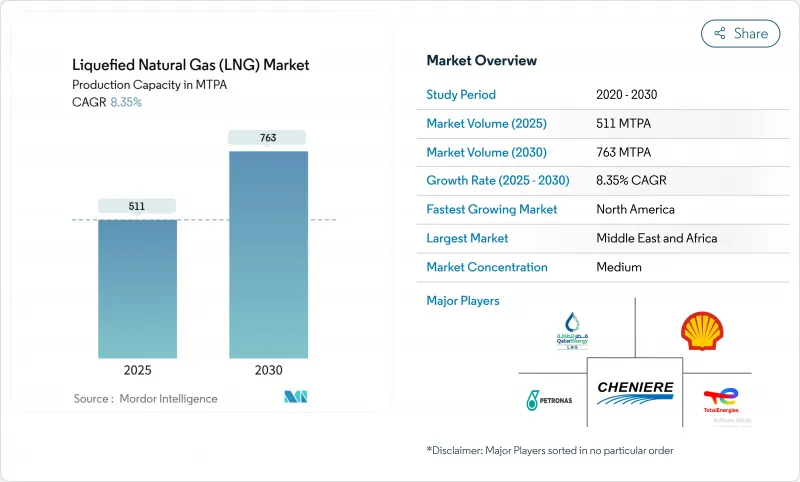
液化天然ガス(LNG)市場の生産能力規模は、2025年の511 MTPAから2030年には763 MTPAに拡大し、予測期間(2025-2030年)のCAGRは8.35%となる見込みです。
エネルギー安全保障の目標と脱炭素化の義務化によって、政府や電力会社は過渡的燃料としてLNGに舵を切っており、浮体式LNG技術の急速な採用によって供給オプションが広がり、これまで座礁していた海洋資源が開放されます。北米の輸出ターミナルはパーミアン・ベースンからの低コストのフィードガスを享受し、海運は硫黄キャップ遵守のためにLNGに軸足を移しつつあり、電化と炭素捕捉のアップグレードは操業の持続可能性を進めています。技術主導のコスト管理と柔軟な契約構造が取引パターンを再構築しているが、EPCインフレの長期化と再生可能水素の台頭が液化天然ガス市場の注目点であることに変わりはないです。
世界の液化天然ガス(LNG)市場の動向と洞察
アジア太平洋の電力向けガスプロジェクトが急増、LNGの中流引取契約を求める
アジア太平洋の電力会社は100bcmを超える再ガス化能力を新たに追加しており、インドでは2030年までにガス消費量を60%引き上げる計画です。国の脱炭素化目標は石炭からガスへの転換を加速させ、LNG供給と電力購入契約を直接結びつける統合契約を促しています。このようなタイトガスの結びつきは、資金調達リスクを低減し、プロジェクトのバンカビリティを向上させ、液化天然ガス市場の長期的な需要を強化します。
欧州におけるIMO-2020の硫黄キャップを受けて、海上バンカー燃料としてLNGが急速に普及
世界のLNG燃料船隊は2024年に33%増の638隻となり、2028年には1,200隻を超えると予想されます。コンテナ船はLNG積載重量トン数の60%を占め、198港でバンカー・インフラ整備が加速しています。液化天然ガス市場は、将来の排出規制への適合を拡大するバイオLNGの取り組みによって、さらに勢いを増しています。
EPCコスト高騰とモジュール製造のボトルネックによるFID遅延の長期化
2024年にFIDに達した生産能力はわずか14.8 MTPAで、20~30%のコスト高騰と労働力不足の中、大幅に減少しました。モジュール建設は、設備価格の上昇にもかかわらず人気を集めているが、遅れが2027~2029年に供給ギャップを広げ、液化天然ガス市場全体の変動を誘発する可能性があります。
セグメント分析
液化プラントは2024年の売上高の43%を占め、液化天然ガス市場で最も高いです。カタール、米国、オーストラリアの能力増強が、2030年までの予測CAGR11.1%を下支えします。電化コンプレッサーと炭素回収は排出量を削減し、総合メジャーの競争力を強化します。
このセグメントのエコシステムには現在904隻のLNG船が含まれ、その多くが温室効果ガス排出量を抑制する低メタンガスエンジンを搭載しています。FSRUは、2021年以降77百万トン/年の再ガス化能力を追加し、液化天然ガス市場へのモジュール展開を検証することで、特に欧州での輸入増加を加速させています。
発電は2024年に需要の38%を維持し、アジアではLNG-電力統合プロジェクトを通じて拡大しつつあります。これらのセットアップは、ターミナル、貯蔵、発電資産を統合し、信用リスクを低下させ、液化天然ガス市場の足跡を深くします。
海洋バンカリングは、アプリケーションの中で最も速いCAGR 14%を見込んでいます。船隊数、港湾バンカリングネットワーク、バイオLNGパイロットは持続的な成長を示唆しており、海運は液化天然ガス市場へのダイナミックな貢献者として位置づけられています。
液化天然ガス(LNG)市場レポートは、インフラタイプ(LNG液化プラント、LNG再ガス化施設、LNG船隊)、最終用途(発電、産業・製造、その他)、規模(大規模、中規模、小規模)、場所(陸上・海上)、地域(北米、欧州、アジア太平洋、南米、中東・アフリカ)で区分しています。
地域分析
中東・アフリカは2024年市場の28%を占めました。カタールの北油田は、2027年までに77 MTPAから126 MTPAに増強され、地域のリーダーシップを確固たるものにするとともに、欧州とアジア間のルーティングの柔軟性を向上させる。UAEとモーリタニアの新たなベンチャー企業は、液化天然ガス市場に厚みを加えるが、ホルムズ経由のタンカー保険コストは依然として運用上の懸念事項です。
北米は、豊富なシェールガスと2025年に運行を開始する13.3MTPAの輸出トレインのおかげで、2030年までのCAGRが10.5%に設定されています。カナダのキティマットのスタートアップとヘンリー・ハブにリンクした契約は、バイヤーの関心を高めているが、一時的な許認可の中断は10年代半ばのFID見通しを弱めています。
アジア太平洋は依然として最大の輸入センターであり、中国は2024年に7,864万トンを購入します。フィリピンとベトナムの初輸入国が顧客ベースを拡大し、小規模LNG流通が列島供給の牽引役となります。日本と韓国における再生可能エネルギーの成長と水素のパイロット事業は、地域の消費に長期的な不確実性をもたらします。
欧州は2021年以降、ロシアのパイプラインに代わる複数のFSRUを導入し、再ガス供給能力を44%拡大した。季節的な需要急増がプレミアム価格を維持し、差し迫ったEUのメタン規制が液化天然ガス市場全体のサプライチェーン監視を強化します。
その他の特典
- エクセル形式の市場予測(ME)シート
- 3ヶ月間のアナリストサポート
よくあるご質問
目次
第1章 イントロダクション
- 調査の前提条件と市場の定義
- 調査範囲
第2章 調査手法
第3章 エグゼクティブサマリー
第4章 市場情勢
- 市場概要
- 市場促進要因
- アジア太平洋ガス発電プロジェクトが急増、LNGオフテイク契約を求める
- 欧州におけるIMO-2020硫黄キャップに伴う海上バンカー燃料としてのLNGの急速な普及
- パーミアン・ベースンの随伴ガス生産量が米国メキシコ湾岸輸出ターミナル向け低コストの原料ガスを解き放つ
- 浮体式LNG技術がアフリカの座礁したオフショアガス田を解き放つ
- 中国の産業用ボイラーにおける石炭からガスへの転換政策がLNGスポット輸入を促進する
- OECD市場におけるエネルギー集約型データセンターからの低炭素供給に対する需要の高まり
- 市場抑制要因
- EPCコストインフレとモジュール製造のボトルネックによるFID遅延の長期化
- 再生可能水素の競合が北東アジアのLNG長期契約意欲を低下させる
- 米国とカナダにおける新規LNG輸出許可に対する規制モラトリアム
- 重要なチョークポイントにおける地政学的リスク(ホルムズ、スエズ)がLNG船保険コストを上昇させる
- サプライチェーン分析
- 規制の見通し
- テクノロジーの展望
- ポーターのファイブフォース
- 供給企業の交渉力
- 買い手の交渉力
- 新規参入業者の脅威
- 代替品の脅威
- 競争企業間の敵対関係
第5章 市場規模と成長予測
- インフラタイプ別
- LNG液化プラント[陸上液化、浮体式LNG(FLNG)、中規模(1~5mtpa)、小規模(1mtpa未満)]
- LNG再ガス化設備[陸上輸入ターミナル、浮体式貯蔵・再ガス化設備(FSRU)]
- LNG船隊[LNG船型別(モス、メンブレン)、船型別(Q-Max、Q-Flex、標準)、LNGバンカリング船]
- 最終用途別
- 発電事業
- 工業および製造業
- 住宅および商業施設
- 輸送(海上バンカリング、大型道路輸送、鉄道)
- 規模別
- 大規模(5mtpa以上)
- 中規模(1~5mtpa)
- 小規模(1mtpa未満)
- 地域別
- オンショア
- オフショア(FLNGとFSRU)
- 地域別
- 北米
- 米国
- カナダ
- メキシコ
- 欧州
- 英国
- ドイツ
- フランス
- スペイン
- 北欧諸国
- ロシア
- その他欧州地域
- アジア太平洋地域
- 中国
- インド
- 日本
- 韓国
- ASEAN諸国
- オーストラリア
- その他アジア太平洋地域
- 南米
- ブラジル
- アルゼンチン
- コロンビア
- その他南米
- 中東・アフリカ
- アラブ首長国連邦
- サウジアラビア
- カタール
- 南アフリカ
- エジプト
- その他中東・アフリカ地域
- 北米
第6章 競合情勢
- 市場集中度
- 戦略的な動き(M&A、パートナーシップ、PPA)
- 市場シェア分析(主要企業の市場ランク/シェア)
- 企業プロファイル
- QatarEnergy LNG(Qatargas)
- Shell plc
- Cheniere Energy Inc.
- TotalEnergies SE
- Petronas
- Novatek
- Chevron Corporation
- Exxon Mobil Corporation
- Woodside Energy Group
- Equinor ASA
- Sempra Infrastructure
- Venture Global LNG
- ENI SpA
- KOGAS
- Mitsui O.S.K. Lines
- Golar LNG
- BW LNG
- Technip Energies
- Bechtel Corporation
- Fluor Corporation
- KBR Inc.

