|
|
市場調査レポート
商品コード
1229133
アフィニティリガンドの世界市場(2023年)- タイプ別、最終用途別、地域別、国別の分析:市場規模、洞察、競合、COVID-19の影響と予測(2023年~2028年)Global Affinity Ligands Market (2023 Edition) - Analysis By Type (Antibodies, Ig Binding Proteins, Lectins, Enzymes, Others), End Use, By Region, By Country: Market Size, Insights, Competition, Covid-19 Impact and Forecast (2023-2028) |
||||||
|
|
|||||||


| アフィニティリガンドの世界市場(2023年)- タイプ別、最終用途別、地域別、国別の分析:市場規模、洞察、競合、COVID-19の影響と予測(2023年~2028年) |
|
出版日: 2023年02月28日
発行: Azoth Analytics
ページ情報: 英文 219 Pages
納期: 即納可能
|
- 全表示
- 概要
- 図表
- 目次
世界のアフィニティリガンドの市場は、2021年に1,708億米ドルとなりました。同市場は、2023年~2028年の間に11.15%のCAGRで拡大すると予測されています。
当レポートでは、世界のアフィニティリガンド市場について調査し、市場の概要とともに、タイプ別、最終用途別、地域別の動向、および市場に参入する企業のプロファイルなどを提供しています。
目次
第1章 市場の背景
第2章 戦略的推奨事項
第3章 世界のアフィニティリガンド市場:実績および予測(2018年~2028年)
- アフィニティリガンド市場に対するマクロ経済要因の影響分析
- 世界のアフィニティリガンド市場:エコシステム分析
- 世界のアフィニティリガンド市場:ダッシュボード
- 世界のアフィニティリガンド市場:市場規模とCAGR、2018年~2028年年(10億米ドルとCAGR)
- アフィニティリガンド市場に対するCOVID-19の影響
- 世界のアフィニティリガンド市場セグメンテーション:最終用途別
- 世界のアフィニティリガンド市場、最終用途別の概要
- 治療
- 診断
- 研究ツール
- 世界のアフィニティリガンド市場セグメンテーション:タイプ別
- 世界のアフィニティリガンド市場、タイプ別概要
- 抗体
- Ig結合タンパク質
- レクチン
- 酵素
- その他
第4章 世界のアフィニティリガンド市場、地域分析
- 調査対象地域
- 地域別スナップショット
第5章 南北アメリカのアフィニティリガンド市場:実績および予測(2018年~2028年)
第6章 欧州のアフィニティリガンド市場:実績および予測(2018年~2028年)
第7章 アジア太平洋のアフィニティリガンド市場:実績および予測(2018年~2028年)
第8章 中東・アフリカのアフィニティリガンド市場:実績および予測(2018年~2028年)
第9章 市場力学
第10章 産業エコシステム分析
第11章 競争上の位置付け
- 企業の製品ポジショニング
- 市場における位置づけマトリクス
- アフィニティリガンド市場の市場シェア分析
- 企業プロファイル
- Repligen Corp
- Aptamer Group
- Abcam Group
- Thermo Fisher Scientific
- Merck KGaA
- Kaneka Corporation
- Proteintech
- EpigenTek
- Santa Cruz Biotechnology Inc.
- AMS Biotechnology Europe Ltd
List of Figures
List of Figures
- Figure 1: Global Affinity Ligands Market Size, By Value, 2018-2021 (USD Billion)
- Figure 2: Global Affinity Ligands Market Size, By Value, 2022-2028 (USD Billion)
- Figure 3: Global Affinity Ligands Market Share, By End Uses, 2021 (%)
- Figure 4: Global Affinity Ligands Market Size, By Therapeutics, By Value, 2018H-2028F (USD Billion & CAGR)
- Figure 5: Global Affinity Ligands Market Absolute Opportunity, By Therapeutics, 2018-2028 (USD Billion)
- Figure 6: Global Affinity Ligands Market Size, By Diagnostics, By Value, 2018H-2028F (USD Billion & CAGR)
- Figure 7: Global Affinity Ligands Market Absolute Opportunity, By Diagnostics, 2018-2028 (USD Billion)
- Figure 8: Global Affinity Ligands Market Size, By Research Tools, By Value, 2018H-2028F (USD Billion & CAGR)
- Figure 9: Global Affinity Ligands Market Absolute Opportunity, By Research Tools, 2018-2028 (USD Billion)
- Figure 10: Global Affinity Ligands Market Size, By Antibodies, By Value, 2018H-2028F (USD Billion & CAGR)
- Figure 11: Global Affinity Ligands Market Absolute Opportunity, By Antibodies, 2018-2028 (USD Billion)
- Figure 12: Global Affinity Ligands Market Size, By Ig Binding Proteins, By Value, 2018H-2028F (USD Billion & CAGR)
- Figure 13: Global Affinity Ligands Market Absolute Opportunity, By Ig Binding Proteins, 2018-2028 (USD Billion)
- Figure 14: Global Affinity Ligands Market Size, By Lectins, By Value, 2018H-2028F (USD Billion & CAGR)
- Figure 15: Global Affinity Ligands Market Absolute Opportunity, By Lectins, 2018-2028 (USD Billion)
- Figure 16: Global Affinity Ligands Market Size, By Enzymes, By Value, 2018H-2028F (USD Billion & CAGR)
- Figure 17: Global Affinity Ligands Market Absolute Opportunity, By Enzymes, 2018-2028 (USD Billion)
- Figure 18: Global Affinity Ligands Market Size, By Other Types, By Value, 2018H-2028F (USD Billion & CAGR)
- Figure 19: Global Affinity Ligands Market Absolute Opportunity, By Other Types, 2018-2028 (USD Billion)
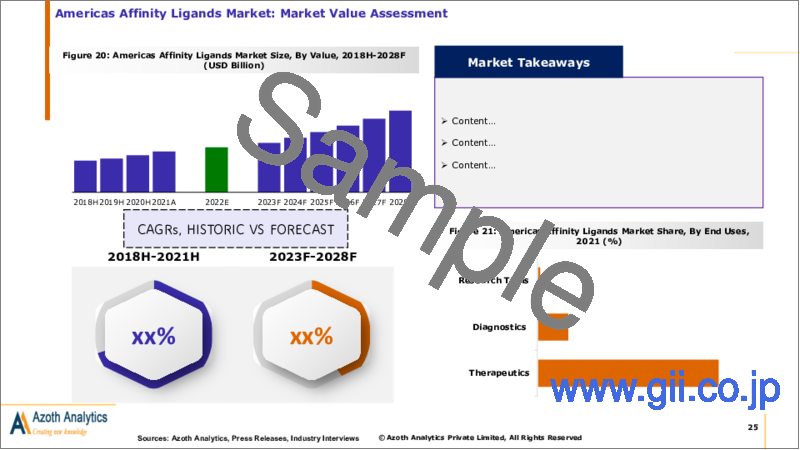
- Figure 20: Americas Affinity Ligands Market Size, By Value, 2018H-2028F (USD Billion)
- Figure 21: Americas Affinity Ligands Market Share, By End Uses, 2021 (%)
- Figure 22: Americas Affinity Ligands Market, By Therapeutics, By Value, 2018H-2028F (USD Billion & CAGR)
- Figure 23: Americas Affinity Ligands Market, By Diagnostics, By Value, 2018H-2028F (USD Billion & CAGR)
- Figure 24: Americas Affinity Ligands Market, By Research Tools, By Value, 2018H-2028F (USD Billion & CAGR)
- Figure 25: Americas Affinity Ligands Market, By Antibodies, By Value, 2018H-2028F (USD Billion & CAGR)
- Figure 26: Americas Affinity Ligands Market, By Ig Binding Proteins, By Value, 2018H-2028F (USD Billion & CAGR)
- Figure 27: Americas Affinity Ligands Market, By Lectins, By Value, 2018H-2028F (USD Billion & CAGR)
- Figure 28: Americas Affinity Ligands Market, By Enzymes, By Value, 2018H-2028F (USD Billion & CAGR)
- Figure 29: Americas Affinity Ligands Market, By Other Types, By Value, 2018H-2028F (USD Billion & CAGR)
- Figure 30: United States Affinity Ligands Market, By Value, 2018-2028 (USD Billion & CAGR)
- Figure 31: United States Affinity Ligands Market Value, By End Uses, 2021 (USD Billion)
- Figure 32: United States Affinity Ligands Market Share, By End Uses, By Value, 2021 (%)
- Figure 33: United States Affinity Ligands Market Share, By Type, By Value, 2021 (%)
- Figure 34: Canada Affinity Ligands Market, By Value, 2018-2028 (USD Billion & CAGR)
- Figure 35: Canada Affinity Ligands Market Value, By End Uses, 2021 (USD Billion)
- Figure 36: Canada Affinity Ligands Market Share, By End Uses, By Value, 2021 (%)
- Figure 37: Canada Affinity Ligands Market Share, By Type, By Value, 2021 (%)
- Figure 38: Rest of Americas Affinity Ligands Market, By Value, 2018-2028 (USD Billion & CAGR)
- Figure 39: Rest of Americas Affinity Ligands Market Value, By End Uses, 2021 (USD Billion)
- Figure 40: Rest of Americas Affinity Ligands Market Share, By End Uses, By Value, 2021 (%)
- Figure 41: Rest of Americas Affinity Ligands Market Share, By Type, By Value, 2021 (%)
- Figure 42: Europe Affinity Ligands Market Size, By Value, 2018H-2028F (USD Billion)
- Figure 43: Europe Affinity Ligands Market Share, By End Uses, 2021 (%)
- Figure 44: Europe Affinity Ligands Market, By Therapeutics, By Value, 2018H-2028F (USD Billion & CAGR)
- Figure 45: Europe Affinity Ligands Market, By Diagnostics, By Value, 2018H-2028F (USD Billion & CAGR)
- Figure 46: Europe Affinity Ligands Market, By Research Tools, By Value, 2018H-2028F (USD Billion & CAGR)
- Figure 47: Europe Affinity Ligands Market, By Antibodies, By Value, 2018H-2028F (USD Billion & CAGR)
- Figure 48: Europe Affinity Ligands Market, By Ig Binding Proteins, By Value, 2018H-2028F (USD Billion & CAGR)
- Figure 49: Europe Affinity Ligands Market, By Lectins, By Value, 2018H-2028F (USD Billion & CAGR)
- Figure 50: Europe Affinity Ligands Market, By Enzymes, By Value, 2018H-2028F (USD Billion & CAGR)
- Figure 51: Europe Affinity Ligands Market, By Other Types, By Value, 2018H-2028F (USD Billion & CAGR)
- Figure 52: Germany Affinity Ligands Market, By Value, 2018-2028 (USD Billion & CAGR)
- Figure 53: Germany Affinity Ligands Market Value, By End Uses, 2021 (USD Billion)
- Figure 54: Germany Affinity Ligands Market Share, By End Uses, By Value, 2021 (%)
- Figure 55: Germany Affinity Ligands Market Share, By Type, By Value, 2021 (%)
- Figure 56: United Kingdom Affinity Ligands Market, By Value, 2018-2028 (USD Billion & CAGR)
- Figure 57: United Kingdom Affinity Ligands Market Value, By End Uses, 2021 (USD Billion)
- Figure 58: United Kingdom Affinity Ligands Market Share, By End Uses, By Value, 2021 (%)
- Figure 59: United Kingdom Affinity Ligands Market Share, By Type, By Value, 2021 (%)
- Figure 60: France Affinity Ligands Market, By Value, 2018-2028 (USD Billion & CAGR)
- Figure 61: France Affinity Ligands Market Value, By End Uses, 2021 (USD Billion)
- Figure 62: France Affinity Ligands Market Share, By End Uses, By Value, 2021 (%)
- Figure 63: France Affinity Ligands Market Share, By Type, By Value, 2021 (%)
- Figure 64: Italy Affinity Ligands Market, By Value, 2018-2028 (USD Billion & CAGR)
- Figure 65: Italy Affinity Ligands Market Value, By End Uses, 2021 (USD Billion)
- Figure 66: Italy Affinity Ligands Market Share, By End Uses, By Value, 2021 (%)
- Figure 67: Italy Affinity Ligands Market Share, By Type, By Value, 2021 (%)
- Figure 68: Rest of Europe Affinity Ligands Market, By Value, 2018-2028 (USD Billion & CAGR)
- Figure 69: Rest of Europe Affinity Ligands Market Value, By End Uses, 2021 (USD Billion)
- Figure 70: Rest of Europe Affinity Ligands Market Share, By End Uses, By Value, 2021 (%)
- Figure 71: Rest of Europe Affinity Ligands Market Share, By Type, By Value, 2021 (%)
- Figure 72: Asia Pacific Affinity Ligands Market Size, By Value, 2018H-2028F (USD Billion)
- Figure 73: Asia Pacific Affinity Ligands Market Share, By End Uses, 2021 (%)
- Figure 74: Asia Pacific Affinity Ligands Market, By Therapeutics, By Value, 2018H-2028F (USD Billion & CAGR)
- Figure 75: Asia Pacific Affinity Ligands Market, By Diagnostics, By Value, 2018H-2028F (USD Billion & CAGR)
- Figure 76: Asia Pacific Affinity Ligands Market, By Research Tools, By Value, 2018H-2028F (USD Billion & CAGR)
- Figure 77: Asia Pacific Affinity Ligands Market, By Antibodies, By Value, 2018H-2028F (USD Billion & CAGR)
- Figure 78: Asia Pacific Affinity Ligands Market, By Ig Binding Proteins, By Value, 2018H-2028F (USD Billion & CAGR)
- Figure 79: Asia Pacific Affinity Ligands Market, By Lectins, By Value, 2018H-2028F (USD Billion & CAGR)
- Figure 80: Asia Pacific Affinity Ligands Market, By Enzymes, By Value, 2018H-2028F (USD Billion & CAGR)
- Figure 81: Asia Pacific Affinity Ligands Market, By Other Types, By Value, 2018H-2028F (USD Billion & CAGR)
- Figure 82: China Affinity Ligands Market, By Value, 2018-2028 (USD Billion & CAGR)
- Figure 83: China Affinity Ligands Market Value, By End Uses, 2021 (USD Billion)
- Figure 84: China Affinity Ligands Market Share, By End Uses, By Value, 2021 (%)
- Figure 85: China Affinity Ligands Market Share, By Type, By Value, 2021 (%)
- Figure 86: Japan Affinity Ligands Market, By Value, 2018-2028 (USD Billion & CAGR)
- Figure 87: Japan Affinity Ligands Market Value, By End Uses, 2021 (USD Billion)
- Figure 88: Japan Affinity Ligands Market Share, By End Uses, By Value, 2021 (%)
- Figure 89: Japan Affinity Ligands Market Share, By Type, By Value, 2021 (%)
- Figure 90: South Korea Affinity Ligands Market, By Value, 2018-2028 (USD Billion & CAGR)
- Figure 91: South Korea Affinity Ligands Market Value, By End Uses, 2021 (USD Billion)
- Figure 92: South Korea Affinity Ligands Market Share, By End Uses, By Value, 2021 (%)
- Figure 93: South Korea Affinity Ligands Market Share, By Type, By Value, 2021 (%)
- Figure 94: India Affinity Ligands Market, By Value, 2018-2028 (USD Billion & CAGR)
- Figure 95: India Affinity Ligands Market Value, By End Uses, 2021 (USD Billion)
- Figure 96: India Affinity Ligands Market Share, By End Uses, By Value, 2021 (%)
- Figure 97: India Affinity Ligands Market Share, By Type, By Value, 2021 (%)
- Figure 98: Rest of APAC Affinity Ligands Market, By Value, 2018-2028 (USD Billion & CAGR)
- Figure 99: Rest of APAC Affinity Ligands Market Value, By End Uses, 2021 (USD Billion)
- Figure 100: Rest of APAC Affinity Ligands Market Share, By End Uses, By Value, 2021 (%)
- Figure 101: Rest of APAC Affinity Ligands Market Share, By Type, By Value, 2021 (%)
- Figure 102: Middle East & Africa Affinity Ligands Market Size, By Value, 2018H-2028F (USD Billion)
- Figure 103: Middle East & Africa Affinity Ligands Market Share, By End Uses, 2021 (%)
- Figure 104: Middle East and Africa Affinity Ligands Market, By Therapeutics, By Value, 2018H-2028F (USD Billion & CAGR)
- Figure 105: Middle East and Africa Affinity Ligands Market, By Diagnostics, By Value, 2018H-2028F (USD Billion & CAGR)
- Figure 106: Middle East and Africa Affinity Ligands Market, By Research Tools, By Value, 2018H-2028F (USD Billion & CAGR)
- Figure 107: Middle East and Africa Affinity Ligands Market, By Antibodies, By Value, 2018H-2028F (USD Billion & CAGR)
- Figure 108: Middle East and Africa Affinity Ligands Market, By Ig Binding Proteins, By Value, 2018H-2028F (USD Billion & CAGR)
- Figure 109: Middle East and Africa Affinity Ligands Market, By Lectins, By Value, 2018H-2028F (USD Billion & CAGR)
- Figure 110: Middle East and Africa Affinity Ligands Market, By Enzymes, By Value, 2018H-2028F (USD Billion & CAGR)
- Figure 111: Middle East and Africa Affinity Ligands Market, By Other Types, By Value, 2018H-2028F (USD Billion & CAGR)
- Figure 112: Global Impact of Drivers and Restraints
- Figure 113: Market Share of Prominent Companies of Affinity Ligands, 2021 (%)
- Figure 114: Repligen, 2019-2021 (USD Million)
- Figure 115: Repligen Corp. Revenue , By Business Segments, 2021 (%)
- Figure 116: Repligen Corp. By Geographical Segments, 2021 (%)
- Figure 117: Aptamer Group, 2021-2022 (USD Million)
- Figure 118: Aptamer Group Revenue , By Geographical Segments, 2022 (%)
- Figure 119: Abcam Group, 2019-2021 (USD Million)
- Figure 120: Abcam Group Revenue , By Geographical Segments, 2021 (%)
- Figure 121: Thermo Fisher Revenues, 2019-2021 (USD Million)
- Figure 122: Thermo Fisher Revenue , By Geographic segment, 2021 (%)
- Figure 123: Thermo Fisher Revenue , By Business Segments, 2021 (%)
- Figure 124: Merck KGaA Group Revenues, 2019-2021 (USD Million)
- Figure 125: Merck KGaA Revenue , By Geographical Segments, 2021 (%)
- Figure 126: Merck KGaA Revenue , By Geographical Segments, 2021 (%)
- Figure 127: Kaneka Corporation Revenues, 2019-2021 (USD Million)
- Figure 128: Kaneka Corporation Revenue , By Product Segment, 2021 (%)
- Figure 129: Kaneka Corporation Revenue , By Geographical Segments, 2021 (%)
List of Tables
Table A1: Global Impact of Macro Economic Factors, By Region
Table A2: Major types of ligands and their Target Molecule
Table A3: Major types of Lectin Affinity ligands and their Properties
Table A4: Examples of some Affinity Ligand companies and their core technologies
Table A5: United States Affinity Ligands Market, By End Uses, By Value, 2018-2021 (USD Billion)
Table A6: United States Affinity Ligands Market, By End Uses, By Value, 2022-2028 (USD Billion)
Table A7: United States Affinity Ligands Market, By Type, By Value, 2018-2021 (USD Billion)
Table A8: United States Affinity Ligands Market, By Type, By Value, 2022-2028 (USD Billion)
Table A9: Canada Affinity Ligands Market, By End Uses, By Value, 2018-2021 (USD Billion)
Table A10: Canada Affinity Ligands Market, By End Uses, By Value, 2022-2028 (USD Billion)
Table A11: Canada Affinity Ligands Market, By Type, By Value, 2018-2021 (USD Billion)
Table A12: Canada Affinity Ligands Market, By Type, By Value, 2022-2028 (USD Billion)
Table A13: Rest of Americas Affinity Ligands Market, By End Uses, By Value, 2018-2021 (USD Billion)
Table A14: Rest of Americas Affinity Ligands Market, By End Uses, By Value, 2022-2028 (USD Billion)
Table A15: Rest of Americas Affinity Ligands Market, By Type, By Value, 2018-2021 (USD Billion)
Table A16: Rest of Americas Affinity Ligands Market, By Type, By Value, 2022-2028 (USD Billion)
Table A17: Germany Affinity Ligands Market, By End Uses, By Value, 2018-2021 (USD Billion)
Table A18: Germany Affinity Ligands Market, By End Uses, By Value, 2022-2028 (USD Billion)
Table A19: Germany Affinity Ligands Market, By Type, By Value, 2018-2021 (USD Billion)
Table A20: Germany Affinity Ligands Market, By Type, By Value, 2022-2028 (USD Billion)
Table A21: United Kingdom Affinity Ligands Market, By End Uses, By Value, 2018-2021 (USD Billion)
Table A22: United Kingdom Affinity Ligands Market, By End Uses, By Value, 2022-2028 (USD Billion)
Table A23: United Kingdom Affinity Ligands Market, By Type, By Value, 2018-2021 (USD Billion)
Table A24: United Kingdom Affinity Ligands Market, By Type, By Value, 2022-2028 (USD Billion)
Table A25: France Affinity Ligands Market, By End Uses, By Value, 2018-2021 (USD Billion)
Table A26: France Affinity Ligands Market, By End Uses, By Value, 2022-2028 (USD Billion)
Table A27: France Affinity Ligands Market, By Type, By Value, 2018-2021 (USD Billion)
Table A28: France Affinity Ligands Market, By Type, By Value, 2022-2028 (USD Billion)
Table A29: Italy Affinity Ligands Market, By End Uses, By Value, 2018-2021 (USD Billion)
Table A30: Italy Affinity Ligands Market, By End Uses, By Value, 2022-2028 (USD Billion)
Table A31: Italy Affinity Ligands Market, By Type, By Value, 2018-2021 (USD Billion)
Table A32: Italy Affinity Ligands Market, By Type, By Value, 2022-2028 (USD Billion)
Table A33: Rest of Europe Affinity Ligands Market, By End Uses, By Value, 2018-2021 (USD Billion)
Table A34: Rest of Europe Affinity Ligands Market, By End Uses, By Value, 2022-2028 (USD Billion)
Table A35: Rest of Europe Affinity Ligands Market, By Type, By Value, 2018-2021 (USD Billion)
Table A36: Rest of Europe Affinity Ligands Market, By Type, By Value, 2022-2028 (USD Billion)
Table A37: China Affinity Ligands Market, By End Uses, By Value, 2018-2021 (USD Billion)
Table A38: China Affinity Ligands Market, By End Uses, By Value, 2022-2028 (USD Billion)
Table A39: China Affinity Ligands Market, By Type, By Value, 2018-2021 (USD Billion)
Table A40: China Affinity Ligands Market, By Type, By Value, 2022-2028 (USD Billion)
Table A41: Japan Affinity Ligands Market, By End Uses, By Value, 2018-2021 (USD Billion)
Table A42: Japan Affinity Ligands Market, By End Uses, By Value, 2022-2028 (USD Billion)
Table A43: Japan Affinity Ligands Market, By Type, By Value, 2018-2021 (USD Billion)
Table A44: Japan Affinity Ligands Market, By Type, By Value, 2022-2028 (USD Billion)
Table A45: South Korea Affinity Ligands Market, By End Uses, By Value, 2018-2021 (USD Billion)
Table A46: South Korea Affinity Ligands Market, By End Uses, By Value, 2022-2028 (USD Billion)
Table A47: South Korea Affinity Ligands Market, By Type, By Value, 2018-2021 (USD Billion)
Table A48: South Korea Affinity Ligands Market, By Type, By Value, 2022-2028 (USD Billion)
Table A49: India Affinity Ligands Market, By End Uses, By Value, 2018-2021 (USD Billion)
Table A50: India Affinity Ligands Market, By End Uses, By Value, 2022-2028 (USD Billion)
Table A51: India Affinity Ligands Market, By Type, By Value, 2018-2021 (USD Billion)
Table A52: India Affinity Ligands Market, By Type, By Value, 2022-2028 (USD Billion)
Table A53: Rest of APAC Affinity Ligands Market, By End Uses, By Value, 2018-2021 (USD Billion)
Table A54: Rest of APAC Affinity Ligands Market, By End Uses, By Value, 2022-2028 (USD Billion)
Table A55: Rest of APAC Affinity Ligands Market, By Type, By Value, 2018-2021 (USD Billion)
Table A56: Rest of APAC Affinity Ligands Market, By Type, By Value, 2022-2028 (USD Billion)
Table A57: Repligen Corp Key Financials, 2019-2021
Table A58: Aptamer Key Financials, 2019-2021
Table A59: Abcam Key Financials, 2019-2021
Table A60: Thermo Fisher Scientific Key Financials, 2019-2021
Table A61: Merck KGaA Key Financials, 2019-2021
Table A62: Kaneka Corporation Key Financials, 2019-2021
Executive Summary
The global Affinity Ligands market was valued at USD 170.8 billion in 2021 and is anticipated to expand at a CAGR of 11.15% between 2023 and 2028. The rising demand for affinity ligands in several applications, including protein purification, drug development, and diagnostic testing, is driving up demand for Affinity Ligands.
Antibodies were the first (and continue to be the most popular) affinity ligand technology, and they are used in a variety of applications such as manufacturing solutions, research techniques, diagnostics, and therapeutic approaches. Antibodies account for 60.75% of the overall market share by type segment in 2021.
Demand for innovative affinity ligands such as aptamers is also being driven by the development of affinity ligands with increased binding affinity, simpler manufacturing processes, and cheaper production costs.
The most prominent use of Affinity Ligand is affinity chromatography, which is a separation process based upon a particular interaction between the analyte of interest and a ligand that is covalently attached to a resin. It is a simple, rapid, selective, and efficient protein purification method that can purify tens of thousands of folds in a single step.
The Americas Region acquires a majority share of the affinity ligands market in 2021 due to robust R&D investment and the presence of top life science enterprises in the region.
Scope of the Report
- The report analyses the Affinity Ligands Market by Value (USD Billion).
- The report presents the analysis of the Affinity Ligands market for the historical period of 2018-2021, the base year 2022 and the forecast period of 2023-2028.
- The report analyses the Affinity Ligands Market By Type (Antibodies, Ig Binding Proteins, Lectins, Enzymes, Other Types)
- The report analyses the Affinity Ligands Market By End Use (Therapeutics, Diagnostics, Research Tools)
- The Global Affinity Ligands Market has been analysed by countries (United States, Canada, Germany, UK, France, Italy, China, Japan, South Korea, India)
- The key insights of the report have been presented through the frameworks of SWOT and Porter's Five Forces Analysis. Also, the attractiveness of the market has been presented by region, By type and End Use
- Also, the major opportunities, trends, drivers and challenges of the industry has been analysed in the report.
- The report tracks competitive developments, strategies, mergers and acquisitions and new product development. The companies profiled in the report include Repligen Corp., Aptamer Group, Abcam Group, Thermo Fisher Scientific, Merck KGaA, Kaneka Corporation, Proteintech, EpigenTek, Santa Cruz Biotechnology Inc., and AMS Biotechnology Europe Ltd.
Key Target Audience
- Academic Institutions
- Leading Affinity Ligands Brands
- Research & Development Organizations
- Pharmaceutical Companies
- Biotechnology Companies
Table of Contents
1. Market Background
- 1.1 Scope and Product Outlook
- 1.2 Executive Summary
- 1.3 Research Methodology
2. Strategic Recommendations
3. Global Affinity Ligands Market: Historic and Forecast (2018-2028)
- 3.1 Impact Analysis of Macro Economic Factors on Affinity Ligands Market
- 3.2 Global Affinity Ligands Market: Ecosystem Analysis
- 3.2.1 Affinity Ligands Positioning and Target Molecule
- 3.2.2 Lectin affinity Ligands: Properties and Sources
- 3.2.3 Technology matrix of key Affinity Ligand Companies
- 3.3 Global Affinity Ligands Market: Dashboard
- 3.4 Global Affinity Ligands Market: Market Size and CAGR, 2018-2028 (USD Billion & CAGR)
- 3.5 Impact of COVID-19 on the Affinity Ligands Market
- 3.6 Global Affinity Ligands Market Segmentation: By End Uses
- 3.6.1 Global Affinity Ligands Market, By End Uses Overview
- 3.6.2 Global Affinity Ligands Market Size, By Therapeutics, By Value, 2018H-2028F (USD Billion & CAGR)
- 3.6.3 Global Affinity Ligands Market Size, By Diagnostics, By Value, 2018H-2028F (USD Billion & CAGR)
- 3.6.4 Global Affinity Ligands Market Size, By Research Tools, By Value, 2018H-2028F (USD Billion & CAGR)
- 3.7 Global Affinity Ligands Market Segmentation: By Type
- 3.7.1 Global Affinity Ligands Market, By Type Overview
- 3.7.2 Global Affinity Ligands Market Size, By Antibodies, By Value, 2018H-2028F (USD Billion & CAGR)
- 3.7.3 Global Affinity Ligands Market Size, By Ig Binding Proteins, By Value, 2018H-2028F (USD Billion & CAGR)
- 3.7.4 Global Affinity Ligands Market Size, By Lectins, By Value, 2018H-2028F (USD Billion & CAGR)
- 3.7.5 Global Affinity Ligands Market Size, By Enzymes, By Value, 2018H-2028F (USD Billion & CAGR)
- 3.7.6 Global Affinity Ligands Market Size, By Other Types, By Value, 2018H-2028F (USD Billion & CAGR)
4. Global Affinity Ligands Market, Region Analysis
- 4.1 Regional Coverage of the Study
- 4.2 Regional Snapshot
5. Americas Affinity Ligands Market: Historic and Forecast (2018-2028)
- 5.1 Americas Affinity Ligands Market: Snapshot
- 5.2 Americas Affinity Ligands Market: Market Size and CAGR, 2018-2028 (USD Billion & CAGR)
- 5.3 Americas Affinity Ligands Market: Key Factors
- 5.4 Americas Affinity Ligands Market Segmentation: By End Uses
- 5.4.1 Americas Affinity Ligands Market, By End Uses Overview
- 5.4.2 Americas Affinity Ligands Market Size, By Therapeutics, By Value, 2018H-2028F (USD Billion & CAGR)
- 5.4.3 Americas Affinity Ligands Market Size, By Diagnostics, By Value, 2018H-2028F (USD Billion & CAGR)
- 5.4.4 Americas Affinity Ligands Market Size, By Research Tools, By Value, 2018H-2028F (USD Billion & CAGR)
- 5.5 Americas Affinity Ligands Market Segmentation: By Type
- 5.5.1 Americas Affinity Ligands Market, By Type Overview
- 5.5.2 Americas Affinity Ligands Market Size, By Antibodies, By Value, 2018H-2028F (USD Billion & CAGR)
- 5.5.3 Americas Affinity Ligands Market Size, By Ig Binding Proteins, By Value, 2018H-2028F (USD Billion & CAGR)
- 5.5.4 Americas Affinity Ligands Market Size, By Lectins, By Value, 2018H-2028F (USD Billion & CAGR)
- 5.5.5 Americas Affinity Ligands Market Size, By Enzymes, By Value, 2018H-2028F (USD Billion & CAGR)
- 5.5.6 Americas Affinity Ligands Market Size, By Other Types, By Value, 2018H-2028F (USD Billion & CAGR)
- 5.6 Americas Affinity Ligands Market Segmentation: By Country
- 5.6.1 Americas Affinity Ligands Market Segmentation, By Country Overview
- 5.6.2 United States Affinity Ligands Market: Market Size and CAGR, 2018-2028 (USD Billion & CAGR)
- 5.6.2.1 United States Affinity Ligands Market, By End Uses
- 5.6.2.2 United States Affinity Ligands Market, By Type
- 5.6.3 Canada Affinity Ligands Market: Market Size and CAGR, 2018-2028 (USD Billion & CAGR)
- 5.6.3.1 Canada Affinity Ligands Market, By End Uses
- 5.6.3.2 Canada Affinity Ligands Market, By Type
- 5.6.4 Rest of Americas Affinity Ligands Market: Market Size and CAGR, 2018-2028 (USD Billion & CAGR)
- 5.6.4.1 Rest of Americas Affinity Ligands Market, By End Uses
- 5.6.4.2 Rest of Americas Affinity Ligands Market, By Type
6. Europe Affinity Ligands Market: Historic and Forecast (2018-2028)
- 6.1 Europe Affinity Ligands Market: Snapshot
- 6.2 Europe Affinity Ligands Market: Market Size and CAGR, 2018-2028 (USD Billion & CAGR)
- 6.3 Europe Affinity Ligands Market: Key Factors
- 6.4 Europe Affinity Ligands Market Segmentation: By End Uses
- 6.4.1 Europe Affinity Ligands Market, By End Uses Overview
- 6.4.2 Europe Affinity Ligands Market Size, By Therapeutics, By Value, 2018H-2028F (USD Billion & CAGR)
- 6.4.3 Europe Affinity Ligands Market Size, By Diagnostics, By Value, 2018H-2028F (USD Billion & CAGR)
- 6.4.4 Europe Affinity Ligands Market Size, By Research Tools, By Value, 2018H-2028F (USD Billion & CAGR)
- 6.5 Europe Affinity Ligands Market Segmentation: By Type
- 6.5.1 Europe Affinity Ligands Market, By Type Overview
- 6.5.2 Europe Affinity Ligands Market Size, By Antibodies, By Value, 2018H-2028F (USD Billion & CAGR)
- 6.5.3 Europe Affinity Ligands Market Size, By Ig Binding Proteins, By Value, 2018H-2028F (USD Billion & CAGR)
- 6.5.4 Europe Affinity Ligands Market Size, By Lectins, By Value, 2018H-2028F (USD Billion & CAGR)
- 6.5.5 Europe Affinity Ligands Market Size, By Enzymes, By Value, 2018H-2028F (USD Billion & CAGR)
- 6.5.6 Europe Affinity Ligands Market Size, By Other Types, By Value, 2018H-2028F (USD Billion & CAGR)
- 6.6 Europe Affinity Ligands Market Segmentation: By Country
- 6.6.1 Europe Affinity Ligands Market Segmentation, By Country, Overview
- 6.6.2 Germany Affinity Ligands Market: Market Size and CAGR, 2018-2028 (USD Billion & CAGR)
- 6.6.2.1 Germany Affinity Ligands Market, By End Uses
- 6.6.2.2 Germany Affinity Ligands Market, By Type
- 6.6.3 United Kingdom Affinity Ligands Market: Market Size and CAGR, 2018-2028 (USD Billion & CAGR)
- 6.6.3.1 United Kingdom Affinity Ligands Market, By End Uses
- 6.6.3.2 United Kingdom Affinity Ligands Market, By Type
- 6.6.4 France Affinity Ligands Market: Market Size and CAGR, 2018-2028 (USD Billion & CAGR)
- 6.6.4.1 France Affinity Ligands Market, By End Uses
- 6.6.4.2 France Affinity Ligands Market, By Type
- 6.6.5 Italy Affinity Ligands Market: Market Size and CAGR, 2018-2028 (USD Billion & CAGR)
- 6.6.5.1 Italy Affinity Ligands Market, By End Uses
- 6.6.5.2 Italy Affinity Ligands Market, By Type
- 6.6.6 Rest of Europe Affinity Ligands Market: Market Size and CAGR, 2018-2028 (USD Billion & CAGR)
- 6.6.6.1 Rest of Europe Affinity Ligands Market, By End Uses
- 6.6.6.2 Rest of Europe Affinity Ligands Market, By Type
7. Asia Pacific Affinity Ligands Market: Historic and Forecast (2018-2028)
- 7.1 Asia Pacific Affinity Ligands Market: Snapshot
- 7.2 Asia Pacific Affinity Ligands Market: Market Size and CAGR, 2018-2028 (USD Billion & CAGR)
- 7.3 Asia Pacific Affinity Ligands Market: Key Factors
- 7.4 Asia Pacific Affinity Ligands Market Segmentation: By End Uses
- 7.4.1 Asia Pacific Affinity Ligands Market, By End Uses Overview
- 7.4.2 Asia Pacific Affinity Ligands Market Size, By Therapeutics, By Value, 2018H-2028F (USD Billion & CAGR)
- 7.4.3 Asia Pacific Affinity Ligands Market Size, By Diagnostics, By Value, 2018H-2028F (USD Billion & CAGR)
- 7.4.4 Asia Pacific Affinity Ligands Market Size, By Research Tools, By Value, 2018H-2028F (USD Billion & CAGR)
- 7.5 Asia Pacific Affinity Ligands Market Segmentation: By Type
- 7.5.1 Asia-pacific affinity ligands market, by Type overview
- 7.5.2 Asia Pacific Affinity Ligands Market Size, By Antibodies, By Value, 2018H-2028F (USD Billion & CAGR)
- 7.5.3 Asia Pacific Affinity Ligands Market Size, By Ig Binding Proteins, By Value, 2018H-2028F (USD Billion & CAGR)
- 7.5.4 Asia Pacific Affinity Ligands Market Size, By Lectins, By Value, 2018H-2028F (USD Billion & CAGR)
- 7.5.5 Asia Pacific Affinity Ligands Market Size, By Enzymes, By Value, 2018H-2028F (USD Billion & CAGR)
- 7.5.6 Asia Pacific Affinity Ligands Market Size, By Other Types, By Value, 2018H-2028F (USD Billion & CAGR)
- 7.6 Asia Pacific Affinity Ligands Market Segmentation: By Country
- 7.6.1 Asia Pacific Affinity Ligands Market, By Country Overview
- 7.6.2 China Affinity Ligands Market: Market Size and CAGR, 2018-2028 (USD Billion & CAGR)
- 7.6.2.1 China Affinity Ligands Market, By End Uses
- 7.6.2.2 China Affinity Ligands Market, By Type
- 7.6.3 Japan Affinity Ligands Market: Market Size and CAGR, 2018-2028 (USD Billion & CAGR)
- 7.6.3.1 Japan Affinity Ligands Market, By End Uses
- 7.6.3.2 Japan Affinity Ligands Market, By Type
- 7.6.4 South Korea Affinity Ligands Market: Market Size and CAGR, 2018-2028 (USD Billion & CAGR)
- 7.6.4.1 South Korea Affinity Ligands Market, By End Uses
- 7.6.4.2 South Korea Affinity Ligands Market, By Type
- 7.6.5 India Affinity Ligands Market: Market Size and CAGR, 2018-2028 (USD Billion & CAGR)
- 7.6.5.1 India Affinity Ligands Market, By End Uses
- 7.6.5.2 India Affinity Ligands Market, By Type
- 7.6.6 Rest Of Asia Pacific Affinity Ligands Market: Market Size and CAGR, 2018-2028 (USD Billion & CAGR)
- 7.6.6.1 Rest Of Asia Pacific Affinity Ligands Market, By End Uses
- 7.6.6.2 Rest Of Asia Pacific Affinity Ligands Market, By Type
8. Middle East & Africa Affinity Ligands Market: Historic and Forecast (2018-2028)
- 8.1 Middle East & Africa Affinity Ligands Market: Snapshot
- 8.2 Middle East & Africa Affinity Ligands Market: Market Size and CAGR, 2018-2028 (USD Billion & CAGR)
- 8.3 Middle East & Africa Affinity Ligands Market: Key Factors
- 8.4 Middle East & Africa Affinity Ligands Market Segmentation: By End Uses
- 8.4.1 Middle East & Africa Affinity Ligands Market, By End Uses Overview
- 8.4.2 Middle East & Africa Affinity Ligands Market Size, By Therapeutics, By Value, 2018H-2028F (USD Billion & CAGR)
- 8.4.3 Middle East & Africa Affinity Ligands Market Size, By Diagnostics, By Value, 2018H-2028F (USD Billion & CAGR)
- 8.4.4 Middle East & Africa Affinity Ligands Market Size, By Research Tools, By Value, 2018H-2028F (USD Billion & CAGR)
- 8.5 Middle East & Africa Affinity Ligands Market Segmentation: By Type
- 8.5.1 Middle East & Africa Affinity Ligands Market, By Type Overview
- 8.5.2 Middle East & Africa Affinity Ligands Market Size, By Antibodies, By Value, 2018H-2028F (USD Billion & CAGR)
- 8.5.3 Middle East & Africa Affinity Ligands Market Size, By Ig Binding Proteins, By Value, 2018H-2028F (USD Billion & CAGR)
- 8.5.4 Middle East & Africa Affinity Ligands Market Size, By Lectins, By Value, 2018H-2028F (USD Billion & CAGR)
- 8.5.5 Middle East & Africa Affinity Ligands Market Size, By Enzymes, By Value, 2018H-2028F (USD Billion & CAGR)
- 8.5.6 Middle East & Africa Affinity Ligands Market Size, By Other Types, By Value, 2018H-2028F (USD Billion & CAGR)
9. Market Dynamics
- 9.1 Impact assessment of Market Dynamics on Global Affinity Ligands Market
- 9.2 Drivers
- 9.3 Restraints
- 9.4 Trends
10. Industry Ecosystem Analysis
- 10.1 Macro-Economic Factor Assessment
- 10.2 Value Chain Analysis
- 10.3 Porter's Five Forces Model
11. Competitive Positioning
- 11.1 Companies' Product Positioning
- 11.2 Market Position Matrix
- 11.3 Market Share Analysis of Affinity Ligands Market
- 11.4 Company Profiles
- 11.4.1 Repligen Corp
- 11.4.2 Aptamer Group
- 11.4.3 Abcam Group
- 11.4.4 Thermo Fisher Scientific
- 11.4.5 Merck KGaA
- 11.4.6 Kaneka Corporation
- 11.4.7 Proteintech
- 11.4.8 EpigenTek
- 11.4.9 Santa Cruz Biotechnology Inc.
- 11.4.10 AMS Biotechnology Europe Ltd