|
|
市場調査レポート
商品コード
1121806
データセンター用液体冷却の世界市場 - コンポーネント別 (ソリューション、サービス)・データセンターの種類別・業種別・地域別・国別の分析 (2022年版):市場の考察・予測、新型コロナウイルス感染症 (COVID-19) の影響 (2022年~2027年)Global Data Center Liquid Cooling Market - Analysis By Components (Solution, Services), Data Center Type, Industry Verticals, By Region, By Country (2022 Edition): Market Insights and Forecast with Impact of COVID-19 (2022-2027) |
||||||
|
|
|||||||


| データセンター用液体冷却の世界市場 - コンポーネント別 (ソリューション、サービス)・データセンターの種類別・業種別・地域別・国別の分析 (2022年版):市場の考察・予測、新型コロナウイルス感染症 (COVID-19) の影響 (2022年~2027年) |
|
出版日: 2022年08月31日
発行: Azoth Analytics
ページ情報: 英文 220 Pages
納期: 即納可能
|
- 全表示
- 概要
- 図表
- 目次
世界のデータセンター用液体冷却の市場規模は、2027年に18億7,000万米ドルに達しています。地域別市場シェアを見ると、南北アメリカがリードしています。
当レポートでは、世界のデータセンター用液体冷却市場について分析し、市場の概略や基本構造、主な市場促進・抑制要因、市場規模の実績値 (2018年~2021年) と予測値 (2022年~2028年)、コンポーネント別・データセンターの種類別・業種別の詳細動向、地域別・主要国の市場構造・動向、市場の競合情勢と魅力、主要企業のプロファイル・戦略展開状況などを調査しております。
目次
第1章 分析の範囲・手法
第2章 戦略提言
第3章 データセンター用液体冷却市場:製品概要
第4章 世界のデータセンター用液体冷却市場:分析
- 世界のデータセンター用液体冷却市場:市場指標
- 市場規模 (金額ベース、2018年~2028年)
- 世界のデータセンター用液体冷却市場:成長と予測
- 世界のデータセンター用液体冷却市場:新型コロナウイルス感染症 (COVID-19) の影響
第5章 世界のデータセンター用液体冷却市場:コンポーネント別の詳細分析
- 世界のデータセンター用液体冷却市場:コンポーネント別の内訳
- 競合ポジショニング:コンポーネント別 (2021年・2028年)
- 高周波アブレーター:市場規模 (単位:100万米ドル、2018年~2028年)
- ソリューション:市場規模 (単位:100万米ドル、2018年~2028年)
- サービス:市場規模 (単位:100万米ドル、2018年~2028年)
第6章 世界のデータセンター用液体冷却市場:データセンターの種類別の詳細分析
- 世界のデータセンター用液体冷却市場:データセンターの種類別の内訳
- 競合ポジショニング:データセンターの種類別 (2021年・2028年)
- 中小規模センター:市場規模 (単位:100万米ドル、2018年~2028年)
- 大規模センター:市場規模 (単位:100万米ドル、2018年~2028年)
第7章 世界のデータセンター用液体冷却市場:業種別の詳細分析
- 世界のデータセンター用液体冷却市場:業種別の内訳
- 競合ポジショニング:業種別 (2021年・2028年)
- 銀行・金融サービス・保険 (BFSI):市場規模 (単位:100万米ドル、2018年~2028年)
- IT・通信:市場規模 (単位:100万米ドル、2018年~2028年)
- 政府・防衛:市場規模 (単位:100万米ドル、2018年~2028年)
- 医療:市場規模 (単位:100万米ドル、2018年~2028年)
- その他:市場規模 (単位:100万米ドル、2018年~2028年)
第8章 世界のデータセンター用液体冷却市場:地域分析
- 世界のデータセンター用液体冷却市場の競合ポジショニング:地域別 (2021年・2028年)
第8章 南北アメリカのデータセンター用液体冷却市場:分析 (2018年~2028年)
- 南北アメリカのデータセンター用液体冷却市場:市場指標
- 南北アメリカのデータセンター用液体冷却市場:市場規模とその予測 (2018年~2028年)
- 代表的企業
- 南北アメリカのデータセンター用液体冷却市場:セグメント別分析
- 市場規模 (金額ベース):コンポーネント別 (ソリューション、サービス)
- 市場規模 (金額ベース):データセンターの種類別 (中小規模センター、大規模センター)
- 市場規模 (金額ベース):業種別 (BFSI、IT・通信、政府・防衛、医療、その他)
- 南北アメリカのデータセンター用液体冷却市場:国別分析
- 市場機会チャート:国別 (金額ベース、2028年)
- 競合ポジショニング:国別
- 米国市場
- カナダ市場
第10章 欧州のデータセンター用液体冷却市場:分析 (2018年~2028年)
- ドイツ市場
- 英国市場
- フランス市場
- オランダ市場
第11章 アジア太平洋のデータセンター用液体冷却市場:分析 (2018年~2028年)
- 中国市場
- 日本市場
- インド市場
- オーストラリア市場
第12章 中東・アフリカのデータセンター用液体冷却市場:分析
第13章 世界のデータセンター用液体冷却の市場力学
- 世界のデータセンター用液体冷却市場の促進要因
- 世界のデータセンター用液体冷却市場の抑制要因
- 世界のデータセンター用液体冷却市場の動向
第14章 市場の魅力と戦略的分析
- 世界のデータセンター用液体冷却市場の魅力 (図説):コンポーネント別 (2028年)
- 世界のデータセンター用液体冷却市場の魅力 (図説):種類別 (2028年)
- 世界のデータセンター用液体冷却市場の魅力 (図説):業種別 (2028年)
- 世界のデータセンター用液体冷却市場の魅力 (図説):地域別 (2028年)
第15章 競合情勢
- 近年の動向
- 世界の大手企業の市場シェア
第16章 企業プロファイル (事業内容、財務分析、事業戦略)
- Asetek
- Vertive Co.
- CoolIT System
- Chilldyne
- Schneider Electric
- Rittal
- Green Revolution Cooling
- Dug Technology
- Alfa Laval AB
- Fujitsu
List of Figures
List of Figures
- Figure 1: Global Internet Penetration Rate, 2021 (In %)
- Figure 2: Global Internet Users, By Region, Q1 2020 (In %)
- Figure 3: Global Data Center Storage Capacity, 2019-2021 (Exabytes)
- Figure 4: Global Manufacturing value added (USD Trillion), 2019-2021
- Figure 5: Global Data Center share by major country, 2021 (In %)
- Figure 6: Number of Data Center Worldwide, 2022
- Figure 7: Global Data Center Capacity, Jan 2021 (Megawatts)
- Figure 8: Global Cloud Traffic, 2018-2021 (Exabytes per year)
- Figure 9: Global Hyperscale Data Center Share in Countries, 2019
- Figure 10: Global Data Center Liquid Cooling Market Size, By Value, 2018-2028 (USD Million
- Figure 11: Global Data Center Liquid Cooling Market- By Components Market Share, 2021 & 2028
- Figure 12: Global Data Center Liquid Cooling Market- By Solution, By Value (USD Million), 2018-2028
- Figure 13: Global Data Center Liquid Cooling Market- By Services, By Value (USD Million), 2018-2028
- Figure 14: Global Data Center Liquid Cooling Market- By Data Center Type Market Share, 2021 & 2028
- Figure 15: Global Data Center Liquid Cooling Market- By Small & Medium Sized Center, By Value (USD Million), 2018-2028
- Figure 16: Global Data Center Liquid Cooling Market- By Large Center, By Value (USD Million), 2018-2028
- Figure 17: Global Data Center Liquid Cooling Market- By Industry Verticals Market Share, 2021 & 2028
- Figure 18: Global Data Center Liquid Cooling Market- By BFSI, By Value (USD Million), 2018-2028
- Figure 19: Global Data Center Liquid Cooling Market- By IT & Telecom, By Value (USD Million), 2018-2028
- Figure 20: Global Data Center Liquid Cooling Market- By Govt. & Defense, By Value (USD Million), 2018-2028
- Figure 21: Global Data Center Liquid Cooling Market- By Healthcare, By Value (USD Million), 2018-2028
- Figure 22: Global Data Center Liquid Cooling Market- By Others, By Value (USD Million), 2018-2028
- Figure 23: Global Data Center Liquid Cooling Market- By Region Market Share, 2021 & 2028
- Figure 24: North America Manufacturing Value Added (USD Trillion), 2015-19
- Figure 25: Total power usage of different countries having access to all Cloud services, 2022 (In Watts)
- Figure 26: Number of Data Centers in Americas, 2022
- Figure 27: North America Individuals Using the Internet, 2018n2020 ( In % of Population)
- Figure 28: North America GDP Per Capita, value (USD Million), 2018-20
- Figure 29: Americas Internet Users, By Countries, 2021 (In %)
- Figure 30: Americas Data Center Liquid Cooling Market Size, By Value, 2018-2028 (USD Million)
- Figure 31: Americas Data Center Liquid Cooling Market- By Components, By Value (USD Million), 2018-2028
- Figure 32: Americas Data Center Liquid Cooling Market- By Data Center Type, By Value (USD Million), 2018-2028
- Figure 33: Americas Data Center Liquid Cooling Market- By Industry Verticals, By Value (USD Million), 2018-2028
- Figure 34: Market Opportunity Chart of Americas Data Center Liquid Cooling Market- By Country, By Value (Year-2028)
- Figure 35: Americas Data Center Liquid Cooling Market- By Country Market Share, 2021 & 2028
- Figure 36: United States Data Center Liquid Cooling Market Size, By Value, 2018-2028 (USD Million)
- Figure 37: United States Data Center Liquid Cooling Market- By Components, By Value (USD Million), 2018-2028
- Figure 38: United States Data Center Liquid Cooling Market- By Data Center Type, By Value (USD Million), 2018-2028
- Figure 39 United States Data Center Liquid Cooling Market- By Industry Verticals, By Value (USD Million), 2018-2028
- Figure 40: Canada Data Center Liquid Cooling Market Size, By Value, 2018-2028 (USD Million)
- Figure 41: Canada Data Center Liquid Cooling Market- By Components, By Value (USD Million), 2018-2028
- Figure 42: Canada Data Center Liquid Cooling Market- By Data Center Type, By Value (USD Million), 2018-2028
- Figure 43: Canada Data Center Liquid Cooling Market- By Industry Verticals, By Value (USD Million), 2018-2028
- Figure 44: European Union Manufacturing, Value Added (USD Trillion), 2019-21
- Figure 45: IoT Spending in Europe (Billion USD), 2019
- Figure 46: Europe Gas Production (2019-2021) (Exajoules)
- Figure 47: Europe Data Center Liquid Cooling Market Size, By Value, 2018-2028 (USD Million)
- Figure 48: Europe Data Center Liquid Cooling Market- By Components, By Value (USD Million), 2018-2028
- Figure 49: Europe Data Center Liquid Cooling Market- By Data Center Type, By Value (USD Million), 2018-2028
- Figure 50: Europe Data Center Liquid Cooling Market- By Industry Verticals, By Value (USD Million), 2018-2028
- Figure 51: Market Opportunity Chart of Europe Data Center Liquid Cooling Market- By Country, By Value (Year-2028)
- Figure 52: Europe Data Center Liquid Cooling Market- By Country Market Share, 2021 & 2028
- Figure 53: Germany Data Center Liquid Cooling Market Size, By Value, 2018-2028 (USD Million)
- Figure 54: Germany Data Center Liquid Cooling Market- By Components, By Value (USD Million), 2018-2028
- Figure 55: Germany Data Center Liquid Cooling Market- By Data Center Type, By Value (USD Million), 2018-2028
- Figure 56: Germany Data Center Liquid Cooling Market- By Industry Verticals, By Value (USD Million), 2018-2028
- Figure 57: United Kingdom Data Center Liquid Cooling Market Size, By Value, 2018-2028 (USD Million)
- Figure 58: United Kingdom Data Center Liquid Cooling Market- By Components, By Value (USD Million), 2018-2028
- Figure 59: United Kingdom Data Center Liquid Cooling Market- By Data Center Type, By Value (USD Million), 2018-2028
- Figure 60: United Kingdom Data Center Liquid Cooling Market- By Industry Verticals, By Value (USD Million), 2018-2028
- Figure 61: France Data Center Liquid Cooling Market Size, By Value, 2018-2028 (USD Million)
- Figure 62: France Data Center Liquid Cooling Market- By Components, By Value (USD Million), 2018-2028
- Figure 63: France Data Center Liquid Cooling Market- By Data Center Type, By Value (USD Million), 2018-2028
- Figure 64: France Data Center Liquid Cooling Market- By Industry Verticals, By Value (USD Million), 2018-2028
- Figure 65: Netherland Data Center Liquid Cooling Market Size, By Value, 2018-2028 (USD Million)
- Figure 66: Netherland Data Center Liquid Cooling Market- By Components, By Value (USD Million), 2018-2028
- Figure 67: Netherland Data Center Liquid Cooling Market- By Data Center Type, By Value (USD Million), 2018-2028
- Figure 68: Netherland Data Center Liquid Cooling Market- By Industry Verticals, By Value (USD Million), 2018-2028
- Figure 69: East Asia & Pacific Manufacturing, Value Added (USD Trillion), 2019-21
- Figure 70: Asia Pacific Internet Penetration, 2017-2020 ( in %)
- Figure 71: Asian developing countries manufacturing growth rate (%)
- Figure 72: Number of Data Centers in APAC, 2021
- Figure 73: Asia Pacific Internet Users, By Countries, 2021 (In Million)
- Figure 74: Asia Pacific Data Center Liquid Cooling Market Size, By Value, 2018-2028 (USD Million)
- Figure 75: Asia Pacific Data Center Liquid Cooling Market- By Components, By Value (USD Million), 2018-2028
- Figure 76: Asia Pacific Data Center Liquid Cooling Market- By Data Center Type, By Value (USD Million), 2018-2028
- Figure 77: Asia Pacific Data Center Liquid Cooling Market- By Industry Verticals, By Value (USD Million), 2018-2028
- Figure 78: Market Opportunity Chart of Asia Pacific Data Center Liquid Cooling Market- By Country, By Value (Year-2028)
- Figure 79: Asia Pacific Data Center Liquid Cooling Market- By Country Market Share, 2021 & 2028
- Figure 80: China Data Center Liquid Cooling Market Size, By Value, 2018-2028 (USD Million)
- Figure 81: China Data Center Liquid Cooling Market- By Components, By Value (USD Million), 2018-2028
- Figure 82: China Data Center Liquid Cooling Market- By Data Center Type, By Value (USD Million), 2018-2028
- Figure 83: China Data Center Liquid Cooling Market- By Industry Verticals, By Value (USD Million), 2018-2028
- Figure 84: Japan Data Center Liquid Cooling Market Size, By Value, 2018-2028 (USD Million)
- Figure 85: Japan Data Center Liquid Cooling Market- By Components, By Value (USD Million), 2018-2028
- Figure 86: Japan Data Center Liquid Cooling Market- By Data Center Type, By Value (USD Million), 2018-2028
- Figure 87: Japan Data Center Liquid Cooling Market- By Industry Verticals, By Value (USD Million), 2018-2028
- Figure 88: India Data Center Liquid Cooling Market Size, By Value, 2018-2028 (USD Million)
- Figure 89: India Data Center Liquid Cooling Market- By Components, By Value (USD Million), 2018-2028
- Figure 90: India Data Center Liquid Cooling Market- By Data Center Type, By Value (USD Million), 2018-2028
- Figure 91: India Data Center Liquid Cooling Market- By Industry Verticals, By Value (USD Million), 2018-2028
- Figure 92: Australia Data Center Liquid Cooling Market Size, By Value, 2018-2028 (USD Million)
- Figure 93: Australia Data Center Liquid Cooling Market- By Components, By Value (USD Million), 2018-2028
- Figure 94: Australia Data Center Liquid Cooling Market- By Data Center Type, By Value (USD Million), 2018-2028
- Figure 95: Australia Data Center Liquid Cooling Market- By Industry Verticals, By Value (USD Million), 2018-2028
- Figure 96: Middle East and North Africa Population (in Million), 2018-2020
- Figure 97: Middle East and North Africa, GDP Per Capita, value (USD Million), 2018-20
- Figure 98: Middle East and North Africa, Internet Penetration (% of total population), 2018-2020
- Figure 99: Middle East & Africa Data Center Liquid Cooling Market Size, By Value, 2018-2028 (USD Million)
- Figure 100: Middle East & Africa Data Center Liquid Cooling Market- By Components, By Value (USD Million), 2018-2028
- Figure 101: Middle East & Africa Data Center Liquid Cooling Market- By Data Center Type, By Value (USD Million), 2018-2028
- Figure 102: Middle East & Africa Data Center Liquid Cooling Market- By Industry Verticals, By Value (USD Million), 2018-2028
- Figure 103: Market Attractiveness Chart of Global Data Center Liquid Cooling Market- By Components (Year-2028)
- Figure 104: Market Attractiveness Chart of Global Data Center Liquid Cooling Market- By Data Center Type (Year-2028)
- Figure 105: Market Attractiveness Chart of Global Data Center Liquid Cooling Market- By Industry Verticals (Year-2028)
- Figure 106: Market Attractiveness Chart of Global Data Center Liquid Cooling Market- By Region (Year-2028)
- Figure 107: Global leading Data Center Liquid Cooling company market share (%), 2021
- Figure 108: Asetek has targeted the main HPC OEMis
- Figure 109: Asetek Annual Sales Revenue, 2017-2021 (USD Million)
- Figure 110: Asetek Net Income, 2017-2021 (USD Million)
- Figure 111: Asetek Sales Revenue, By Business Segment (%), FY2021
- Figure 112: Asetek Sales Revenue, By Geographical Segment (%), FY2021
- Figure 113: Vertiv Holdings Co Annual Sales Revenue, 2019-2021 (USD Million)
- Figure 114: Vertiv Holdings Co Net Income, 2019-2021 (USD Million)
- Figure 115: Vertiv Holdings Co Sales Revenue, By Business Segment (%), FY2021
- Figure 116: Vertiv Holdings Co Sales Revenue, By Geographical Segment (%), FY2021
- Figure 117: Vertiv Holdings Co Annual R&D Expenses, 2019-2021 (USD Million)
- Figure 118: Vertiv Holdings Co Sales Revenue, By End Markets (%), FY2021
- Figure 119: Schneider Electric Annual Sales Revenue, 2018-2021 (USD Million)
- Figure 120: Schneider Electric Net Income, 2018-2021 (USD Million)
- Figure 121: Schneider Electric Sales Revenue, By Business Segment (%), FY2021
- Figure 122: Schneider Electric Sales Revenue, By Geographical Segment (%), FY2021
- Figure 123: DUG Technology Annual Sales Revenue, FY2020-FY2022 (USD Million)
- Figure 124: DUG Technology Net Income, FY2020-FY2021 (USD Million)
- Figure 125: DUG Technology Sales Revenue, By Business Segment (%), FY2022
- Figure 126: DUG Technology Sales Revenue, By Geographical Segment (%), FY2021
- Figure 127: Alfa Laval AB Annual Sales Revenue, 2017-2021 (USD Million)
- Figure 128: Alfa Laval AB Net Income, 2017-2021 (USD Million)
- Figure 129: Alfa Laval AB Sales Revenue, By Business Segment (%), FY2021
- Figure 130: Alfa Laval AB Sales Revenue, By Geographical Segment (%), FY2021
- Figure 131: Fujitsu Annual Sales Revenue, 2017-2021 (USD Million)
- Figure 132: Fujitsu Net Income, 2017-2021 (USD Million)
- Figure 133: Fujitsu R&D Expenses, 2017-2021 (Billion Yen)
- Figure 134: Fujitsu Sales Revenue, By Business Segment (%), FY2021
- Figure 135: Fujitsu Group Sales Revenue, By Geographical Segment (%), FY2021
Executive Summary
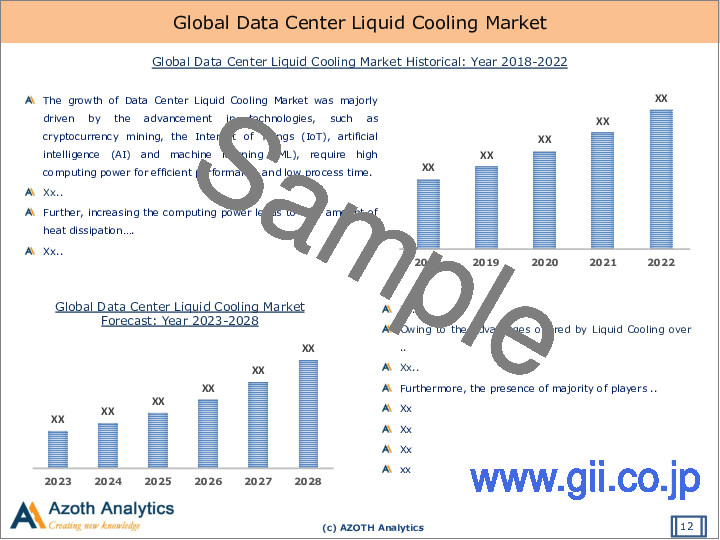
The global Data Center Liquid Cooling Market was valued at USD 1.87 billion in the year 2027 with the Americas region leading the regional market share.
A liquid cooling system is an enhanced heat transfer solution designed to remove and dissipate heat quickly and effectively. The liquid cooling system is essential in the IT and data-centre sector, owing to the need for enhanced high-quality cooling solutions more efficient than the traditional air-cooling solution. Also, the surge in technological innovation in IT infrastructure coupled with the rise in demand for liquid cooling system among smartphone manufacturers for thermal management is driving the growth of the global market. Further, Cloud providers, colocation providers, hyperscale data centers and others are adopting cold plates, rack liquid cooling, direct liquid cooling (DLC), and indirect liquid cooling which will increase the demand for data center liquid cooling technology.
The Asia Pacific region is anticipated to witness rapid growth during the forecast period owing to steady growth in the rapid expansion of the high demand for cloud applications primarily due to social media, gaming and entertainment in the region. China's large base is a significant contributor to the expansion of the regional market.
The COVID-19 epidemic had a negligible impact on the data center liquid cooling industry. Due to mandated social distance restrictions, business activities like data center consolidation were temporarily put on hold, and physical server moves, building closures, and space openings were made more difficult. One significant development brought about by the COVID-19 epidemic is the ability for businesses to offer remote work to their employees around the world. This has led to a sharp increase in demand for data centers around the world.
Additionally, the majority of interactions between people and companies now take place online. The amount of internet traffic, collaboration software, and data security all increased significantly as a result. As a result, data centers experienced an increase in workload in 2020 and 2021. As a result, these data centers have a significant requirement for cooling. Thus, the COVID-19 epidemic raised the demand for liquid cooling systems for data centers.
Scope of the Report
- The report presents the analysis of Data Center Liquid Cooling Market for the historical period of 2018-2021, estimates for the year 2022 and the forecast period of 2023-2028.
- The report analyses the Data Center Liquid Cooling Market by Value (USD Million).
- The report analyses the Data Center Liquid Cooling Market by Components (Solution and Services).
- The report analyses the Data Center Liquid Cooling Market by Data Center Type (Small & Medium Sized Center, Large Center).
- The report analyses the Data Center Liquid Cooling Market by Industry Verticals (BFSI, IT & Telecom, Govt. & Defence, Healthcare, Others.
- The Global Data Center Liquid Cooling Market has been analysed By Region (Americas, Europe, Asia Pacific, and MEA).
- The Global Data Center Liquid Cooling Market has been analysed By Country (United States, Canada, Germany, U.K, France, Netherland, China, Japan, India, Australia).
- The key insights of the report have been presented through the frameworks of Company Share. Also, the attractiveness of the market has been presented by region, by Components, By Data Center Type, By Industry Verticals.
- Also, the major opportunities, trends, drivers and challenges of the industry has been analysed in the report.
- The report tracks competitive developments, strategies, and List of First-Time Data Center Liquid Cooling Approvals in 2021. The companies analysed in the report include Asetek, Vertive Co., CoolIT System, Chilldyne, Schneider Electric, Rittal, Green Revolution Cooling, Dug Technology, Alfa Laval AB, Fujitsu.
Key Target Audience
- Data Center Companies
- Data Center Liquid Cooling Technology Companies
- Research and Development (R&D) Organizations
- Government Bodies & Regulating Authorities
- Investment Banks and Equity Firms
Table of Contents
1. Report Scope and Methodology
- 1.1 Scope of the Report
- 1.2 Research Methodology
- 1.3 Executive Summary
2. Strategic Recommendations
3. Global Data Center Liquid Cooling Market: Product Overview
4. Global Data Center Liquid Cooling Market: An Analysis
- 4.1 Global Data Center Liquid Cooling Market: Market Indicators
- 4.2 Market Size, By Value, 2018-2028
- 4.3 Global Data Center Liquid Cooling Market: Growth and Forecast
- 4.4 Impact of COVID-19 on Global Data Center Liquid Cooling Market
5. Global Data Center Liquid Cooling Market: Segment Analysis By Components
- 5.1 Global Data Center Liquid Cooling Market Segmentation, By Components
- 5.2 Competitive Positioning of Data Center Liquid Cooling Market: By Components (2021 & 2028)
- 5.3 By Solution, By Value (USD Million), 2018-2028
- 5.4 By Services, By Value (USD Million), 2018-2028
6. Global Data Center Liquid Cooling Market: Segment Analysis By Data Center Type
- 6.1 Global Data Center Liquid Cooling Market Segmentation, By Data Center Type
- 6.2 Competitive Positioning of Global Data Center Liquid Cooling Market, By Data Center Type (2021 & 2028)
- 6.3 By Small & Medium Sized Centers, By value (USD Million), 2018-2028
- 6.4 By Large Centers, By Value (USD Million), 2018-2028
7. Global Data Center Liquid Cooling Market: Segment Analysis By Industry Verticals
- 7.1 Global Data Center Liquid Cooling Market Segmentation, By Industry Verticals
- 7.2 Competitive Positioning of Global Data Center Liquid Cooling Market, By Industry Verticals (2021 & 2028)
- 7.3 By BFSI, By value (USD Million), 2018-2028
- 7.4 By It & Telecom, By Value (USD Million), 2018-2028
- 7.5 By Govt. & Telecom, By Value (USD Million), 2018-2028
- 7.6 By Healthcare, By Value (USD Million), 2018-2028
- 7.7 By Others, By Value (USD Million), 2018-2028
8. Global Data Center Liquid Cooling Market: Regional Analysis
- 8.1 Competitive Positioning of Global Data Center Liquid Cooling Market: By Region (2021 & 2028)
9. Americas Data Center Liquid Cooling Market: An Analysis (2018-2028)
- 9.1 Americas Data Center Liquid Cooling Market: Market Indicators
- 9.2 Americas Data Center Liquid Cooling Market- Size and Forecast, By Value (2018-2028)
- 9.3 Americas Data Center Liquid Cooling Market: Prominent Companies
- 9.4 Americas Data Center Liquid Cooling Market: Segment Analysis
- 9.5 Americas Data Center Liquid Cooling Market By Components (Solution, Services), By Value
- 9.6 Americas Data Center Liquid Cooling Market By Data Center Type (Small & Medium Sized Centers, Large Centres), By Value
- 9.7 Americas Data Center Liquid Cooling Market By Industrial Verticals (BFSI, It & Telecom, Govt. & Defense, Healthcare, Others), By Value
- 9.8 Americas Data Center Liquid Cooling Market: Country Analysis
- 9.9 Market Opportunity Chart of Americas Data Center Liquid Cooling Marketn By Country, By Value (Year-2028)
- 9.10 Competitive Positioning of Americas Data Center Liquid Cooling Marketn By Country
- 9.11 United States Data Center Liquid Cooling Market: Size and Forecast, By Value (2018-2028)
- 9.12 United States Data Center Liquid Cooling Market
- 9.13 United States Data Center Liquid Cooling Market By Components, By Data Center Type, By Industrial Verticals, By Value (2018-2028)
- 9.14 Canada Data Center Liquid Cooling Market: Size and Forecast, By Value (2018-2028)
- 9.15 Canada Data Center Liquid Cooling Market
- 9.16 Canada Data Center Liquid Cooling Market By Components, By Data Center Type, By Industrial Verticals, By Value (2018-2028)
10. Europe Data Center Liquid Cooling Market: An Analysis (2018-2028)
- 10.1 Europe Data Center Liquid Cooling Market: Market Indicators
- 10.2 Europe Data Center Liquid Cooling Market- Size and Forecast, By Value (2018-2028)
- 10.3 Europe Data Center Liquid Cooling Market: Prominent Companies
- 10.4 Europe Data Center Liquid Cooling Market: Segment Analysis
- 10.5 Europe Data Center Liquid Cooling Market By Components (Solution, Services), By Value
- 10.6 Europe Data Center Liquid Cooling Market By Data Center Type (Small & Medium Sized Centers, Large Centres), By Value
- 10.7 Europe Data Center Liquid Cooling Market By Industrial Verticals (BFSI, It & Telecom, Govt. & Defense, Healthcare, Others), By Value
- 10.8 Europe Data Center Liquid Cooling Market: Country Analysis
- 10.9 Market Opportunity Chart of Europe Data Center Liquid Cooling Marketn By Country, By Value (Year-2028)
- 10.10 Competitive Positioning of Europe Data Center Liquid Cooling Marketn By Country
- 10.11 Germany Data Center Liquid Cooling Market: Size and Forecast, By Value (2018-2028)
- 10.12 Germany Data Center Liquid Cooling Market
- 10.13 Germany Data Center Liquid Cooling Market By Components, By Data Center Type, By Industrial Verticals, By Value (2018-2028)
- 10.14 United Kingdom Data Center Liquid Cooling Market: Size and Forecast, By Value (2018-2028)
- 10.15 United Kingdom Data Center Liquid Cooling Market
- 10.16 United Kingdom Data Center Liquid Cooling Market By Components, By Data Center Type, By Industrial Verticals, By Value (2018-2028)
- 10.17 France Data Center Liquid Cooling Market: Size and Forecast, By Value (2018-2028)
- 10.18 France Data Center Liquid Cooling Market
- 10.19 France Data Center Liquid Cooling Market By Components, By Data Center Type, By Industrial Verticals, By Value (2018-2028)
- 10.20 Netherland Data Center Liquid Cooling Market: Size and Forecast, By Value (2018-2028)
- 10.21 Netherland Data Center Liquid Cooling Market By Components, By Data Center Type, By Industrial Verticals, By Value (2018-2028)
11. Asia Pacific Data Center Liquid Cooling Market: An Analysis (2018-2028)
- 11.1 Asia Pacific Data Center Liquid Cooling Market: Market Indicators
- 11.2 Asia Pacific Data Center Liquid Cooling Market- Size and Forecast, By Value (2018-2028)
- 11.3 Asia Pacific Data Center Liquid Cooling Market: Prominent Companies
- 11.4 Asia Pacific Data Center Liquid Cooling Market: Segment Analysis
- 11.5 Asia Pacific Data Center Liquid Cooling Market By Components (Solution, Services), By Value
- 11.6 Asia Pacific Data Center Liquid Cooling Market By Data Center Type (Small & Medium Sized Centers, Large Centres), By Value
- 11.7 Asia Pacific Data Center Liquid Cooling Market By Industrial Verticals (BFSI, It & Telecom, Govt. & Defense, Healthcare, Others), By Value
- 11.8 Asia Pacific Data Center Liquid Cooling Market: Country Analysis
- 11.9 Market Opportunity Chart of Asia Pacific Data Center Liquid Cooling Marketn By Country, By Value (Year-2028)
- 11.10 Competitive Positioning of Asia Pacific Data Center Liquid Cooling Marketn By Country
- 11.11 China Data Center Liquid Cooling Market: Size and Forecast, By Value (2018-2028)
- 11.12 China Data Center Liquid Cooling Market
- 11.13 China Data Center Liquid Cooling Market By Components, By Data Center Type, By Industrial Verticals, By Value (2018-2028)
- 11.14 Japan Data Center Liquid Cooling Market: Size and Forecast, By Value (2018-2028)
- 11.15 Japan Data Center Liquid Cooling Market
- 11.16 Japan Data Center Liquid Cooling Market By Components, By Data Center Type, By Industrial Verticals, By Value (2018-2028)
- 11.17 India Data Center Liquid Cooling Market: Size and Forecast, By Value (2018-2028)
- 11.18 India Data Center Liquid Cooling Market
- 11.19 India Data Center Liquid Cooling Market By Components, By Data Center Type, By Industrial Verticals, By Value (2018-2028)
- 11.20 Australia Data Center Liquid Cooling Market: Size and Forecast, By Value (2018-2028)
- 11.21 Australia Data Center Liquid Cooling Market
- 11.22 Australia Data Center Liquid Cooling Market By Components, By Data Center Type, By Industrial Verticals, By Value (2018-2028)
12. Middle East and Africa Data Center Liquid Cooling Market
- 12.1 Middle East and Africa Data Center Liquid Cooling Market: Market Indicators
- 12.2 Middle East and Africa Data Center Liquid Cooling Market- Size and Forecast, By Value (2018-2028)
- 12.3 Middle East and Africa Data Center Liquid Cooling Market: Segment Analysis
- 12.4 Middle East and Africa Data Center Liquid Cooling Market By Components (Solution, Services), By Value
- 12.5 Middle East and Africa Data Center Liquid Cooling Market By Data Center Type (Small & Medium Sized Centers, Large Centres), By Value
- 12.6 Middle East and Africa Data Center Liquid Cooling Market By Industrial Verticals (BFSI, It & Telecom, Govt. & Defense, Healthcare, Others), By Value
13. Global Data Center Liquid Cooling Market Dynamics
- 13.1 Global Data Center Liquid Cooling Market Drivers
- 13.2 Global Data Center Liquid Cooling Market Restraints
- 13.3 Global Data Center Liquid Cooling Market Trends
14. Market Attractiveness and Strategic Analysis
- 14.1 Market Attractiveness Chart of Global Data Center Liquid Cooling Market - By Components (Year 2028)
- 14.2 Market Attractiveness Chart of Global Data Center Liquid Cooling Market n By Data Center Type (Year 2028)
- 14.3 Market Attractiveness Chart of Global Data Center Liquid Cooling Market n By Industry Verticals (Year 2028)
- 14.4 Market Attractiveness Chart of Global Data Center Liquid Cooling Market n By Region (Year 2028)
15. Competitive Landscape
- 15.1 Recent Developments
- 15.2 Market Share of global leading companies
16. Company Profiles (Business Description, Financial Analysis, Business Strategy)
- 16.1 Asetek
- 16.2 Vertive Co.
- 16.3 CoolIT System
- 16.4 Chilldyne
- 16.5 Schneider Electric
- 16.6 Rittal
- 16.7 Green Revolution Cooling
- 16.8 Dug Technology
- 16.9 Alfa Laval AB
- 16.10 Fujitsu