|
|
市場調査レポート
商品コード
1261068
PVインバーター:世界の展望・予測 (2023-2028年)PV Inverter Market - Global Outlook & Forecast 2023-2028 |
||||||
|
|
|||||||


| PVインバーター:世界の展望・予測 (2023-2028年) |
|
出版日: 2023年04月20日
発行: Arizton Advisory & Intelligence
ページ情報: 英文
納期: 即納可能
|
- 全表示
- 概要
- 目次
世界のPVインバーターの市場規模は、2022年から2028年にかけて13.54%のCAGRで成長すると予測されています。
省エネ規制がPVインバーター需要を牽引しています。また、グリーンビルディングに向けたアクティビティの成長も同市場の成長に寄与しています。
当レポートでは、世界のPVインバーターの市場を調査し、市場の定義と概要、市場機会・市場動向、市場影響因子の分析、市場規模の推移・予測、各種区分・地域別の詳細分析、競合情勢、主要企業のプロファイルなどをまとめています。
目次
第1章 調査手法
第2章 調査目的
第3章 調査プロセス
第4章 調査対象・調査範囲
第5章 レポートの前提・注記
第6章 市場概要
第7章 重要考察
第8章 イントロダクション
- 概要
- 技術の統合
- 太陽エネルギーに関する世界の主なハイライト
- 住宅建設におけるPVの設置
- 商業施設におけるPVの設置
- PVインバーターを促進する政府規制
- 太陽光発電市場の状況
- PVインバーターの主要企業
- COVID-19とロシアの侵略の影響
- バリューチェーン
第9章 市場機会・市場動向
- PVインバーター需要を促進するエネルギー効率に関する規制
- スマートホームにおけるPVインバーターの進歩
- 空港の近代化
第10章 市場成長の実現因子
- グリーンビルディング活動の成長
- 屋上への太陽光発電の組み込み
- 世界の建設市場を再構築する持続可能性
- データセンター市場向けのオンサイト太陽光発電の組み込み
第11章 市場抑制要因
- ソーラーパネルの設置コストの高さによるPVインバーター需要の減少
- 原材料価格の変動性
- 中国ベンダーとの競合の激化
第12章 市場情勢
- 市場概要
- 市場規模・予測
- ファイブフォース分析
第13章 製品タイプ
- 市場スナップショット・成長エンジン
- 市場概要
- ストリングインバーター:市場規模・予測
- 中央インバーター:市場規模・予測
- マイクロインバーター:市場規模・予測
- その他のインバーター:市場規模・予測
第14章 フェーズタイプ
- 市場スナップショット・成長エンジン
- 市場概要
- 3相:市場規模・予測
- 単相:市場規模・予測
第15章 接続タイプ
- 市場スナップショット・成長エンジン
- 市場概要
- オングリッド:市場規模・予測
- オフグリッド:市場規模・予測
第16章 電源出力タイプ
- 市場スナップショット・成長エンジン
- 市場概要
- 0.5-33 KW:市場規模・予測
- 33-110 KW:市場規模・予測
- 110 KW超:市場規模・予測
第17章 エンドユーザー
- 市場スナップショット・成長エンジン
- 市場概要
- ユーティリティ
- 商業
- 産業
- 住宅
第18章 流通経路
- 市場スナップショット・成長エンジン
- 市場概要
- オフライン
- ディーラー・ディストリビューター
- 専門店
- 大衆市場向け事業者
- オンライン
- 直接販売
- 第三者販売
第19章 地域
- 市場のスナップショットと成長エンジン
- 地域概要
第20章 アジア太平洋
第21章 北米
第22章 欧州
第23章 中東・アフリカ
第24章 ラテンアメリカ
第25章 競合情勢
第26章 主要企業プロファイル
- SMA SOLAR TECHNOLOGY AG
- SUNGROW
- SIEMENS AG
- DELTA ELECTRONICS, INC
- SOLAREDGE TECHNOLOGIES, INC.
- HUAWEI TECHNOLOGIES CO
第27章 その他の有力ベンダー
- FIMER GROUP
- EMERSON ELECTRIC CO.
- GINLONG TECHNOLOGIES
- POWER ELECTRONICS S.L
- HITACHI HI-REL POWER ELECTRONICS PVT. LTD
- BOSCH
- SUNPOWER CORPORATION
- SAMSUNG
- JOHNSON CONTROLS
- PANASONIC
- FRONIUS INTERNATIONAL GMBH
- LENNOX
- TSI INCORPORATED
- ENERTRONICA SANTERNO S.P.A
第28章 レポートサマリー
- 重要ポイント
- 戦略的提言
第29章 定量的サマリー
第30章 付録
The global PV inverter market is expected to grow at a CAGR of 13.54% during 2022 to 2028
KEY HIGHLIGHTS
- In 2020, Sungrow Power Supply (Sungrow) surpassed Huawei to become the no.1 industry-leading player in the global PV inverter market (24% M/S based on shipment volume). The company targets an international industry share of 30% through overseas capacity expansions.
- 2022 is the beginning of the inverter replacement cycle - New solar-powered PV capacity installations have expanded worldwide since 2015.
- In 2022, according to the European Construction Industry Federation (FIEC), total investment in European construction was expected to increase by 2.4%, led by new home construction and civil engineering.
- The US Department of Energy recommends reducing electricity usage by incorporating more energy-efficient PV inverters, which can significantly reduce the use of nonrenewable electricity for electrical appliances.
- The US Department of Energy also estimates that a Photovoltaic inverter is up to 96% energy efficient. Implementing PV inverters in both residential and commercial buildings can largely facilitate the reduction of energy consumption and help in achieving the energy efficiency goals in the country.
KEY TRENDS & DRIVERS
Regulation on Energy Efficiency Driving PV Inverter Demand
As the global trend is shifting towards sustainability, governments worldwide are implementing regulations to reduce energy consumption and use it more efficiently across all stages of the energy chain, including generation, transmission, distribution, and end-use. Such policies drive consumers to shift toward renewable energy and reduce electricity consumption. The PV inverter market is pivotal in this era, where sustainable living and eco-friendly energy apply to most electrical appliances. The 2021 Europe commission introduced a new Energy Efficiency Directive to promote energy efficiency and achieve energy savings from climate change.
Growth of Green Building Activities
A Green building creates structures using environmentally sustainable and resource-efficient processes throughout the building's lifecycle, from siting to design, construction, operation, maintenance, renovation, and deconstruction. Green buildings are also known as sustainable and high-performance buildings and include factors like:
- Efficiently reducing the use of energy, water, and other resources.
- Protecting the health of the residents and improving the productivity of the employees.
- Effectively reduce the wastage of electricity, water, pollution, and environmental degradation.
Solar panels are an effective way for a building to meet its sustainability standards. These PV power panels can provide abundant eco-friendly energy resources, reducing or eliminating the need for electric consumption.
SEGMENTATION INSIGHTS
INSIGHTS BY PRODUCT TYPE
PV inverters are available in various types and designs. The global PV inverter market product type includes string, central, micro, and others, and in 2022, string inverters accounted for most of the global PV inverter market share. Unlike traditional inverters, string inverters are easier to install and less costly. They are directly connected to the grid and mostly do not have the facility of battery back-up the interiors in a smart and sophisticated way. Further, string-type inverters are highly suitable for commercial and residential sectors, encompassing small utility installations that usually fall under 1 MW. String inverters are best for homeowners looking for lower-cost PV systems or properties with uncomplicated roofs and consistent renewable electricity throughout the day.
Segmentation by Product Type
- String Inverter
- Central Inverter
- Micro Inverter
- Other Inverter
INSIGHTS BY PHASE TYPE
Inverters are utilized in solar systems to transform DC power from solar panels into AC power. They can produce three-phase or single-phase output. Residential users usually utilize single-phase power supply. The three-phase power supply is usually used for industrial locations as three-phase can transfer more power and power large equipment like heaters, machines, electric car chargers, etc. The global three-PV inverter market holds the largest market share and is projected to continue the trend during the forecast period. Using a three-phase inverter, the end user can provide extra electricity back to the grid, and having three lines also allows users to pull more power from the grid. This helps with heated pulls, larger AC units, and other high-consumption needs. Therefore, high-end commercial building highly attracts to the three-phase PV inverter market.
Segmentation by Phase Type
- Three Phase
- Single Phase
INSIGHTS BY CONNECTION TYPE
The global PV inverter market by grid type can be categorized as on-grid and off-grid. The global on-grid PV inverter market size crossed USD 5.1 billion in 2022. The on-grid solar inverter is a conversant part of the on-grid solar system. It performs the critical task of converting the Direct Current (DC) to Alternating Current (AC). The major advantages of the on-grid solar inverter are Energy Conversion, Ensuring System Safety, Grid Assistance, Tracking Power Production, and many more.
Segmentation by Connection Type
- On-Grid
- Off-Grid
INSIGHTS BY POWER OUTPUT TYPE
Many PV inverters are available in the market, but the devices are classified based on three power output ranges, starting at ( ( (<0.5-33) Kw power output type held the largest global PV inverter market share.
Segmentation by Power Output
- 33-110 Kw
- >110 Kw
INSIGHTS BY END-USER
The utility end-user segment dominated the global PV inverter market in 2022. Solar power equipment and technologies are progressively making their way into the power generation, transmission, and distribution industry to increase the efficiency, productivity, and safety associated with power plants. With the help of solar electric power source digital technologies such as sensors, smart grids, and smart meters, the company and the customer have real-time and more accurate accounts of power usage. Further, although the construction and expansion of utility plants will drive the PV inverter market, most demand will be generated from house renovation. Modern house decors demand improved aesthetics, driving the demand for products such as PV inverters.
Segmentation by End User
- Utilities
- Commercial
- Industrial
- Residential
INSIGHTS BY DISTRIBUTION CHANNEL
The offline distribution channel dominated the global PV inverter market in 2022, and the segment is expected to witness an incremental growth of over USD 1.76 billion during the forecast period. Factors such as the broad reach in areas that lack better connectivity and brand loyalty, along with the quality of products, are driving the growth of this segment. Although the online channel holds a relatively lower share of the global PV inverter market, it is expected to grow at a higher CAGR during the forecast period. The proliferation of e-commerce and raising awareness of the benefits of online purchases, such as heavy discounts, occasional offers, and rising demand for convenience, is driving the growth of the online segment.
Segmentation by Distribution Channel
- Offline
- Online
GEOGRAPHICAL ANALYSIS
APAC dominated the global PV inverter market, with over 46% share in 2022. India, China, Australia, South Korea, and Japan mainly drive the region's market growth. Strong economic growth coupled with rising construction activities and increasing disposable income has primarily supported the market growth in the region. The China market is witnessing a spurt in multiple real estate projects and public-private investments in various residential, industrial, and commercial development zones because of the boom in urbanization.
Segmentation by Geography
- APAC
- China
- India
- Japan
- Australia
- North America
- US
- Canada
- Europe
- Germany
- UK
- Spain
- France
- Italy
- Middle East & Africa
- Saudi Arabia
- UAE
- Saudi Africa
- Latin America
- Brazil
- Mexico
- Argentina
COMPETITIVE LANDSCAPE
The global PV inverter market is highly competitive, with the presence of a large number of private and public companies. These vendors typically compete on a key range of product design, reliability, quality, support services, and price. The instant technological advancements adversely impact the industry vendors as consumers anticipate the continuous innovations and upgrades of products. The present scenario drives vendors to alter and enhance their unique value proposition to achieve a strong industry presence.
Key Company Profiles
- SMA Solar Technology AG
- Sungrow
- Siemens AG
- Delta Electronics, INC
- Solaredge technologies, Inc
- HUAWEI Technologies Co
Other Prominent Vendors
- Fimer Group
- Emerson Electric Co
- GINLONG Technologies
- Power Electronics S.L
- HITACHI HI-REL Power Electronics PVT. LTD
- Bosch
- SunPower Corporation
- Samsung
- Johnson Controls
- Panasonic
- Fronius International GMBH
- Lennox
- TSI Incorporated
- Enertronica Santerno SpA
KEY QUESTIONS ANSWERED:
- 1. How big is the PV inverter market?
- 2. What is the growth rate of the global PV inverter market?
- 3. Who are the key players in the global PV inverter market?
- 4. What are the significant trends in the PV inverter market?
- 5. Which region dominates the global PV inverter market share?
TABLE OF CONTENTS
1 RESEARCH METHODOLOGY
2 RESEARCH OBJECTIVES
3 RESEARCH PROCESS
4 SCOPE & COVERAGE
- 4.1 MARKET DEFINITION
- 4.1.1 INCLUSIONS
- 4.1.2 EXCLUSIONS
- 4.1.3 MARKET ESTIMATION CAVEATS
- 4.2 BASE YEAR
- 4.3 SCOPE OF THE STUDY
- 4.4 MARKET SEGMENTATION
- 4.4.1 MARKET SEGMENTATION BY PRODUCT TYPE
- 4.4.2 MARKET SEGMENTATION BY PHASE TYPE
- 4.4.3 MARKET SEGMENTATION BY CONNECTION TYPE
- 4.4.4 MARKET SEGMENTATION BY POWER OUTPUT
- 4.4.5 MARKET SEGMENTATION BY END-USER
- 4.4.6 MARKET SEGMENTATION BY DISTRIBUTION CHANNEL
- 4.4.7 MARKET SEGMENTATION BY GEOGRAPHY
5 REPORT ASSUMPTIONS & CAVEATS
- 5.1 KEY CAVEATS
- 5.2 CURRENCY CONVERSION
- 5.3 MARKET DERIVATION
6 PREMIUM INSIGHTS
- 6.1.1 OPPORTUNITY & CHALLENGE ANALYSIS
- 6.1.2 HIGHLIGHTS
- 6.1.3 PRODUCT TYPE
- 6.1.4 PHASE TYPE
- 6.1.5 CONNECTION TYPE
- 6.1.6 END-USER TYPE
- 6.1.7 COMPETITIVE LANDSCAPE
7 MARKET AT A GLANCE
8 INTRODUCTION
- 8.1 OVERVIEW
- 8.2 TECHNOLOGY INTEGRATION
- 8.3 GLOBAL KEY HIGHLIGHTS REGARDING SOLAR ENERGY
- 8.4 PV INSTALLATION IN RESIDENTIAL CONSTRUCTION
- 8.5 PV INSTALLATION IN COMMERCIAL CONSTRUCTION
- 8.6 GOVERNMENT REGULATIONS PROMOTING SOLAR INVERTERS
- 8.6.1 OVERVIEW
- 8.6.2 REPOWEREU PLAN CONTRIBUTION TO SOLAR PV MARKET GROWTH
- 8.6.3 US INFLATION REDUCTION ACT PROVIDES BENEFITS TO PV INVERTER MARKET
- 8.7 SOLAR PV MARKET STATUS
- 8.7.1 MARKET COMPETITION FOR PV INVERTERS
- 8.7.2 MARKET LIFE DURATION OR PAYBACK PERIOD FOR PV INVERTERS
- 8.7.3 MARKET INITIAL INVESTMENT FOR PV INVERTERS
- 8.8 LEADING PLAYER IN PV INVERTER
- 8.8.1 KEY STRATEGIES BY KEY INDUSTRY PARTICIPANTS
- 8.9 IMPACT OF COVID-19 AND RUSSIA INVASION
- 8.9.1 RUSSIA & UKRAINE GLOBAL IMPACT
- 8.10 VALUE CHAIN
- 8.10.1 RAW MATERIAL SUPPLIERS & COMPONENTS
- 8.10.2 MANUFACTURERS
- 8.10.3 DEALERS/DISTRIBUTORS
- 8.10.4 RETAILERS
- 8.10.5 END-USERS
9 MARKET OPPORTUNITY & TRENDS
- 9.1 REGULATION ON ENERGY EFFICIENCY DRIVING PV INVERTER DEMAND
- 9.2 ADVANCES IN PV INVERTERS IN SMART HOMES
- 9.3 AIRPORT MODERNIZATION
10 MARKET GROWTH ENABLERS
- 10.1 GROWTH OF GREEN BUILDING ACTIVITIES
- 10.2 INCORPORATION OF PHOTOVOLTAIC IN ROOFTOP
- 10.3 SUSTAINABILITY RESHAPING GLOBAL CONSTRUCTION MARKET
- 10.4 INCORPORATION OF ON-SITE PHOTOVOLTAIC SOLAR POWER FOR THE DATA CENTERS MARKET
- 10.4.1 DATA CENTER UTILIZATION OF RENEWABLE ENERGY
11 MARKET RESTRAINTS
- 11.1 HIGH COST OF INSTALLING SOLAR PANELS HAMMER THE DEMAND FOR PV INVERTER
- 11.2 RAW MATERIAL PRICE VOLATILITY
- 11.3 INCREASED COMPETITION FROM CHINESE VENDORS
12 MARKET LANDSCAPE
- 12.1 MARKET OVERVIEW
- 12.2 MARKET SIZE & FORECAST
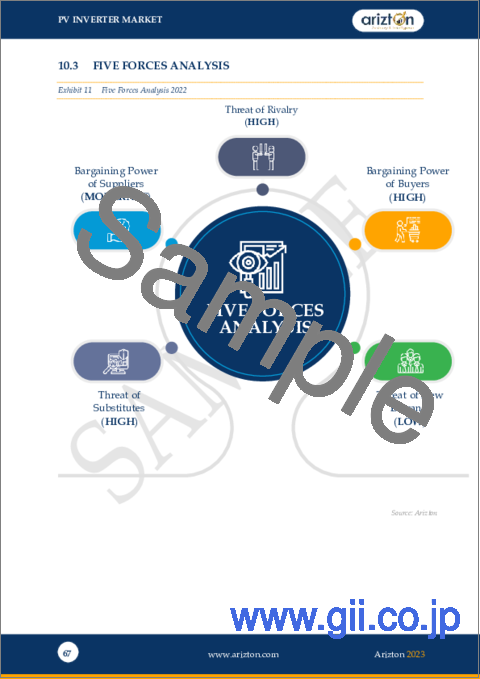
- 12.3 FIVE FORCES ANALYSIS
- 12.3.1 THREAT OF NEW ENTRANTS
- 12.3.2 BARGAINING POWER OF SUPPLIERS
- 12.3.3 BARGAINING POWER OF BUYERS
- 12.3.4 THREAT OF SUBSTITUTES
- 12.3.5 COMPETITIVE RIVALRY
13 PRODUCT TYPE
- 13.1 MARKET SNAPSHOT & GROWTH ENGINE (VALUE)
- 13.1.1 MARKET OVERVIEW
- 13.1.2 STRING INVERTER: MARKET SIZE & FORECAST
- 13.1.3 CENTRAL INVERTER: MARKET SIZE & FORECAST
- 13.1.4 MICRO INVERTER: MARKET SIZE & FORECAST
- 13.1.5 OTHER INVERTER: MARKET SIZE & FORECAST
14 PHASE TYPE
- 14.1 MARKET SNAPSHOT & GROWTH ENGINE (VALUE)
- 14.1.1 MARKET OVERVIEW
- 14.1.2 THREE PHASE: MARKET SIZE & FORECAST
- 14.1.3 SINGLE PHASE: MARKET SIZE & FORECAST
15 CONNECTION TYPE
- 15.1 MARKET SNAPSHOT & GROWTH ENGINE (VALUE)
- 15.1.1 MARKET OVERVIEW
- 15.1.2 ON-GRID: MARKET SIZE & FORECAST
- 15.1.3 OFF GRID: MARKET SIZE & FORECAST
16 POWER OUTPUT TYPE
- 16.1 MARKET SNAPSHOT & GROWTH ENGINE (VALUE)
- 16.1.1 MARKET OVERVIEW
- 16.1.2 <0.5-33 KW POWER OUTPUT: MARKET SIZE & FORECAST
- 16.1.3 33-110 KW POWER OUTPUT: MARKET SIZE & FORECAST
- 16.1.4 >110 KW POWER OUTPUT: MARKET SIZE & FORECAST
17 END-USER
- 17.1 MARKET SNAPSHOT & GROWTH ENGINE
- 17.2 MARKET OVERVIEW
- 17.3 UTILITIES
- 17.3.1 MARKET OVERVIEW
- 17.3.2 MARKET SIZE & FORECAST
- 17.4 COMMERCIAL
- 17.4.1 MARKET OVERVIEW
- 17.4.2 MARKET SIZE & FORECAST
- 17.5 INDUSTRIAL
- 17.5.1 MARKET OVERVIEW
- 17.5.2 MARKET SIZE & FORECAST
- 17.6 RESIDENTIAL
- 17.6.1 MARKET OVERVIEW
- 17.6.2 MARKET SIZE & FORECAST
18 DISTRIBUTION CHANNEL
- 18.1 MARKET SNAPSHOT & GROWTH ENGINE (VALUE)
- 18.2 MARKET OVERVIEW
- 18.3 OFFLINE
- 18.3.1 MARKET OVERVIEW
- 18.3.2 DEALERS & DISTRIBUTORS
- 18.3.3 SPECIALTY STORES
- 18.3.4 MASS MARKET PLAYERS
- 18.3.5 MARKET SIZE & FORECAST (VALUE)
- 18.4 ONLINE
- 18.4.1 MARKET OVERVIEW
- 18.4.2 DIRECT SALES
- 18.4.3 THIRD-PARTY SALES
- 18.4.4 MARKET SIZE & FORECAST (VALUE)
19 GEOGRAPHY
- 19.1 MARKET SNAPSHOT & GROWTH ENGINE (VALUE)
- 19.2 GEOGRAPHY OVERVIEW
20 APAC
- 20.1 MARKET OVERVIEW
- 20.2 MARKET SIZE & FORECAST
- 20.3 PRODUCT TYPE
- 20.3.1 MARKET SIZE & FORECAST
- 20.4 POWER OUTPUT
- 20.4.1 MARKET SIZE & FORECAST
- 20.5 PHASE TYPE
- 20.5.1 MARKET SIZE & FORECAST
- 20.6 CONNECTION TYPE
- 20.6.1 MARKET SIZE & FORECAST
- 20.7 END-USER
- 20.7.1 MARKET SIZE & FORECAST
- 20.8 DISTRIBUTION CHANNEL
- 20.8.1 MARKET SIZE & FORECAST
- 20.9 KEY COUNTRIES
- 20.9.1 CHINA: MARKET SIZE & FORECAST
- 20.9.2 INDIA: MARKET SIZE & FORECAST
- 20.9.3 JAPAN: MARKET SIZE & FORECAST
- 20.9.4 AUSTRALIA: MARKET SIZE & FORECAST
21 NORTH AMERICA
- 21.1 MARKET OVERVIEW
- 21.2 MARKET SIZE & FORECAST
- 21.3 PRODUCT TYPE
- 21.3.1 MARKET SIZE & FORECAST
- 21.4 POWER OUTPUT
- 21.4.1 MARKET SIZE & FORECAST
- 21.5 PHASE TYPE
- 21.5.1 MARKET SIZE & FORECAST
- 21.6 CONNECTION TYPE
- 21.6.1 MARKET SIZE & FORECAST
- 21.7 END-USER
- 21.7.1 MARKET SIZE & FORECAST
- 21.8 DISTRIBUTION CHANNEL
- 21.8.1 MARKET SIZE & FORECAST
- 21.9 KEY COUNTRIES
- 21.9.1 US: MARKET SIZE & FORECAST
- 21.9.2 CANADA: MARKET SIZE & FORECAST
22 EUROPE
- 22.1 MARKET OVERVIEW
- 22.2 MARKET SIZE & FORECAST
- 22.3 PRODUCT TYPE
- 22.3.1 MARKET SIZE & FORECAST
- 22.4 POWER OUTPUT
- 22.4.1 MARKET SIZE & FORECAST
- 22.5 PHASE TYPE
- 22.5.1 MARKET SIZE & FORECAST
- 22.6 CONNECTION TYPE
- 22.6.1 MARKET SIZE & FORECAST
- 22.7 END-USER
- 22.7.1 MARKET SIZE & FORECAST
- 22.8 DISTRIBUTION CHANNEL
- 22.8.1 MARKET SIZE & FORECAST
- 22.9 KEY COUNTRIES
- 22.9.1 GERMANY: MARKET SIZE & FORECAST
- 22.9.2 FRANCE: MARKET SIZE & FORECAST
- 22.9.3 UK: MARKET SIZE & FORECAST
- 22.9.4 ITALY: MARKET SIZE & FORECAST
- 22.9.5 SPAIN: MARKET SIZE & FORECAST
23 MEA
- 23.1 MARKET OVERVIEW
- 23.2 MARKET SIZE & FORECAST
- 23.3 PRODUCT TYPE
- 23.3.1 MARKET SIZE & FORECAST
- 23.4 POWER OUTPUT
- 23.4.1 MARKET SIZE & FORECAST
- 23.5 PHASE TYPE
- 23.5.1 MARKET SIZE & FORECAST
- 23.6 CONNECTION TYPE
- 23.6.1 MARKET SIZE & FORECAST
- 23.7 END-USER
- 23.7.1 MARKET SIZE & FORECAST
- 23.8 DISTRIBUTION CHANNEL
- 23.8.1 MARKET SIZE & FORECAST
- 23.9 KEY COUNTRIES
- 23.9.1 SAUDI ARABIA: MARKET SIZE & FORECAST
- 23.9.2 UAE: MARKET SIZE & FORECAST
- 23.9.3 SOUTH AFRICA: MARKET SIZE & FORECAST
24 LATIN AMERICA
- 24.1 MARKET OVERVIEW
- 24.2 MARKET SIZE & FORECAST
- 24.3 PRODUCT TYPE
- 24.3.1 MARKET SIZE & FORECAST
- 24.4 POWER OUTPUT
- 24.4.1 MARKET SIZE & FORECAST
- 24.5 PHASE TYPE
- 24.5.1 MARKET SIZE & FORECAST
- 24.6 CONNECTION TYPE
- 24.6.1 MARKET SIZE & FORECAST
- 24.7 END-USER
- 24.7.1 MARKET SIZE & FORECAST
- 24.8 DISTRIBUTION CHANNEL
- 24.8.1 MARKET SIZE & FORECAST
- 24.9 KEY COUNTRIES
- 24.9.1 BRAZIL: MARKET SIZE & FORECAST
- 24.9.2 MEXICO: MARKET SIZE & FORECAST
- 24.9.3 ARGENTINA: MARKET SIZE & FORECAST
25 COMPETITIVE LANDSCAPE
- 25.1 COMPETITION OVERVIEW
26 KEY COMPANY PROFILES
- 26.1 SMA SOLAR TECHNOLOGY AG
- 26.1.1 BUSINESS OVERVIEW
- 26.1.2 PRODUCT OFFERINGS
- 26.1.3 KEY STRATEGIES
- 26.1.4 KEY STRENGTHS
- 26.1.5 KEY OPPORTUNITIES
- 26.2 SUNGROW
- 26.2.1 BUSINESS OVERVIEW
- 26.2.2 PRODUCT OFFERINGS
- 26.2.3 KEY STRATEGIES
- 26.2.4 KEY STRENGTHS
- 26.2.5 KEY OPPORTUNITIES
- 26.3 SIEMENS AG
- 26.3.1 BUSINESS OVERVIEW
- 26.3.2 PRODUCT OFFERINGS
- 26.3.3 KEY STRATEGIES
- 26.3.4 KEY STRENGTHS
- 26.3.5 KEY OPPORTUNITIES
- 26.4 DELTA ELECTRONICS, INC
- 26.4.1 BUSINESS OVERVIEW
- 26.4.2 PRODUCT OFFERINGS
- 26.4.3 KEY STRATEGIES
- 26.4.4 KEY STRENGTHS
- 26.4.5 KEY OPPORTUNITIES
- 26.5 SOLAREDGE TECHNOLOGIES, INC.
- 26.5.1 BUSINESS OVERVIEW
- 26.5.2 PRODUCT OFFERINGS
- 26.5.3 KEY STRATEGIES
- 26.5.4 KEY STRENGTHS
- 26.5.5 KEY OPPORTUNITIES
- 26.6 HUAWEI TECHNOLOGIES CO
- 26.6.1 BUSINESS OVERVIEW
- 26.6.2 PRODUCT OFFERINGS
- 26.6.3 KEY STRATEGIES
- 26.6.4 KEY STRENGTHS
- 26.6.5 KEY OPPORTUNITIES
27 OTHER PROMINENT VENDORS
- 27.1 FIMER GROUP
- 27.1.1 BUSINESS OVERVIEW
- 27.1.2 PRODUCT OFFERINGS
- 27.2 EMERSON ELECTRIC CO.
- 27.2.1 BUSINESS OVERVIEW
- 27.2.2 PRODUCT OFFERINGS
- 27.3 GINLONG TECHNOLOGIES
- 27.3.1 BUSINESS OVERVIEW
- 27.3.2 PRODUCT OFFERINGS
- 27.4 POWER ELECTRONICS S.L
- 27.4.1 BUSINESS OVERVIEW
- 27.4.2 PRODUCT OFFERINGS
- 27.5 HITACHI HI-REL POWER ELECTRONICS PVT. LTD
- 27.5.1 BUSINESS OVERVIEW
- 27.5.2 PRODUCT OFFERINGS
- 27.6 BOSCH
- 27.6.1 BUSINESS OVERVIEW
- 27.6.2 PRODUCT OFFERINGS
- 27.7 SUNPOWER CORPORATION
- 27.7.1 BUSINESS OVERVIEW
- 27.7.2 PRODUCT OFFERINGS
- 27.8 SAMSUNG
- 27.8.1 BUSINESS OVERVIEW
- 27.8.2 PRODUCT OFFERINGS
- 27.9 JOHNSON CONTROLS
- 27.9.1 BUSINESS OVERVIEW
- 27.9.2 PRODUCT OFFERINGS
- 27.10 PANASONIC
- 27.10.1 BUSINESS OVERVIEW
- 27.10.2 PRODUCT OFFERINGS
- 27.11 FRONIUS INTERNATIONAL GMBH
- 27.11.1 BUSINESS OVERVIEW
- 27.11.2 PRODUCT OFFERINGS
- 27.12 LENNOX
- 27.12.1 BUSINESS OVERVIEW
- 27.12.2 PRODUCT OFFERINGS
- 27.13 TSI INCORPORATED
- 27.13.1 BUSINESS OVERVIEW
- 27.13.2 PRODUCT OFFERINGS
- 27.14 ENERTRONICA SANTERNO S.P.A
- 27.14.1 BUSINESS OVERVIEW
- 27.14.2 PRODUCT OFFERINGS
28 REPORT SUMMARY
- 28.1 KEY TAKEAWAYS
- 28.2 STRATEGIC RECOMMENDATIONS
29 QUANTITATIVE SUMMARY
- 29.1 MARKET BY GEOGRAPHY
- 29.1.1 MARKET SIZE & FORECAST
- 29.2 MARKET BY PRODUCT TYPE
- 29.2.1 MARKET SIZE & FORECAST
- 29.3 MARKET BY POWER OUTPUT
- 29.3.1 MARKET SIZE & FORECAST
- 29.4 MARKET BY PHASE TYPE
- 29.4.1 MARKET SIZE & FORECAST
- 29.5 MARKET BY CONNECTION TYPE
- 29.5.1 MARKET SIZE & FORECAST
- 29.6 MARKET BY END USER
- 29.6.1 MARKET SIZE & FORECAST
- 29.7 MARKET BY DISTRIBUTION CHANNEL
- 29.7.1 MARKET SIZE & FORECAST
30 APPENDIX
- 30.1 ABBREVIATIONS