|
|
市場調査レポート
商品コード
1605746
オペアンプ市場:タイプ別、技術別、パッケージタイプ別、用途別、国別、地域別 - 産業分析、市場規模、市場シェア、予測、2024年~2032年Operational Amplifiers (Op-Amps) Market, By Type, By Technology, By Package Type, By Application, By Country, and By Region - Industry Analysis, Market Size, Market Share & Forecast from 2024-2032 |
||||||
|
|||||||
カスタマイズ可能
|
|||||||

| オペアンプ市場:タイプ別、技術別、パッケージタイプ別、用途別、国別、地域別 - 産業分析、市場規模、市場シェア、予測、2024年~2032年 |
|
出版日: 2024年11月28日
発行: AnalystView Market Insights
ページ情報: 英文 390 Pages
納期: 2~3営業日
|

全表示
- 概要
- 目次
レポートハイライト
オペアンプ市場規模は2023年に81億2,300万米ドルとなり、2024年から2032年にかけてCAGR 6.8%で拡大
オペアンプ市場力学
家庭用電子機器の需要増がオペアンプ市場の成長を後押し
スマートフォンやウェアラブルデバイスを中心とした家庭用電子機器の需要増加が、オペアンプ市場の成長を後押ししています。エレクトロニクス産業の拡大に伴い、テキサス・インスツルメンツやアナログ・デバイセズなどの企業は、低消費電力でコンパクトな設計という進化するニーズに対応するため、高性能オペアンプで技術革新を進めています。2022年には、モバイル技術の進歩やフィットネストラッカーやスマートウォッチの人気の高まりなどを主な原動力として、家庭用電子機器分野が世界のオペアンプ売上高の大部分を占めました。例えば、アップルやサムスンなどの企業は、オーディオやセンサー技術をサポートするため、次世代デバイスにオペアンプをより多く組み込んでいます。2021年時点で、ウェアラブル市場は500億米ドル以上と評価されており、この動向はコンパクトな用途における信頼性と効率の高いオペアンプの必要性をさらに高めると予想されます。このシフトは、メーカーが新たな市場とイノベーションを開発する機会を開いています。
オペアンプ市場:主要インサイト
調査アナリストの分析によると、世界市場は予測期間(2024-2032年)に約6.8%のCAGRで年間成長すると予測されています。
タイプ別では、ローパワーオペアンプが2023年に最大市場シェアを占めると予測
技術別では、2023年にCMOSオペアンプが主要タイプに
パッケージタイプ別では、2023年に表面実装デバイス(SMD)が主要タイプに
地域別では、北米が2023年の売上高でトップ
オペアンプ市場-セグメンテーション分析:
オペアンプの世界市場は、タイプ、技術、パッケージタイプ、用途、地域によって区分されます。
市場はタイプによって4つに分類される:低消費電力オペアンプ、高速オペアンプ、高精度オペアンプ、計測用オペアンプです。高精度オペアンプは、産業用および家庭用電子機器用途での精度の高さから、主要セグメントとなっています。高速オペアンプは、高周波用途をサポートし、僅差で続いています。ローパワーオペアンプは、エネルギー効率の高い機器向けに人気を集めており、計測用オペアンプは特殊な計測システムに対応しています。
市場は、技術別に3つのカテゴリーに分類される:バイポーラオペアンプ、CMOSオペアンプ、BiCMOSオペアンプです。CMOSオペアンプは、消費電力が低く、さまざまな用途で費用対効果が高いため、市場を独占しています。BiCMOSオペアンプは、バイポーラ技術とCMOS技術の両方の利点を兼ね備えています。バイポーラ・オペアンプは、高性能で高精度な用途に適しています。
オペアンプ市場:地域別インサイト
北米は、家電、自動車、通信などの業界からの旺盛な需要に牽引され、現在オペアンプ市場をリードしています。特に米国とカナダの技術進歩が成長を促進しています。2023年、テキサス・インスツルメンツは電気自動車用に設計された高精度オペアンプの新シリーズを発売し、自動車分野におけるエネルギー効率の高いソリューション需要の高まりを後押ししました。さらに、北米ではアナログ・デバイセズやマキシム・インテグレーテッドといった大手半導体メーカーのプレゼンスが拡大しており、地域市場の強化につながっています。アジア太平洋では、中国と日本も重要なプレーヤーであり、電子機器製造における優位性と、スマートフォン、IoT機器、家電製品におけるオペアンプの採用増加により、市場の拡大に貢献しています。この地域の需要は、エレクトロニクスの技術革新とスマートシティプロジェクトに焦点を当てた政府の取り組みによってさらに強化されており、十分な成長機会を提供しています。アジアの大規模な生産能力は、オペアンプ供給の重要なハブとなっています。
オペアンプ市場:競合情勢:
オペアンプ市場の競合情勢は、テキサス・インスツルメンツ、アナログ・デバイセズ、マキシム・インテグレーテッド、STマイクロエレクトロニクスなどの主要企業が占めています。北米は依然として主要地域であり、これらの企業は家庭用電子機器や自動車分野からの需要増に対応するため、継続的に技術革新を行っています。2023年、テキサス・インスツルメンツは、エネルギー効率の高い車載用途、特に電気自動車向けに設計された最新のオペアンプ・シリーズを発表しました。また、アナログ・デバイセズ社はリニアテクノロジー社を買収して事業領域を拡大し、市場での地位をさらに強化するとともに、高性能オペアンプのポートフォリオを進化させました。一方、アジア太平洋地域では、オン・セミコンダクターやNXPセミコンダクターズなどの企業が、スマートフォン、産業用オートメーション、IoT機器におけるオペアンプの需要拡大に乗じています。これらの企業は、研究開発への戦略的投資を行い、製品ラインナップを拡大するために協力関係を結んでいます。継続的な技術革新と合併・買収により、競争が激化し、市場の成長が世界的に加速すると予想されます。
目次
第1章 オペアンプ市場概要
- 調査範囲
- 市場推定年
第2章 エグゼクティブサマリー
- 市場内訳
- 競合考察
第3章 オペアンプの主要市場動向
- 市場促進要因
- 市場抑制要因
- 市場機会
- 市場の将来動向
第4章 オペアンプ業界調査
- PEST分析
- ポーターのファイブフォース分析
- 成長見通しマッピング
- 規制枠組み分析
第5章 オペアンプ市場: COVID-19の影響分析
- COVID-19以前の影響分析
- COVID-19後の影響分析
第6章 オペアンプ市場情勢
- オペアンプ市場シェア分析、2023年
- 主要メーカー別内訳データ
- 既存企業の分析
- 新興企業の分析
第7章 オペアンプ市場- タイプ別
- 概要
- セグメントシェア分析
- 低消費電力オペアンプ
- 高速オペアンプ
- 高精度オペアンプ
- 計装用オペアンプ
第8章 オペアンプ市場- 技術別
- 概要
- セグメントシェア分析
- バイポーラオペアンプ
- CMOSオペアンプ
- BiCMOSオペアンプ
第9章 オペアンプ市場- パッケージタイプ別
- 概要
- セグメントシェア分析
- 表面実装デバイス(SMD)
- スルーホールデバイス(THD)
第10章 オペアンプ市場- 用途別
- 概要
- セグメントシェア分析
- 家電
- 自動車エレクトロニクス
- 通信システム
- 産業オートメーション
第11章 オペアンプ市場-地域別
- イントロダクション
- 北米
- 概要
- 北米の主要メーカー
- 米国
- カナダ
- 欧州
- 概要
- 欧州の主要メーカー
- ドイツ
- イタリア
- 英国
- フランス
- ロシア
- オランダ
- スウェーデン
- ポーランド
- その他
- アジア太平洋地域
- 概要
- アジア太平洋地域の主要メーカー
- インド
- 中国
- 日本
- 韓国
- オーストラリア
- タイ
- インドネシア
- フィリピン
- その他
- ラテンアメリカ
- 概要
- ラテンアメリカの主要メーカー
- ブラジル
- メキシコ
- アルゼンチン
- コロンビア
- その他
- 中東およびアフリカ
- 概要
- 中東・アフリカの主要メーカー
- サウジアラビア
- アラブ首長国連邦
- イスラエル
- トルコ
- アルジェリア
- エジプト
- その他
第12章 主要ベンダー分析- オペアンプ業界
- 競合ダッシュボード
- 企業プロファイル
- Analog Devices Inc.
- Broadcom Inc.
- Cirrus Logic, Inc.
- Fairchild Semiconductor(now part of ON Semiconductor)
- Infineon Technologies AG
- Intersil Corporation(now part of Renesas)
- Linear Technology Corporation(now part of Analog Devices)
- Maxim Integrated
- Microchip Technology Inc.
- NXP Semiconductors NV
- ON Semiconductor Corporation
- ROHM Semiconductor
- STMicroelectronics
- TDK Corporation
- Texas Instruments Inc.
- Vishay Intertechnology, Inc.
- Others
第13章 アナリストの全方位展望
REPORT HIGHLIGHT
Operational Amplifiers (Op-Amps) Market size was valued at USD 8,123 Million in 2023, expanding at a CAGR of 6.8% from 2024 to 2032.
The operational amplifiers (Op-Amps) market encompasses a wide range of applications, particularly in the electronics and telecommunications industries, where Op-Amps are used for signal amplification, filtering, and voltage regulation. These components are crucial in devices such as audio equipment, medical devices, and automotive electronics. Increasing demand for consumer electronics, particularly smartphones and wearables, along with advancements in automotive and healthcare technologies, has significantly boosted the Op-Amp market. For example, the adoption of Op-Amps in electric vehicles (EVs) and autonomous driving systems is contributing to market growth. On the other hand, the high cost of precision Op-Amps and the increasing complexity of designs pose challenges. However, the rising demand for low-power, high-performance Op-Amps, especially in Internet of Things (IoT) applications, presents significant opportunities. For instance, in 2023, Texas Instruments launched a new series of low-power Op-Amps aimed at IoT devices, enhancing their battery life while maintaining high performance.
Operational Amplifiers (Op-Amps) Market- Market Dynamics
Rising Demand for Consumer Electronics Boosts Growth in the Operational Amplifiers (Op-Amps) Market
The increasing demand for consumer electronics, particularly smartphones and wearable devices, is propelling growth in the Operational Amplifiers (Op-Amps) market. As the electronics industry expands, companies like Texas Instruments and Analog Devices are innovating with high-performance op-amps to meet the evolving needs of low-power and compact designs. In 2022, the consumer electronics segment accounted for a significant portion of global op-amp sales, with key drivers such as advancements in mobile technology and the growing popularity of fitness trackers and smartwatches. For instance, companies like Apple and Samsung are incorporating more op-amps into their next-generation devices to support audio and sensor technologies. As of 2021, the wearables market was valued at over USD 50 billion, a trend expected to further fuel the need for reliable and efficient op-amps in compact applications. This shift is opening up opportunities for manufacturers to tap into new markets and innovations.
Operational Amplifiers (Op-Amps) Market- Key Insights
As per the analysis shared by our research analyst, the global market is estimated to grow annually at a CAGR of around 6.8% over the forecast period (2024-2032)
Based on Type segmentation, Low Power Operational Amplifiers were predicted to show maximum market share in the year 2023
Based on Technology segmentation, CMOS Operational Amplifiers were the leading type in 2023
Based on Package Type segmentation, Surface-Mount Devices (SMD) was the leading type in 2023
On the basis of region, North America was the leading revenue generator in 2023
Operational Amplifiers (Op-Amps) Market- Segmentation Analysis:
The Global Operational Amplifiers (Op-Amps) Market is segmented on the basis of Type, Technology, Package Type, Application, and Region.
The market is divided into four categories based on Type: Low Power Operational Amplifiers, High-Speed Operational Amplifiers, Precision Operational Amplifiers, and Instrumentation Operational Amplifiers. Precision Operational Amplifiers are the leading segment due to their accuracy in industrial and consumer electronics applications. High-Speed Operational Amplifiers follow closely, supporting high-frequency applications. Low Power Operational Amplifiers are gaining traction for energy-efficient devices, while Instrumentation Operational Amplifiers cater to specialized measurement systems.
The market is divided into three categories based on Technology: Bipolar Operational Amplifiers, CMOS Operational Amplifiers, and BiCMOS Operational Amplifiers. CMOS Operational Amplifiers dominate the market due to their low power consumption and cost-effectiveness in a variety of applications. BiCMOS Operational Amplifiers follow closely, combining the benefits of both bipolar and CMOS technologies. Bipolar Operational Amplifiers are preferred in high-performance and precision applications.
Operational Amplifiers (Op-Amps) Market- Geographical Insights
North America is currently leading the Operational Amplifiers (Op-Amps) market, driven by robust demand from industries such as consumer electronics, automotive, and telecommunications. The region's technological advancements, particularly in the U.S. and Canada, are fostering growth. In 2023, Texas Instruments launched a new series of high-precision op-amps designed for use in electric vehicles, supporting the rising demand for energy-efficient solutions in the automotive sector. Furthermore, the expanding presence of major semiconductor manufacturers such as Analog Devices and Maxim Integrated in North America is strengthening the regional market. In Asia-Pacific, China and Japan are also significant players, contributing to the growing market due to their dominance in electronics manufacturing and increasing adoption of op-amps in smartphones, IoT devices, and consumer electronics. The region's demand is further bolstered by government initiatives focused on electronics innovation and smart city projects, providing ample growth opportunities. Asia's large-scale production capacity continues to make it a critical hub for op-amp supply.
Operational Amplifiers (Op-Amps) Market- Competitive Landscape:
The competitive landscape of the Operational Amplifiers (Op-Amps) market is dominated by key players such as Texas Instruments, Analog Devices, Maxim Integrated, and STMicroelectronics. North America remains the leading region, with these companies continuously innovating to meet the increasing demand from consumer electronics and automotive sectors. In 2023, Texas Instruments unveiled its latest op-amp series designed for energy-efficient automotive applications, specifically for electric vehicles. Additionally, Analog Devices expanded its reach by acquiring Linear Technology, further strengthening its market position and advancing its portfolio of high-performance op-amps. Meanwhile, in the Asia-Pacific region, companies like ON Semiconductor and NXP Semiconductors are capitalizing on the growing demand for op-amps in smartphones, industrial automation, and IoT devices. These companies are making strategic investments in research and development and forming collaborations to expand their product offerings. The continuous innovation, along with mergers and acquisitions, is expected to intensify competition and accelerate market growth globally.
Recent Developments:
In June 2024, STMicroelectronics launched the TSB952 dual operational amplifier, featuring a 52MHz gain-bandwidth and a supply current of 3.3mA per channel at 36V. Designed for industrial and automotive applications, it offers high performance and flexibility with a wide supply range and robust features.
In August 2024, ROHM introduced the industry's smallest CMOS operational amplifier, the BH1792GLC. This ultra-compact op-amp is designed for portable devices, featuring low power consumption and high performance, making it ideal for applications in wearable technology and other space-constrained environments.
SCOPE OF THE REPORT
The scope of this report covers the market by its major segments, which include as follows:
GLOBAL OPERATIONAL AMPLIFIERS (OP-AMPS) MARKET KEY PLAYERS- DETAILED COMPETITIVE INSIGHTS
- Analog Devices Inc.
- Broadcom Inc.
- Cirrus Logic, Inc.
- Fairchild Semiconductor (now part of ON Semiconductor)
- Infineon Technologies AG
- Intersil Corporation (now part of Renesas)
- Linear Technology Corporation (now part of Analog Devices)
- Maxim Integrated
- Microchip Technology Inc.
- NXP Semiconductors N.V.
- ON Semiconductor Corporation
- ROHM Semiconductor
- STMicroelectronics
- TDK Corporation
- Texas Instruments Inc.
- Vishay Intertechnology, Inc.
- Others
GLOBAL OPERATIONAL AMPLIFIERS (OP-AMPS) MARKET, BY TYPE- MARKET ANALYSIS, 2019 - 2032
- Low Power Operational Amplifiers
- High Speed Operational Amplifiers
- Precision Operational Amplifiers
- Instrumentation Operational Amplifiers
GLOBAL OPERATIONAL AMPLIFIERS (OP-AMPS) MARKET, BY TECHNOLOGY- MARKET ANALYSIS, 2019 - 2032
- Bipolar Operational Amplifiers
- CMOS Operational Amplifiers
- BiCMOS Operational Amplifiers
GLOBAL OPERATIONAL AMPLIFIERS (OP-AMPS) MARKET, BY PACKAGE TYPE- MARKET ANALYSIS, 2019 - 2032
- Surface-Mount Devices (SMD)
- Through-Hole Devices (THD)
GLOBAL OPERATIONAL AMPLIFIERS (OP-AMPS) MARKET, BY APPLICATION- MARKET ANALYSIS, 2019 - 2032
- Consumer Electronics
- Automotive Electronics
- Communication Systems
- Industrial Automation
GLOBAL OPERATIONAL AMPLIFIERS (OP-AMPS) MARKET, BY REGION- MARKET ANALYSIS, 2019 - 2032
- North America
- The U.S.
- Canada
- Europe
- Germany
- France
- Italy
- Spain
- United Kingdom
- Russia
- Netherlands
- Sweden
- Poland
- Rest of Europe
- Asia Pacific
- India
- China
- South Korea
- Japan
- Australia
- Thailand
- Indonesia
- Philippines
- Rest of APAC
- Latin America
- Brazil
- Mexico
- Argentina
- Colombia
- Rest of LATAM
- The Middle East and Africa
- Saudi Arabia
- United Arab Emirates
- Israel
- Turkey
- Algeria
- Egypt
- Rest of MEA
Table of Contents
1. Operational Amplifiers (Op-Amps) Market Overview
- 1.1. Study Scope
- 1.2. Market Estimation Years
2. Executive Summary
- 2.1. Market Snippet
- 2.1.1. Operational Amplifiers (Op-Amps) Market Snippet by Type
- 2.1.2. Operational Amplifiers (Op-Amps) Market Snippet by Technology
- 2.1.3. Operational Amplifiers (Op-Amps) Market Snippet by Package Type
- 2.1.4. Operational Amplifiers (Op-Amps) Market Snippet by Application
- 2.1.5. Operational Amplifiers (Op-Amps) Market Snippet by Country
- 2.1.6. Operational Amplifiers (Op-Amps) Market Snippet by Region
- 2.2. Competitive Insights
3. Operational Amplifiers (Op-Amps) Key Market Trends
- 3.1. Operational Amplifiers (Op-Amps) Market Drivers
- 3.1.1. Impact Analysis of Market Drivers
- 3.2. Operational Amplifiers (Op-Amps) Market Restraints
- 3.2.1. Impact Analysis of Market Restraints
- 3.3. Operational Amplifiers (Op-Amps) Market Opportunities
- 3.4. Operational Amplifiers (Op-Amps) Market Future Trends
4. Operational Amplifiers (Op-Amps) Industry Study
- 4.1. PEST Analysis
- 4.2. Porter's Five Forces Analysis
- 4.3. Growth Prospect Mapping
- 4.4. Regulatory Framework Analysis
5. Operational Amplifiers (Op-Amps) Market: COVID-19 Impact Analysis
- 5.1. Pre-COVID-19 Impact Analysis
- 5.2. Post-COVID-19 Impact Analysis
- 5.2.1. Top Performing Segments
- 5.2.2. Marginal Growth Segments
- 5.2.3. Top Looser Segments
- 5.2.4. Marginal Loss Segments
6. Operational Amplifiers (Op-Amps) Market Landscape
- 6.1. Operational Amplifiers (Op-Amps) Market Share Analysis, 2023
- 6.2. Breakdown Data, by Key Manufacturer
- 6.2.1. Established Players' Analysis
- 6.2.2. Emerging Players' Analysis
7. Operational Amplifiers (Op-Amps) Market - By Type
- 7.1. Overview
- 7.1.1. Segment Share Analysis, By Type, 2023 & 2032 (%)
- 7.1.2. Low Power Operational Amplifiers
- 7.1.3. High Speed Operational Amplifiers
- 7.1.4. Precision Operational Amplifiers
- 7.1.5. Instrumentation Operational Amplifiers
8. Operational Amplifiers (Op-Amps) Market - By Technology
- 8.1. Overview
- 8.1.1. Segment Share Analysis, By Technology, 2023 & 2032 (%)
- 8.1.2. Bipolar Operational Amplifiers
- 8.1.3. CMOS Operational Amplifiers
- 8.1.4. BiCMOS Operational Amplifiers
9. Operational Amplifiers (Op-Amps) Market - By Package Type
- 9.1. Overview
- 9.1.1. Segment Share Analysis, By Package Type, 2023 & 2032 (%)
- 9.1.2. Surface-Mount Devices (SMD)
- 9.1.3. Through-Hole Devices (THD)
10. Operational Amplifiers (Op-Amps) Market - By Application
- 10.1. Overview
- 10.1.1. Segment Share Analysis, By Application, 2023 & 2032 (%)
- 10.1.2. Consumer Electronics
- 10.1.3. Automotive Electronics
- 10.1.4. Communication Systems
- 10.1.5. Industrial Automation
11. Operational Amplifiers (Op-Amps) Market- By Geography
- 11.1. Introduction
- 11.1.1. Segment Share Analysis, By Geography, 2023 & 2032 (%)
- 11.2. North America
- 11.2.1. Overview
- 11.2.2. Operational Amplifiers (Op-Amps) Key Manufacturers in North America
- 11.2.3. North America Market Size and Forecast, By Country, 2019 - 2032 (US$ Million)
- 11.2.4. North America Market Size and Forecast, By Type, 2019 - 2032 (US$ Million)
- 11.2.5. North America Market Size and Forecast, By Technology, 2019 - 2032 (US$ Million)
- 11.2.6. North America Market Size and Forecast, By Package Type, 2019 - 2032 (US$ Million)
- 11.2.7. North America Market Size and Forecast, By Application, 2019 - 2032 (US$ Million)
- 11.2.8. U.S.
- 11.2.8.1. Overview
- 11.2.8.2. Market Analysis, Forecast, and Y-O-Y Growth Rate, 2019 - 2032, (US$ Million)
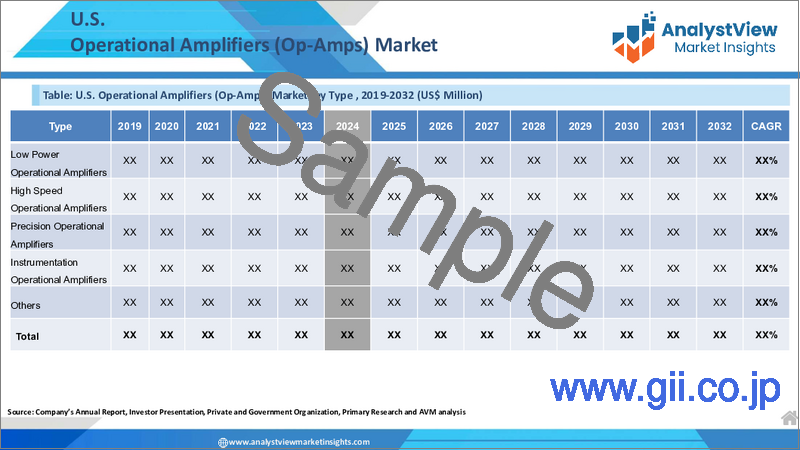
- 11.2.8.3. U.S. Market Size and Forecast, By Type, 2019 - 2032 (US$ Million)
- 11.2.8.4. U.S. Market Size and Forecast, By Technology, 2019 - 2032 (US$ Million)
- 11.2.8.5. U.S. Market Size and Forecast, By Package Type, 2019 - 2032 (US$ Million)
- 11.2.8.6. U.S. Market Size and Forecast, By Application, 2019 - 2032 (US$ Million)
- 11.2.9. Canada
- 11.2.9.1. Overview
- 11.2.9.2. Market Analysis, Forecast, and Y-O-Y Growth Rate, 2019 - 2032, (US$ Million)
- 11.2.9.3. Canada Market Size and Forecast, By Type, 2019 - 2032 (US$ Million)
- 11.2.9.4. Canada Market Size and Forecast, By Technology, 2019 - 2032 (US$ Million)
- 11.2.9.5. Canada Market Size and Forecast, By Package Type, 2019 - 2032 (US$ Million)
- 11.2.9.6. Canada Market Size and Forecast, By Application, 2019 - 2032 (US$ Million)
- 11.3. Europe
- 11.3.1. Overview
- 11.3.2. Operational Amplifiers (Op-Amps) Key Manufacturers in Europe
- 11.3.3. Europe Market Size and Forecast, By Country, 2019 - 2032 (US$ Million)
- 11.3.4. Europe Market Size and Forecast, By Type, 2019 - 2032 (US$ Million)
- 11.3.5. Europe Market Size and Forecast, By Technology, 2019 - 2032 (US$ Million)
- 11.3.6. Europe Market Size and Forecast, By Package Type, 2019 - 2032 (US$ Million)
- 11.3.7. Europe Market Size and Forecast, By Application, 2019 - 2032 (US$ Million)
- 11.3.8. Germany
- 11.3.8.1. Overview
- 11.3.8.2. Market Analysis, Forecast, and Y-O-Y Growth Rate, 2019 - 2032, (US$ Million)
- 11.3.8.3. Germany Market Size and Forecast, By Type, 2019 - 2032 (US$ Million)
- 11.3.8.4. Germany Market Size and Forecast, By Technology, 2019 - 2032 (US$ Million)
- 11.3.8.5. Germany Market Size and Forecast, By Package Type, 2019 - 2032 (US$ Million)
- 11.3.8.6. Germany Market Size and Forecast, By Application, 2019 - 2032 (US$ Million)
- 11.3.9. Italy
- 11.3.9.1. Overview
- 11.3.9.2. Market Analysis, Forecast, and Y-O-Y Growth Rate, 2019 - 2032, (US$ Million)
- 11.3.9.3. Italy Market Size and Forecast, By Type, 2019 - 2032 (US$ Million)
- 11.3.9.4. Italy Market Size and Forecast, By Technology, 2019 - 2032 (US$ Million)
- 11.3.9.5. Italy Market Size and Forecast, By Package Type, 2019 - 2032 (US$ Million)
- 11.3.9.6. Italy Market Size and Forecast, By Application, 2019 - 2032 (US$ Million)
- 11.3.10. United Kingdom
- 11.3.10.1. Overview
- 11.3.10.2. Market Analysis, Forecast, and Y-O-Y Growth Rate, 2019 - 2032, (US$ Million)
- 11.3.10.3. United Kingdom Market Size and Forecast, By Type, 2019 - 2032 (US$ Million)
- 11.3.10.4. United Kingdom Market Size and Forecast, By Technology, 2019 - 2032 (US$ Million)
- 11.3.10.5. United Kingdom Market Size and Forecast, By Package Type, 2019 - 2032 (US$ Million)
- 11.3.10.6. United Kingdom Market Size and Forecast, By Application, 2019 - 2032 (US$ Million)
- 11.3.11. France
- 11.3.11.1. Overview
- 11.3.11.2. Market Analysis, Forecast, and Y-O-Y Growth Rate, 2019 - 2032, (US$ Million)
- 11.3.11.3. France Market Size and Forecast, By Type, 2019 - 2032 (US$ Million)
- 11.3.11.4. France Market Size and Forecast, By Technology, 2019 - 2032 (US$ Million)
- 11.3.11.5. France Market Size and Forecast, By Package Type, 2019 - 2032 (US$ Million)
- 11.3.11.6. France Market Size and Forecast, By Application, 2019 - 2032 (US$ Million)
- 11.3.12. Russia
- 11.3.12.1. Market Analysis, Forecast, and Y-O-Y Growth Rate, 2019 - 2032, (US$ Million)
- 11.3.12.2. Russia Market Size and Forecast, By Type, 2019 - 2032 (US$ Million)
- 11.3.12.3. Russia Market Size and Forecast, By Technology, 2019 - 2032 (US$ Million)
- 11.3.12.4. Russia Market Size and Forecast, By Package Type, 2019 - 2032 (US$ Million)
- 11.3.12.5. Russia Market Size and Forecast, By Application, 2019 - 2032 (US$ Million)
- 11.3.13. Netherlands
- 11.3.13.1. Market Analysis, Forecast, and Y-O-Y Growth Rate, 2019 - 2032, (US$ Million)
- 11.3.13.2. Netherlands Market Size and Forecast, By Type, 2019 - 2032 (US$ Million)
- 11.3.13.3. Netherlands Market Size and Forecast, By Technology, 2019 - 2032 (US$ Million)
- 11.3.13.4. Netherlands Market Size and Forecast, By Package Type, 2019 - 2032 (US$ Million)
- 11.3.13.5. Netherlands Market Size and Forecast, By Application, 2019 - 2032 (US$ Million)
- 11.3.14. Sweden
- 11.3.14.1. Market Analysis, Forecast, and Y-O-Y Growth Rate, 2019 - 2032, (US$ Million)
- 11.3.14.2. Sweden Market Size and Forecast, By Type, 2019 - 2032 (US$ Million)
- 11.3.14.3. Sweden Market Size and Forecast, By Technology, 2019 - 2032 (US$ Million)
- 11.3.14.4. Sweden Market Size and Forecast, By Package Type, 2019 - 2032 (US$ Million)
- 11.3.14.5. Sweden Market Size and Forecast, By Application, 2019 - 2032 (US$ Million)
- 11.3.15. Poland
- 11.3.15.1. Market Analysis, Forecast, and Y-O-Y Growth Rate, 2019 - 2032, (US$ Million)
- 11.3.15.2. Poland Market Size and Forecast, By Type, 2019 - 2032 (US$ Million)
- 11.3.15.3. Poland Market Size and Forecast, By Technology, 2019 - 2032 (US$ Million)
- 11.3.15.4. Poland Market Size and Forecast, By Package Type, 2019 - 2032 (US$ Million)
- 11.3.15.5. Poland Market Size and Forecast, By Application, 2019 - 2032 (US$ Million)
- 11.3.16. Rest of Europe
- 11.3.16.1. Overview
- 11.3.16.2. Market Analysis, Forecast, and Y-O-Y Growth Rate, 2019 - 2032, (US$ Million)
- 11.3.16.3. Rest of the Europe Market Size and Forecast, By Type, 2019 - 2032 (US$ Million)
- 11.3.16.4. Rest of the Europe Market Size and Forecast, By Technology, 2019 - 2032 (US$ Million)
- 11.3.16.5. Rest of the Europe Market Size and Forecast, By Package Type, 2019 - 2032 (US$ Million)
- 11.3.16.6. Rest of the Europe Market Size and Forecast, By Application, 2019 - 2032 (US$ Million)
- 11.4. Asia Pacific (APAC)
- 11.4.1. Overview
- 11.4.2. Operational Amplifiers (Op-Amps) Key Manufacturers in Asia Pacific
- 11.4.3. Asia Pacific Market Size and Forecast, By Country, 2019 - 2032 (US$ Million)
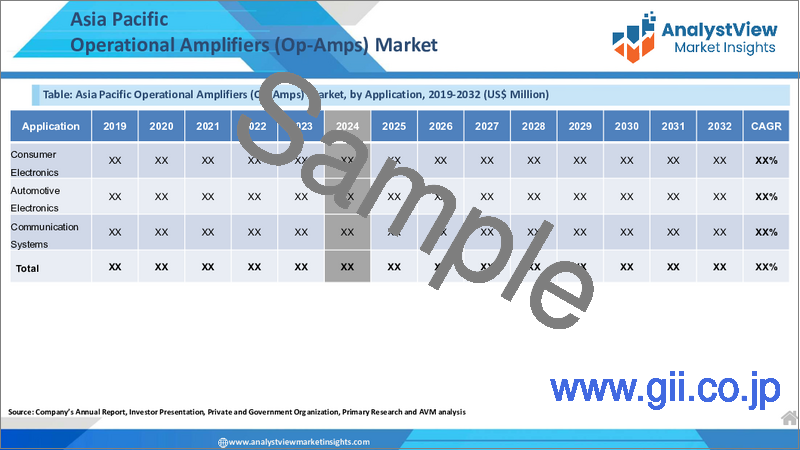
- 11.4.4. Asia Pacific Market Size and Forecast, By Type, 2019 - 2032 (US$ Million)
- 11.4.5. Asia Pacific Market Size and Forecast, By Technology, 2019 - 2032 (US$ Million)
- 11.4.6. Asia Pacific Market Size and Forecast, By Package Type, 2019 - 2032 (US$ Million)
- 11.4.7. Asia Pacific Market Size and Forecast, By Application, 2019 - 2032 (US$ Million)
- 11.4.8. India
- 11.4.8.1. Overview
- 11.4.8.2. Market Analysis, Forecast, and Y-O-Y Growth Rate, 2019 - 2032, (US$ Million)
- 11.4.8.3. India Market Size and Forecast, By Type, 2019 - 2032 (US$ Million)
- 11.4.8.4. India Market Size and Forecast, By Technology, 2019 - 2032 (US$ Million)
- 11.4.8.5. India Market Size and Forecast, By Package Type, 2019 - 2032 (US$ Million)
- 11.4.8.6. India Market Size and Forecast, By Application, 2019 - 2032 (US$ Million)
- 11.4.9. China
- 11.4.9.1. Overview
- 11.4.9.2. Market Analysis, Forecast, and Y-O-Y Growth Rate, 2019 - 2032, (US$ Million)
- 11.4.9.3. China Market Size and Forecast, By Type, 2019 - 2032 (US$ Million)
- 11.4.9.4. China Market Size and Forecast, By Technology, 2019 - 2032 (US$ Million)
- 11.4.9.5. China Market Size and Forecast, By Package Type, 2019 - 2032 (US$ Million)
- 11.4.9.6. China Market Size and Forecast, By Application, 2019 - 2032 (US$ Million)
- 11.4.10. Japan
- 11.4.10.1. Overview
- 11.4.10.2. Market Analysis, Forecast, and Y-O-Y Growth Rate, 2019 - 2032, (US$ Million)
- 11.4.10.3. Japan Market Size and Forecast, By Type, 2019 - 2032 (US$ Million)
- 11.4.10.4. Japan Market Size and Forecast, By Technology, 2019 - 2032 (US$ Million)
- 11.4.10.5. Japan Market Size and Forecast, By Package Type, 2019 - 2032 (US$ Million)
- 11.4.10.6. Japan Market Size and Forecast, By Application, 2019 - 2032 (US$ Million)
- 11.4.11. South Korea
- 11.4.11.1. Overview
- 11.4.11.2. Market Analysis, Forecast, and Y-O-Y Growth Rate, 2019 - 2032, (US$ Million)
- 11.4.11.3. South Korea Market Size and Forecast, By Type, 2019 - 2032 (US$ Million)
- 11.4.11.4. South Korea Market Size and Forecast, By Technology, 2019 - 2032 (US$ Million)
- 11.4.11.5. South Korea Market Size and Forecast, By Package Type, 2019 - 2032 (US$ Million)
- 11.4.11.6. South Korea Market Size and Forecast, By Application, 2019 - 2032 (US$ Million)
- 11.4.12. Australia
- 11.4.12.1. Overview
- 11.4.12.2. Market Analysis, Forecast, and Y-O-Y Growth Rate, 2019 - 2032, (US$ Million)
- 11.4.12.3. Australia Market Size and Forecast, By Type, 2019 - 2032 (US$ Million)
- 11.4.12.4. Australia Market Size and Forecast, By Technology, 2019 - 2032 (US$ Million)
- 11.4.12.5. Australia Market Size and Forecast, By Package Type, 2019 - 2032 (US$ Million)
- 11.4.12.6. Australia Market Size and Forecast, By Application, 2019 - 2032 (US$ Million)
- 11.4.13. Thailand
- 11.4.13.1. Overview
- 11.4.13.2. Market Analysis, Forecast, and Y-O-Y Growth Rate, 2019 - 2032, (US$ Million)
- 11.4.13.3. Thailand Market Size and Forecast, By Type, 2019 - 2032 (US$ Million)
- 11.4.13.4. Thailand Market Size and Forecast, By Technology, 2019 - 2032 (US$ Million)
- 11.4.13.5. Thailand Market Size and Forecast, By Package Type, 2019 - 2032 (US$ Million)
- 11.4.13.6. Thailand Market Size and Forecast, By Application, 2019 - 2032 (US$ Million)
- 11.4.14. Indonesia
- 11.4.14.1. Overview
- 11.4.14.2. Market Analysis, Forecast, and Y-O-Y Growth Rate, 2019 - 2032, (US$ Million)
- 11.4.14.3. Indonesia Market Size and Forecast, By Type, 2019 - 2032 (US$ Million)
- 11.4.14.4. Indonesia Market Size and Forecast, By Technology, 2019 - 2032 (US$ Million)
- 11.4.14.5. Indonesia Market Size and Forecast, By Package Type, 2019 - 2032 (US$ Million)
- 11.4.14.6. Indonesia Market Size and Forecast, By Application, 2019 - 2032 (US$ Million)
- 11.4.15. Philippines
- 11.4.15.1. Overview
- 11.4.15.2. Market Analysis, Forecast, and Y-O-Y Growth Rate, 2019 - 2032, (US$ Million)
- 11.4.15.3. Philippines Market Size and Forecast, By Type, 2019 - 2032 (US$ Million)
- 11.4.15.4. Philippines Market Size and Forecast, By Technology, 2019 - 2032 (US$ Million)
- 11.4.15.5. Philippines Market Size and Forecast, By Package Type, 2019 - 2032 (US$ Million)
- 11.4.15.6. Philippines Market Size and Forecast, By Application, 2019 - 2032 (US$ Million)
- 11.4.16. Rest of APAC
- 11.4.16.1. Overview
- 11.4.16.2. Market Analysis, Forecast, and Y-O-Y Growth Rate, 2019 - 2032, (US$ Million)
- 11.4.16.3. Rest of APAC Market Size and Forecast, By Type, 2019 - 2032 (US$ Million)
- 11.4.16.4. Rest of APAC Market Size and Forecast, By Technology, 2019 - 2032 (US$ Million)
- 11.4.16.5. Rest of APAC Market Size and Forecast, By Package Type, 2019 - 2032 (US$ Million)
- 11.4.16.6. Rest of APAC Market Size and Forecast, By Application, 2019 - 2032 (US$ Million)
- 11.5. Latin America
- 11.5.1. Overview
- 11.5.2. Operational Amplifiers (Op-Amps) Key Manufacturers in Latin America
- 11.5.3. Latin America Market Size and Forecast, By Country, 2019 - 2032 (US$ Million)
- 11.5.4. Latin America Market Size and Forecast, By Type, 2019 - 2032 (US$ Million)
- 11.5.5. Latin America Market Size and Forecast, By Technology, 2019 - 2032 (US$ Million)
- 11.5.6. Latin America Market Size and Forecast, By Package Type, 2019 - 2032 (US$ Million)
- 11.5.7. Latin America Market Size and Forecast, By Application, 2019 - 2032 (US$ Million)
- 11.5.8. Brazil
- 11.5.8.1. Overview
- 11.5.8.2. Market Analysis, Forecast, and Y-O-Y Growth Rate, 2019 - 2032, (US$ Million)
- 11.5.8.3. Brazil Market Size and Forecast, By Type, 2019 - 2032 (US$ Million)
- 11.5.8.4. Brazil Market Size and Forecast, By Technology, 2019 - 2032 (US$ Million)
- 11.5.8.5. Brazil Market Size and Forecast, By Package Type, 2019 - 2032 (US$ Million)
- 11.5.8.6. Brazil Market Size and Forecast, By Application, 2019 - 2032 (US$ Million)
- 11.5.9. Mexico
- 11.5.9.1. Overview
- 11.5.9.2. Market Analysis, Forecast, and Y-O-Y Growth Rate, 2019 - 2032, (US$ Million)
- 11.5.9.3. Mexico Market Size and Forecast, By Type, 2019 - 2032 (US$ Million)
- 11.5.9.4. Mexico Market Size and Forecast, By Technology, 2019 - 2032 (US$ Million)
- 11.5.9.5. Mexico Market Size and Forecast, By Package Type, 2019 - 2032 (US$ Million)
- 11.5.9.6. Mexico Market Size and Forecast, By Application, 2019 - 2032 (US$ Million)
- 11.5.10. Argentina
- 11.5.10.1. Overview
- 11.5.10.2. Market Analysis, Forecast, and Y-O-Y Growth Rate, 2019 - 2032, (US$ Million)
- 11.5.10.3. Argentina Market Size and Forecast, By Type, 2019 - 2032 (US$ Million)
- 11.5.10.4. Argentina Market Size and Forecast, By Technology, 2019 - 2032 (US$ Million)
- 11.5.10.5. Argentina Market Size and Forecast, By Package Type, 2019 - 2032 (US$ Million)
- 11.5.10.6. Argentina Market Size and Forecast, By Application, 2019 - 2032 (US$ Million)
- 11.5.11. Colombia
- 11.5.11.1. Overview
- 11.5.11.2. Market Analysis, Forecast, and Y-O-Y Growth Rate, 2019 - 2032, (US$ Million)
- 11.5.11.3. Colombia Market Size and Forecast, By Type, 2019 - 2032 (US$ Million)
- 11.5.11.4. Colombia Market Size and Forecast, By Technology, 2019 - 2032 (US$ Million)
- 11.5.11.5. Colombia Market Size and Forecast, By Package Type, 2019 - 2032 (US$ Million)
- 11.5.11.6. Colombia Market Size and Forecast, By Application, 2019 - 2032 (US$ Million)
- 11.5.12. Rest of LATAM
- 11.5.12.1. Overview
- 11.5.12.2. Market Analysis, Forecast, and Y-O-Y Growth Rate, 2019 - 2032, (US$ Million)
- 11.5.12.3. Rest of LATAM Market Size and Forecast, By Type, 2019 - 2032 (US$ Million)
- 11.5.12.4. Rest of LATAM Market Size and Forecast, By Technology, 2019 - 2032 (US$ Million)
- 11.5.12.5. Rest of LATAM Market Size and Forecast, By Package Type, 2019 - 2032 (US$ Million)
- 11.5.12.6. Rest of LATAM Market Size and Forecast, By Application, 2019 - 2032 (US$ Million)
- 11.6. Middle East and Africa
- 11.6.1. Overview
- 11.6.2. Operational Amplifiers (Op-Amps) Key Manufacturers in Middle East and Africa
- 11.6.3. Middle East and Africa Market Size and Forecast, By Country, 2019 - 2032 (US$ Million)
- 11.6.4. Middle East and Africa Market Size and Forecast, By Type, 2019 - 2032 (US$ Million)
- 11.6.5. Middle East and Africa Market Size and Forecast, By Technology, 2019 - 2032 (US$ Million)
- 11.6.6. Middle East and Africa Market Size and Forecast, By Package Type, 2019 - 2032 (US$ Million)
- 11.6.7. Middle East and Africa Market Size and Forecast, By Application, 2019 - 2032 (US$ Million)
- 11.6.8. Saudi Arabia
- 11.6.8.1. Overview
- 11.6.8.2. Market Analysis, Forecast, and Y-O-Y Growth Rate, 2019 - 2032, (US$ Million)
- 11.6.8.3. Saudi Arabia Market Size and Forecast, By Type, 2019 - 2032 (US$ Million)
- 11.6.8.4. Saudi Arabia Market Size and Forecast, By Technology, 2019 - 2032 (US$ Million)
- 11.6.8.5. Saudi Arabia Market Size and Forecast, By Package Type, 2019 - 2032 (US$ Million)
- 11.6.8.6. Saudi Arabia Market Size and Forecast, By Application, 2019 - 2032 (US$ Million)
- 11.6.9. United Arab Emirates
- 11.6.9.1. Overview
- 11.6.9.2. Market Analysis, Forecast, and Y-O-Y Growth Rate, 2019 - 2032, (US$ Million)
- 11.6.9.3. United Arab Emirates Market Size and Forecast, By Type, 2019 - 2032 (US$ Million)
- 11.6.9.4. United Arab Emirates Market Size and Forecast, By Technology, 2019 - 2032 (US$ Million)
- 11.6.9.5. United Arab Emirates Market Size and Forecast, By Package Type, 2019 - 2032 (US$ Million)
- 11.6.9.6. United Arab Emirates Market Size and Forecast, By Application, 2019 - 2032 (US$ Million)
- 11.6.10. Israel
- 11.6.10.1. Overview
- 11.6.10.2. Market Analysis, Forecast, and Y-O-Y Growth Rate, 2019 - 2032, (US$ Million)
- 11.6.10.3. Israel Market Size and Forecast, By Type, 2019 - 2032 (US$ Million)
- 11.6.10.4. Israel Market Size and Forecast, By Technology, 2019 - 2032 (US$ Million)
- 11.6.10.5. Israel Market Size and Forecast, By Package Type, 2019 - 2032 (US$ Million)
- 11.6.10.6. Israel Market Size and Forecast, By Application, 2019 - 2032 (US$ Million)
- 11.6.11. Turkey
- 11.6.11.1. Overview
- 11.6.11.2. Market Analysis, Forecast, and Y-O-Y Growth Rate, 2019 - 2032, (US$ Million)
- 11.6.11.3. Turkey Market Size and Forecast, By Type, 2019 - 2032 (US$ Million)
- 11.6.11.4. Turkey Market Size and Forecast, By Technology, 2019 - 2032 (US$ Million)
- 11.6.11.5. Turkey Market Size and Forecast, By Package Type, 2019 - 2032 (US$ Million)
- 11.6.11.6. Turkey Market Size and Forecast, By Application, 2019 - 2032 (US$ Million)
- 11.6.12. Algeria
- 11.6.12.1. Overview
- 11.6.12.2. Market Analysis, Forecast, and Y-O-Y Growth Rate, 2019 - 2032, (US$ Million)
- 11.6.12.3. Algeria Market Size and Forecast, By Type, 2019 - 2032 (US$ Million)
- 11.6.12.4. Algeria Market Size and Forecast, By Technology, 2019 - 2032 (US$ Million)
- 11.6.12.5. Algeria Market Size and Forecast, By Package Type, 2019 - 2032 (US$ Million)
- 11.6.12.6. Algeria Market Size and Forecast, By Application, 2019 - 2032 (US$ Million)
- 11.6.13. Egypt
- 11.6.13.1. Overview
- 11.6.13.2. Market Analysis, Forecast, and Y-O-Y Growth Rate, 2019 - 2032, (US$ Million)
- 11.6.13.3. Egypt Market Size and Forecast, By Type, 2019 - 2032 (US$ Million)
- 11.6.13.4. Egypt Market Size and Forecast, By Technology, 2019 - 2032 (US$ Million)
- 11.6.13.5. Egypt Market Size and Forecast, By Package Type, 2019 - 2032 (US$ Million)
- 11.6.13.6. Egypt Market Size and Forecast, By Application, 2019 - 2032 (US$ Million)
- 11.6.14. Rest of MEA
- 11.6.14.1. Overview
- 11.6.14.2. Market Analysis, Forecast, and Y-O-Y Growth Rate, 2019 - 2032, (US$ Million)
- 11.6.14.3. Rest of MEA Market Size and Forecast, By Type, 2019 - 2032 (US$ Million)
- 11.6.14.4. Rest of MEA Market Size and Forecast, By Technology, 2019 - 2032 (US$ Million)
- 11.6.14.5. Rest of MEA Market Size and Forecast, By Package Type, 2019 - 2032 (US$ Million)
- 11.6.14.6. Rest of MEA Market Size and Forecast, By Application, 2019 - 2032 (US$ Million)
12. Key Vendor Analysis- Operational Amplifiers (Op-Amps) Industry
- 12.1. Competitive Dashboard
- 12.2. Company Profiles
- 12.2.1. Analog Devices Inc.
- 12.2.2. Broadcom Inc.
- 12.2.3. Cirrus Logic, Inc.
- 12.2.4. Fairchild Semiconductor (now part of ON Semiconductor)
- 12.2.5. Infineon Technologies AG
- 12.2.6. Intersil Corporation (now part of Renesas)
- 12.2.7. Linear Technology Corporation (now part of Analog Devices)
- 12.2.8. Maxim Integrated
- 12.2.9. Microchip Technology Inc.
- 12.2.10. NXP Semiconductors N.V.
- 12.2.11. ON Semiconductor Corporation
- 12.2.12. ROHM Semiconductor
- 12.2.13. STMicroelectronics
- 12.2.14. TDK Corporation
- 12.2.15. Texas Instruments Inc.
- 12.2.16. Vishay Intertechnology, Inc.
- 12.2.17. Others
13. 360 Degree Analyst View
14. Appendix
- 14.1. Research Methodology
- 14.2. References
- 14.3. Abbreviations
- 14.4. Disclaimer
- 14.5. Contact Us

