|
|
市場調査レポート
商品コード
1565721
前臨床CRO市場:サービス別、モデルタイプ別、最終用途別、国別、地域別 - 産業分析、市場規模、市場シェア、2024年~2032年の予測Preclinical CRO Market, By Service, By Model Type, By End Uses, By Country, and By Region: Industry Analysis, Market Size, Market Share, and Forecast from 2024 to 2032 |
||||||
|
|||||||
カスタマイズ可能
|
|||||||

| 前臨床CRO市場:サービス別、モデルタイプ別、最終用途別、国別、地域別 - 産業分析、市場規模、市場シェア、2024年~2032年の予測 |
|
出版日: 2024年10月02日
発行: AnalystView Market Insights
ページ情報: 英文 303 Pages
納期: 2~3営業日
|

全表示
- 概要
- 目次
レポートのハイライト
前臨床CRO市場規模は2023年に57億5,420万米ドルと評価され、2024年から2032年にかけてCAGR 8.90%で上昇
前臨床CRO市場-市場力学
アウトソーシングサービスによる前臨床CRO市場の急成長
アウトソーシングサービスに対する需要の高まりが、前臨床CRO市場の今後の成長を牽引すると予測されます。アウトソーシングサービスとは、特定のビジネスタスクや業務を処理するために第三者プロバイダーと契約することです。前臨床研究はますます高度化しており、すべての製薬会社やバイオテクノロジー企業が社内に保有しているわけではない専門的なスキルや経験が必要とされています。前臨床CROにアウトソーシングすることで、企業は能力開発に投資することなく必要な知識を得ることができ、前臨床研究を実施しながらコアビジネスに集中することができます。例えば、米国の独立系戦略情報分析プロバイダーであるBioPlan Associates Inc.がバイオ製薬企業207社とサプライヤー138社を対象に実施した調査によると、2023年 4月時点でバイオ製薬企業の約84.6%が分析試験を、74.5%が毒性試験をアウトソーシングしています。その結果、アウトソーシングサービスに対する需要の高まりが前臨床CRO市場を前進させています。
前臨床CRO市場-主要インサイト
当社のリサーチアナリストは、2024年から2032年までの世界市場のCAGRを8.90%と予測しています。
2023年、サービスセグメンテーション調査によると、世界の前臨床CRO市場で最大の収益シェアを占めたのは毒性試験カテゴリでした。
2023年には、患者由来オルガノイド(PDO)モデル分野が世界の前臨床CRO市場をモデルタイプ別セグメンテーションで支配しました。
地域別では、北米が2023年に最も収益を上げました。
前臨床CRO市場-セグメンテーション分析:
世界の前臨床CRO市場は4つのグループに分けられる:サービス、モデルタイプ、エンドユース、地域です。
市場はサービスに基づいて6つの部門に区分される:毒性試験、バイオアナリシス&DMPK試験、化学、化合物管理、安全性薬理学、その他です。2023年には、毒性学的試験のカテゴリーが世界の前臨床CRO市場で最も高い売上シェアを占めました。これは、非中核的な前臨床CRO試験のアウトソーシングが増加し、毒性学的試験が広く利用されるようになったことによる。非中核前臨床試験をCROにアウトソーシングする割合の増加や、CROの付加価値サービス提供能力の向上は、予測期間中、このカテゴリの拡大を促進すると考えられます。
市場はモデルタイプによって2つのセグメントに分類される:患者由来オルガノイド(PDO)モデル」と「患者由来異種移植片モデル」です。2023年には、患者由来オルガノイド(PDO)モデルが最も大きな市場シェアを占めています。患者由来オルガノイド(PDO)モデルは、患者に直接由来する細胞や組織を利用することから人気を集めています。これは個別化ヘルスケアに役立ち、検体の凍結保存も可能です。このような理由から、PDOはがんの早期発見と予後予測に役立つため、前臨床試験の重要な側面となりつつあります。
前臨床CRO市場-地理的洞察
この市場は、欧州、中東、北米、アジア太平洋、アフリカ、ラテンアメリカと地理的に多様化しています。地域はさらに、商業をもたらす国によって分けられます。
北米が2023年に最も高い割合を占めたのは、Charles River LaboratoriesやLabCorpのような早期創薬に注力する確立されたCROが存在するためです。米国は前臨床試験アウトソーシングの最大市場です。いくつかのバイオ製薬企業は、FDA承認の治験薬(IND)申請から利益を得るために、米国にあるCROに前臨床試験をアウトソーシングすることを好むからです。
アジア太平洋地域も同様に、予測期間中に最も速いペースで増加すると予想されます。アジア太平洋地域の前臨床アウトソーシングは、多国籍企業のアウトソーシングというビジネスモデルの変化や研究開発コストの上昇、インドや中国などのCROが提供するコスト効率の高さから拡大すると予測されています。西欧や米国の既存企業は、研究コストを削減するために、アジア太平洋地域で分析サービス、サイト研究開発、臨床活動を追求しています。
前臨床CRO市場-競合情勢:
前臨床試験受託機関(CRO)市場は、大手企業と新興企業の両方が前臨床試験サービスプラットフォームで事業を展開しており、競争に関する多様性が高いです。市場の主要企業プロファイルは、Eurofins Scientific、LABCOR、PRA Health Sciences, Inc.などです。LABCOR、PRA Health Sciences Inc.などです。Covanceは優れた前臨床ポートフォリオのサービス範囲を特徴としており、医薬品開発における豊富な経験を誇っています。この分野の主なプレーヤーには、医薬品開発プロセスの統合ソリューションを提供するWuXi AppTecや、世界な展開と能力で知られるPPDなどがあります。ニッチで小規模なCROも台頭しており、得意とする特定の治療分野をターゲットにしているため、前臨床研究の競争はさらに激化しています。
目次
第1章 前臨床CRO市場概要
- 調査範囲
- 市場推定年
第2章 エグゼクティブサマリー
- 市場内訳
- 競合考察
第3章 前臨床CROの主要市場動向
- 市場促進要因
- 市場抑制要因
- 市場機会
- 市場の将来動向
第4章 前臨床CRO業界調査
- PEST分析
- ポーターのファイブフォース分析
- 成長見通しマッピング
- 規制枠組み分析
第5章 前臨床CRO市場: COVID-19の影響分析
- COVID-19以前の影響分析
- COVID-19後の影響分析
第6章 前臨床CRO市場情勢
- 前臨床CRO市場シェア分析、2023年
- 主要メーカー別内訳データ
- 既存企業の分析
- 新興企業の分析
第7章 前臨床CRO市場- サービス別
- 概要
- セグメントシェア分析
- 毒性試験
- バイオ分析とDMPK研究
- 化学
- 化合物管理
- 安全性薬理学
- その他
第8章 前臨床CRO市場- モデルタイプ別
- 概要
- セグメントシェア分析
- 患者由来オルガノイド(PDO)モデル
- 患者由来異種移植モデル
第9章 前臨床CRO市場- 最終用途別
- 概要
- セグメントシェア分析
- 医療機器企業
- バイオ医薬品
- 政府機関および学術機関
第10章 前臨床CRO市場- 地域別
- イントロダクション
- 北米
- 概要
- 北米の主要メーカー
- 米国
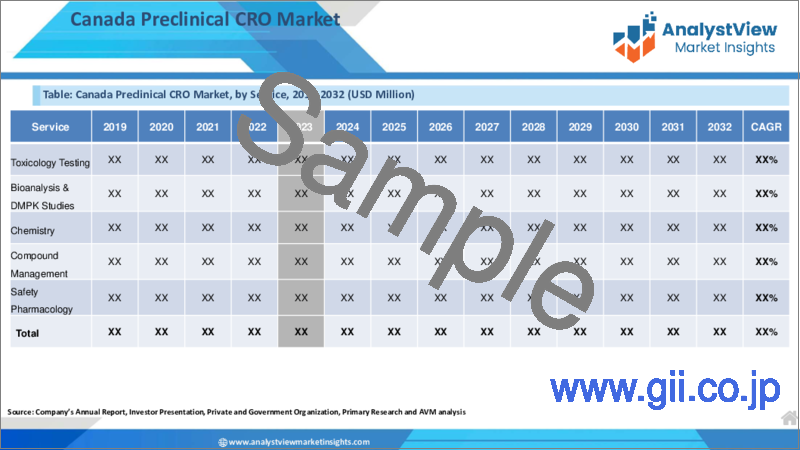
- カナダ
- 欧州
- 概要
- 欧州の主要メーカー
- ドイツ
- イタリア
- 英国
- フランス
- ロシア
- オランダ
- スウェーデン
- ポーランド
- その他
- アジア太平洋(APAC)
- 概要
- アジア太平洋地域の主要メーカー
- インド
- 中国
- 日本
- 韓国
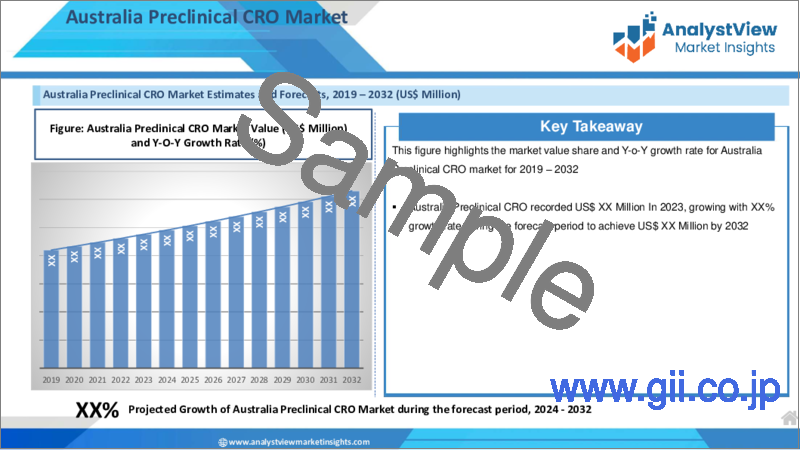
- オーストラリア
- タイ
- インドネシア
- フィリピン
- その他
- ラテンアメリカ
- 概要
- ラテンアメリカの主要メーカー
- ブラジル
- メキシコ
- アルゼンチン
- コロンビア
- その他
- 中東およびアフリカ
- 概要
- 中東・アフリカの主要メーカー
- サウジアラビア
- アラブ首長国連邦
- イスラエル
- トルコ
- アルジェリア
- エジプト
- その他
第11章 主要ベンダー分析- 前臨床CRO業界
- 競争ダッシュボード
- 企業プロファイル
- Eurofins Scientific
- LABCORP
- PRA Health Sciences, Inc.
- Wuxi AppTec
- Medpace, Inc.
- PPD(Thermo Fisher Scientific, Inc.)
- Charles River Laboratories International, Inc.
- SGA SA
- Intertek Group Plc(IGP)
- Crown Bioscience
- Others
第12章 アナリストの全方位展望
REPORT HIGHLIGHT
Preclinical CRO Market size was evaluated at USD 5,754.2 million in 2023, rising at a CAGR of 8.90% between 2024 and 2032.
Preclinical CROs (contract research organizations) are support organizations that provide the knowledge in research and development required to guide a drug candidate through animal testing and into clinical trials. A preclinical CRO helps innovative medical product producers demonstrate safety and efficacy in animals that closely resemble human anatomy before entering clinical trials or being employed in human care.
Preclinical CRO Market- Market Dynamics
Surge In Preclinical CRO Market Growth Through Outsourcing Services
Growing demand for outsourcing services is projected to drive future growth in the preclinical CRO market. Outsourcing services is the practice of contracting with a third-party provider to handle specific business tasks or operations. Preclinical research is getting more sophisticated, necessitating specialized skills and experience that not all pharmaceutical and biotechnology companies possess in-house. Outsourcing to preclinical CROs enables businesses to gain access to the knowledge they require without investing in capability development, allowing them to focus on core business while still conducting preclinical research. For instance, according to a survey of 207 biopharma respondents and 138 suppliers conducted by BioPlan Associates Inc., a US-based provider of independent strategic information and analysis, approximately 84.6% of biomanufacturers outsource analytical testing and 74.5% outsource toxicity testing in April 2023. As a result, increasing demand for outsourcing services is propelling the preclinical CRO market forward.
Preclinical CRO Market- Key Insights
Our research analyst predicts an 8.90% CAGR for the global market from 2024 to 2032.
In 2023, In 2023, the toxicology testing category accounted for the biggest revenue share of the worldwide preclinical CRO market, according to Service segmentation research.
In 2023, the Patient Derived Organoid (PDO) model sector dominated the worldwide Preclinical CRO market by Model Type segmentation.
According to region, North America had the most revenue in 2023.
Preclinical CRO Market- Segmentation Analysis:
The global Preclinical CRO Market is divided into four groups: Service, Model Type, End Uses, and geography.
The market is segmented into six divisions based on the Service: Toxicology Testing, Bioanalysis & DMPK Studies, Chemistry, Compound Management, Safety Pharmacology, and Others. In 2023, the toxicology testing category had the highest revenue share of the worldwide preclinical CRO market, owing to increased outsourcing of noncore preclinical CRO studies and widespread utilization of toxicology tests. toxicology is one of the primary services being outsourced to CROs due to their enhanced ability to conduct toxicological tests. The increasing rate of outsourcing noncore preclinical investigations to CROs, as well as CROs' rising ability to provide additional value-added services, are likely to drive expansion in this category during the projection period.
The market is classified into two segments depending on the Model Type: The patient-Derived Organoid (PDO) Model and the Patient-derived xenograft model. In 2023, the Patient-Derived Organoid (PDO) Model segment had the most market share. The patient-derived organoid (PDO) model is gaining popularity due to the utilization of directly derived cells and tissues from the patient. This aids in individualized healthcare, and specimens can be cryopreserved. For these reasons, they are becoming an important aspect of preclinical investigations since they aid in the faster detection and prognosis of cancer.
Preclinical CRO Market- Geographical Insights
This market is geographically diversified across Europe, the Middle East, North America, Asia Pacific, and Africa, Latin America. The regions are further divided by the nations that bring commerce.
North America had the highest proportion in 2023 because to the presence of established CROs focusing in early drug discovery, such as Charles River Laboratories and LabCorp. The United States is the largest market for preclinical trial outsourcing, as several biopharmaceutical companies prefer to outsource their preclinical trials to CROs situated in the United States in order to benefit from FDA-approved Investigational New Drug (IND) applications.
Asia Pacific is likewise expected to increase at the quickest rate over the projection period. Preclinical outsourcing in Asia Pacific is predicted to expand because to the shifting business model of MNC outsourcing and rising R&D costs, as well as the cost efficiency offered by CROs in countries such as India and China. Established corporations from Western Europe and the United States pursue analytical services, site research development, and clinical activities in the Asia Pacific region to cut research costs.
Preclinical CRO Market- Competitive Landscape:
The Preclinical Contract Research Organization (CRO) Market is highly diversified concerning the competition, with both large companies and emerging players operating with their preclinical services platforms. The key profiled players in the market are Eurofins Scientific, LABCOR, PRA Health Sciences, Inc., and others. It features an excellent preclinical portfolio service range, and Covance boasts vast experience in drug development. Major players in this space include WuXi AppTec, which offers the integrated solutions of all the drugs' development process, and PPD, known for its global reach and capabilities. Smaller niche CROs are also emerging that target specific therapeutic areas where they have their specialties, further fueling preclinical research with a thus intensified competition.
Recent Developments:
In March 2023, Crown Bioscience and JSR Life Sciences Company have announced the opening of a new location in Singapore, which will help the company increase its capacity for local and worldwide biotech and pharmaceutical companies. The website will help companies involved in preclinical and translational oncology medication research and development.
SCOPE OF THE REPORT
This report's scope includes the following important market segments:
GLOBAL PRECLINICAL CRO MARKET KEY PLAYERS- DETAILED COMPETITIVE INSIGHTS
- Eurofins Scientific
- LABCORP
- PRA Health Sciences, Inc.
- Wuxi AppTec
- Medpace, Inc.
- PPD (Thermo Fisher Scientific, Inc.)
- Charles River Laboratories International, Inc.
- SGA SA
- Intertek Group Plc (IGP)
- Crown Bioscience
- Others
GLOBAL PRECLINICAL CRO MARKET, BY SERVICE- MARKET ANALYSIS, 2019 - 2032
- Toxicology Testing
- Bioanalysis & DMPK Studies
- Chemistry
- Compound Management
- Safety Pharmacology
- Others
GLOBAL PRECLINICAL CRO MARKET, BY MODEL TYPE- MARKET ANALYSIS, 2019 - 2032
- Patient-Derived Organoid (PDO) Model
- Patient-derived xenograft model
GLOBAL PRECLINICAL CRO MARKET, BY END-USES- MARKET ANALYSIS, 2019 - 2032
- Medical Device Companies
- Biopharmaceutical
- Government & Academic Institutes
GLOBAL PRECLINICAL CRO MARKET, BY REGION- MARKET ANALYSIS, 2019 - 2032
- North America
- The U.S.
- Canada
- Europe
- Germany
- France
- Italy
- Spain
- United Kingdom
- Russia
- Netherlands
- Sweden
- Poland
- Rest of Europe
- Asia Pacific
- India
- China
- South Korea
- Japan
- Australia
- Thailand
- Indonesia
- Philippines
- Rest of APAC
- Latin America
- Brazil
- Mexico
- Argentina
- Colombia
- Rest of LATAM
- The Middle East and Africa
- Saudi Arabia
- United Arab Emirates
- Israel
- Turkey
- Algeria
- Egypt
- Rest of MEA
Table of Contents
1. Preclinical CRO Market Overview
- 1.1. Study Scope
- 1.2. Market Estimation Years
2. Executive Summary
- 2.1. Market Snippet
- 2.1.1. Preclinical CRO Market Snippet by Service
- 2.1.2. Preclinical CRO Market Snippet by Model Type
- 2.1.3. Preclinical CRO Market Snippet by End Uses
- 2.1.4. Preclinical CRO Market Snippet by Country
- 2.1.5. Preclinical CRO Market Snippet by Region
- 2.2. Competitive Insights
3. Preclinical CRO Key Market Trends
- 3.1. Preclinical CRO Market Drivers
- 3.1.1. Impact Analysis of Market Drivers
- 3.2. Preclinical CRO Market Restraints
- 3.2.1. Impact Analysis of Market Restraints
- 3.3. Preclinical CRO Market Opportunities
- 3.4. Preclinical CRO Market Future Trends
4. Preclinical CRO Industry Study
- 4.1. PEST Analysis
- 4.2. Porter's Five Forces Analysis
- 4.3. Growth Prospect Mapping
- 4.4. Regulatory Framework Analysis
5. Preclinical CRO Market: COVID-19 Impact Analysis
- 5.1. Pre-COVID-19 Impact Analysis
- 5.2. Post-COVID-19 Impact Analysis
- 5.2.1. Top Performing Segments
- 5.2.2. Marginal Growth Segments
- 5.2.3. Top Looser Segments
- 5.2.4. Marginal Loss Segments
6. Preclinical CRO Market Landscape
- 6.1. Preclinical CRO Market Share Analysis, 2023
- 6.2. Breakdown Data, by Key Manufacturer
- 6.2.1. Established Players' Analysis
- 6.2.2. Emerging Players' Analysis
7. Preclinical CRO Market - By Service
- 7.1. Overview
- 7.1.1. Segment Share Analysis, By Service, 2023 & 2032 (%)
- 7.1.2. Toxicology Testing
- 7.1.3. Bioanalysis & DMPK Studies
- 7.1.4. Chemistry
- 7.1.5. Compound Management
- 7.1.6. Safety Pharmacology
- 7.1.7. Others
8. Preclinical CRO Market - By Model Type
- 8.1. Overview
- 8.1.1. Segment Share Analysis, By Model Type, 2023 & 2032 (%)
- 8.1.2. Patient-Derived Organoid (PDO) Model
- 8.1.3. Patient-derived xenograft model
9. Preclinical CRO Market - By End Uses
- 9.1. Overview
- 9.1.1. Segment Share Analysis, By End Uses, 2023 & 2032 (%)
- 9.1.2. Medical Device Companies
- 9.1.3. Biopharmaceutical
- 9.1.4. Government & Academic Institutes
10. Preclinical CRO Market- By Geography
- 10.1. Introduction
- 10.1.1. Segment Share Analysis, By Geography, 2023 & 2032 (%)
- 10.2. North America
- 10.2.1. Overview
- 10.2.2. Preclinical CRO Key Manufacturers in North America
- 10.2.3. North America Market Size and Forecast, By Country, 2019 - 2032 (US$ Million)
- 10.2.4. North America Market Size and Forecast, By Service, 2019 - 2032 (US$ Million)
- 10.2.5. North America Market Size and Forecast, By Model Type, 2019 - 2032 (US$ Million)
- 10.2.6. North America Market Size and Forecast, By End Uses, 2019 - 2032 (US$ Million)
- 10.2.7. U.S.
- 10.2.7.1. Overview
- 10.2.7.2. Market Analysis, Forecast, and Y-O-Y Growth Rate, 2019 - 2032, (US$ Million)
- 10.2.7.3. U.S. Market Size and Forecast, By Service, 2019 - 2032 (US$ Million)
- 10.2.7.4. U.S. Market Size and Forecast, By Model Type, 2019 - 2032 (US$ Million)
- 10.2.7.5. U.S. Market Size and Forecast, By End Uses, 2019 - 2032 (US$ Million)
- 10.2.8. Canada
- 10.2.8.1. Overview
- 10.2.8.2. Market Analysis, Forecast, and Y-O-Y Growth Rate, 2019 - 2032, (US$ Million)
- 10.2.8.3. Canada Market Size and Forecast, By Service, 2019 - 2032 (US$ Million)
- 10.2.8.4. Canada Market Size and Forecast, By Model Type, 2019 - 2032 (US$ Million)
- 10.2.8.5. Canada Market Size and Forecast, By End Uses, 2019 - 2032 (US$ Million)
- 10.3. Europe
- 10.3.1. Overview
- 10.3.2. Preclinical CRO Key Manufacturers in Europe
- 10.3.3. Europe Market Size and Forecast, By Country, 2019 - 2032 (US$ Million)
- 10.3.4. Europe Market Size and Forecast, By Service, 2019 - 2032 (US$ Million)
- 10.3.5. Europe Market Size and Forecast, By Model Type, 2019 - 2032 (US$ Million)
- 10.3.6. Europe Market Size and Forecast, By End Uses, 2019 - 2032 (US$ Million)
- 10.3.7. Germany
- 10.3.7.1. Overview
- 10.3.7.2. Market Analysis, Forecast, and Y-O-Y Growth Rate, 2019 - 2032, (US$ Million)
- 10.3.7.3. Germany Market Size and Forecast, By Service, 2019 - 2032 (US$ Million)
- 10.3.7.4. Germany Market Size and Forecast, By Model Type, 2019 - 2032 (US$ Million)
- 10.3.7.5. Germany Market Size and Forecast, By End Uses, 2019 - 2032 (US$ Million)
- 10.3.8. Italy
- 10.3.8.1. Overview
- 10.3.8.2. Market Analysis, Forecast, and Y-O-Y Growth Rate, 2019 - 2032, (US$ Million)
- 10.3.8.3. Italy Market Size and Forecast, By Service, 2019 - 2032 (US$ Million)
- 10.3.8.4. Italy Market Size and Forecast, By Model Type, 2019 - 2032 (US$ Million)
- 10.3.8.5. Italy Market Size and Forecast, By End Uses, 2019 - 2032 (US$ Million)
- 10.3.9. United Kingdom
- 10.3.9.1. Overview
- 10.3.9.2. Market Analysis, Forecast, and Y-O-Y Growth Rate, 2019 - 2032, (US$ Million)
- 10.3.9.3. United Kingdom Market Size and Forecast, By Service, 2019 - 2032 (US$ Million)
- 10.3.9.4. United Kingdom Market Size and Forecast, By Model Type, 2019 - 2032 (US$ Million)
- 10.3.9.5. United Kingdom Market Size and Forecast, By End Uses, 2019 - 2032 (US$ Million)
- 10.3.10. France
- 10.3.10.1. Overview
- 10.3.10.2. Market Analysis, Forecast, and Y-O-Y Growth Rate, 2019 - 2032, (US$ Million)
- 10.3.10.3. France Market Size and Forecast, By Service, 2019 - 2032 (US$ Million)
- 10.3.10.4. France Market Size and Forecast, By Model Type, 2019 - 2032 (US$ Million)
- 10.3.10.5. France Market Size and Forecast, By End Uses, 2019 - 2032 (US$ Million)
- 10.3.11. Russia
- 10.3.11.1. Market Analysis, Forecast, and Y-O-Y Growth Rate, 2019 - 2032, (US$ Million)
- 10.3.11.2. Russia Market Size and Forecast, By Service, 2019 - 2032 (US$ Million)
- 10.3.11.3. Russia Market Size and Forecast, By Model Type, 2019 - 2032 (US$ Million)
- 10.3.11.4. Russia Market Size and Forecast, By End Uses, 2019 - 2032 (US$ Million)
- 10.3.12. Netherlands
- 10.3.12.1. Market Analysis, Forecast, and Y-O-Y Growth Rate, 2019 - 2032, (US$ Million)
- 10.3.12.2. Netherlands Market Size and Forecast, By Service, 2019 - 2032 (US$ Million)
- 10.3.12.3. Netherlands Market Size and Forecast, By Model Type, 2019 - 2032 (US$ Million)
- 10.3.12.4. Netherlands Market Size and Forecast, By End Uses, 2019 - 2032 (US$ Million)
- 10.3.13. Sweden
- 10.3.13.1. Market Analysis, Forecast, and Y-O-Y Growth Rate, 2019 - 2032, (US$ Million)
- 10.3.13.2. Sweden Market Size and Forecast, By Service, 2019 - 2032 (US$ Million)
- 10.3.13.3. Sweden Market Size and Forecast, By Model Type, 2019 - 2032 (US$ Million)
- 10.3.13.4. Sweden Market Size and Forecast, By End Uses, 2019 - 2032 (US$ Million)
- 10.3.14. Poland
- 10.3.14.1. Market Analysis, Forecast, and Y-O-Y Growth Rate, 2019 - 2032, (US$ Million)
- 10.3.14.2. Poland Market Size and Forecast, By Service, 2019 - 2032 (US$ Million)
- 10.3.14.3. Poland Market Size and Forecast, By Model Type, 2019 - 2032 (US$ Million)
- 10.3.14.4. Poland Market Size and Forecast, By End Uses, 2019 - 2032 (US$ Million)
- 10.3.15. Rest of Europe
- 10.3.15.1. Overview
- 10.3.15.2. Market Analysis, Forecast, and Y-O-Y Growth Rate, 2019 - 2032, (US$ Million)
- 10.3.15.3. Rest of the Europe Market Size and Forecast, By Service, 2019 - 2032 (US$ Million)
- 10.3.15.4. Rest of the Europe Market Size and Forecast, By Model Type, 2019 - 2032 (US$ Million)
- 10.3.15.5. Rest of the Europe Market Size and Forecast, By End Uses, 2019 - 2032 (US$ Million)
- 10.4. Asia Pacific (APAC)
- 10.4.1. Overview
- 10.4.2. Preclinical CRO Key Manufacturers in Asia Pacific
- 10.4.3. Asia Pacific Market Size and Forecast, By Country, 2019 - 2032 (US$ Million)
- 10.4.4. Asia Pacific Market Size and Forecast, By Service, 2019 - 2032 (US$ Million)
- 10.4.5. Asia Pacific Market Size and Forecast, By Model Type, 2019 - 2032 (US$ Million)
- 10.4.6. Asia Pacific Market Size and Forecast, By End Uses, 2019 - 2032 (US$ Million)
- 10.4.7. India
- 10.4.7.1. Overview
- 10.4.7.2. Market Analysis, Forecast, and Y-O-Y Growth Rate, 2019 - 2032, (US$ Million)
- 10.4.7.3. India Market Size and Forecast, By Service, 2019 - 2032 (US$ Million)
- 10.4.7.4. India Market Size and Forecast, By Model Type, 2019 - 2032 (US$ Million)
- 10.4.7.5. India Market Size and Forecast, By End Uses, 2019 - 2032 (US$ Million)
- 10.4.8. China
- 10.4.8.1. Overview
- 10.4.8.2. Market Analysis, Forecast, and Y-O-Y Growth Rate, 2019 - 2032, (US$ Million)
- 10.4.8.3. China Market Size and Forecast, By Service, 2019 - 2032 (US$ Million)
- 10.4.8.4. China Market Size and Forecast, By Model Type, 2019 - 2032 (US$ Million)
- 10.4.8.5. China Market Size and Forecast, By End Uses, 2019 - 2032 (US$ Million)
- 10.4.9. Japan
- 10.4.9.1. Overview
- 10.4.9.2. Market Analysis, Forecast, and Y-O-Y Growth Rate, 2019 - 2032, (US$ Million)
- 10.4.9.3. Japan Market Size and Forecast, By Service, 2019 - 2032 (US$ Million)
- 10.4.9.4. Japan Market Size and Forecast, By Model Type, 2019 - 2032 (US$ Million)
- 10.4.9.5. Japan Market Size and Forecast, By End Uses, 2019 - 2032 (US$ Million)
- 10.4.10. South Korea
- 10.4.10.1. Overview
- 10.4.10.2. Market Analysis, Forecast, and Y-O-Y Growth Rate, 2019 - 2032, (US$ Million)
- 10.4.10.3. South Korea Market Size and Forecast, By Service, 2019 - 2032 (US$ Million)
- 10.4.10.4. South Korea Market Size and Forecast, By Model Type, 2019 - 2032 (US$ Million)
- 10.4.10.5. South Korea Market Size and Forecast, By End Uses, 2019 - 2032 (US$ Million)
- 10.4.11. Australia
- 10.4.11.1. Overview
- 10.4.11.2. Market Analysis, Forecast, and Y-O-Y Growth Rate, 2019 - 2032, (US$ Million)
- 10.4.11.3. Australia Market Size and Forecast, By Service, 2019 - 2032 (US$ Million)
- 10.4.11.4. Australia Market Size and Forecast, By Model Type, 2019 - 2032 (US$ Million)
- 10.4.11.5. Australia Market Size and Forecast, By End Uses, 2019 - 2032 (US$ Million)
- 10.4.12. Thailand
- 10.4.12.1. Overview
- 10.4.12.2. Market Analysis, Forecast, and Y-O-Y Growth Rate, 2019 - 2032, (US$ Million)
- 10.4.12.3. Thailand Market Size and Forecast, By Service, 2019 - 2032 (US$ Million)
- 10.4.12.4. Thailand Market Size and Forecast, By Model Type, 2019 - 2032 (US$ Million)
- 10.4.12.5. Thailand Market Size and Forecast, By End Uses, 2019 - 2032 (US$ Million)
- 10.4.13. Indonesia
- 10.4.13.1. Overview
- 10.4.13.2. Market Analysis, Forecast, and Y-O-Y Growth Rate, 2019 - 2032, (US$ Million)
- 10.4.13.3. Indonesia Market Size and Forecast, By Service, 2019 - 2032 (US$ Million)
- 10.4.13.4. Indonesia Market Size and Forecast, By Model Type, 2019 - 2032 (US$ Million)
- 10.4.13.5. Indonesia Market Size and Forecast, By End Uses, 2019 - 2032 (US$ Million)
- 10.4.14. Philippines
- 10.4.14.1. Overview
- 10.4.14.2. Market Analysis, Forecast, and Y-O-Y Growth Rate, 2019 - 2032, (US$ Million)
- 10.4.14.3. Philippines Market Size and Forecast, By Service, 2019 - 2032 (US$ Million)
- 10.4.14.4. Philippines Market Size and Forecast, By Model Type, 2019 - 2032 (US$ Million)
- 10.4.14.5. Philippines Market Size and Forecast, By End Uses, 2019 - 2032 (US$ Million)
- 10.4.15. Rest of APAC
- 10.4.15.1. Overview
- 10.4.15.2. Market Analysis, Forecast, and Y-O-Y Growth Rate, 2019 - 2032, (US$ Million)
- 10.4.15.3. Rest of APAC Market Size and Forecast, By Service, 2019 - 2032 (US$ Million)
- 10.4.15.4. Rest of APAC Market Size and Forecast, By Model Type, 2019 - 2032 (US$ Million)
- 10.4.15.5. Rest of APAC Market Size and Forecast, By End Uses, 2019 - 2032 (US$ Million)
- 10.5. Latin America
- 10.5.1. Overview
- 10.5.2. Preclinical CRO Key Manufacturers in Latin America
- 10.5.3. Latin America Market Size and Forecast, By Country, 2019 - 2032 (US$ Million)
- 10.5.4. Latin America Market Size and Forecast, By Service, 2019 - 2032 (US$ Million)
- 10.5.5. Latin America Market Size and Forecast, By Model Type, 2019 - 2032 (US$ Million)
- 10.5.6. Latin America Market Size and Forecast, By End Uses, 2019 - 2032 (US$ Million)
- 10.5.7. Brazil
- 10.5.7.1. Overview
- 10.5.7.2. Market Analysis, Forecast, and Y-O-Y Growth Rate, 2019 - 2032, (US$ Million)
- 10.5.7.3. Brazil Market Size and Forecast, By Service, 2019 - 2032 (US$ Million)
- 10.5.7.4. Brazil Market Size and Forecast, By Model Type, 2019 - 2032 (US$ Million)
- 10.5.7.5. Brazil Market Size and Forecast, By End Uses, 2019 - 2032 (US$ Million)
- 10.5.8. Mexico
- 10.5.8.1. Overview
- 10.5.8.2. Market Analysis, Forecast, and Y-O-Y Growth Rate, 2019 - 2032, (US$ Million)
- 10.5.8.3. Mexico Market Size and Forecast, By Service, 2019 - 2032 (US$ Million)
- 10.5.8.4. Mexico Market Size and Forecast, By Model Type, 2019 - 2032 (US$ Million)
- 10.5.8.5. Mexico Market Size and Forecast, By End Uses, 2019 - 2032 (US$ Million)
- 10.5.9. Argentina
- 10.5.9.1. Overview
- 10.5.9.2. Market Analysis, Forecast, and Y-O-Y Growth Rate, 2019 - 2032, (US$ Million)
- 10.5.9.3. Argentina Market Size and Forecast, By Service, 2019 - 2032 (US$ Million)
- 10.5.9.4. Argentina Market Size and Forecast, By Model Type, 2019 - 2032 (US$ Million)
- 10.5.9.5. Argentina Market Size and Forecast, By End Uses, 2019 - 2032 (US$ Million)
- 10.5.10. Colombia
- 10.5.10.1. Overview
- 10.5.10.2. Market Analysis, Forecast, and Y-O-Y Growth Rate, 2019 - 2032, (US$ Million)
- 10.5.10.3. Colombia Market Size and Forecast, By Service, 2019 - 2032 (US$ Million)
- 10.5.10.4. Colombia Market Size and Forecast, By Model Type, 2019 - 2032 (US$ Million)
- 10.5.10.5. Colombia Market Size and Forecast, By End Uses, 2019 - 2032 (US$ Million)
- 10.5.11. Rest of LATAM
- 10.5.11.1. Overview
- 10.5.11.2. Market Analysis, Forecast, and Y-O-Y Growth Rate, 2019 - 2032, (US$ Million)
- 10.5.11.3. Rest of LATAM Market Size and Forecast, By Service, 2019 - 2032 (US$ Million)
- 10.5.11.4. Rest of LATAM Market Size and Forecast, By Model Type, 2019 - 2032 (US$ Million)
- 10.5.11.5. Rest of LATAM Market Size and Forecast, By End Uses, 2019 - 2032 (US$ Million)
- 10.6. Middle East and Africa
- 10.6.1. Overview
- 10.6.2. Preclinical CRO Key Manufacturers in Middle East and Africa
- 10.6.3. Middle East and Africa Market Size and Forecast, By Country, 2019 - 2032 (US$ Million)
- 10.6.4. Middle East and Africa Market Size and Forecast, By Service, 2019 - 2032 (US$ Million)
- 10.6.5. Middle East and Africa Market Size and Forecast, By Model Type, 2019 - 2032 (US$ Million)
- 10.6.6. Middle East and Africa Market Size and Forecast, By End Uses, 2019 - 2032 (US$ Million)
- 10.6.7. Saudi Arabia
- 10.6.7.1. Overview
- 10.6.7.2. Market Analysis, Forecast, and Y-O-Y Growth Rate, 2019 - 2032, (US$ Million)
- 10.6.7.3. Saudi Arabia Market Size and Forecast, By Service, 2019 - 2032 (US$ Million)
- 10.6.7.4. Saudi Arabia Market Size and Forecast, By Model Type, 2019 - 2032 (US$ Million)
- 10.6.7.5. Saudi Arabia Market Size and Forecast, By End Uses, 2019 - 2032 (US$ Million)
- 10.6.8. United Arab Emirates
- 10.6.8.1. Overview
- 10.6.8.2. Market Analysis, Forecast, and Y-O-Y Growth Rate, 2019 - 2032, (US$ Million)
- 10.6.8.3. United Arab Emirates Market Size and Forecast, By Service, 2019 - 2032 (US$ Million)
- 10.6.8.4. United Arab Emirates Market Size and Forecast, By Model Type, 2019 - 2032 (US$ Million)
- 10.6.8.5. United Arab Emirates Market Size and Forecast, By End Uses, 2019 - 2032 (US$ Million)
- 10.6.9. Israel
- 10.6.9.1. Overview
- 10.6.9.2. Market Analysis, Forecast, and Y-O-Y Growth Rate, 2019 - 2032, (US$ Million)
- 10.6.9.3. Israel Market Size and Forecast, By Service, 2019 - 2032 (US$ Million)
- 10.6.9.4. Israel Market Size and Forecast, By Model Type, 2019 - 2032 (US$ Million)
- 10.6.9.5. Israel Market Size and Forecast, By End Uses, 2019 - 2032 (US$ Million)
- 10.6.10. Turkey
- 10.6.10.1. Overview
- 10.6.10.2. Market Analysis, Forecast, and Y-O-Y Growth Rate, 2019 - 2032, (US$ Million)
- 10.6.10.3. Turkey Market Size and Forecast, By Service, 2019 - 2032 (US$ Million)
- 10.6.10.4. Turkey Market Size and Forecast, By Model Type, 2019 - 2032 (US$ Million)
- 10.6.10.5. Turkey Market Size and Forecast, By End Uses, 2019 - 2032 (US$ Million)
- 10.6.11. Algeria
- 10.6.11.1. Overview
- 10.6.11.2. Market Analysis, Forecast, and Y-O-Y Growth Rate, 2019 - 2032, (US$ Million)
- 10.6.11.3. Algeria Market Size and Forecast, By Service, 2019 - 2032 (US$ Million)
- 10.6.11.4. Algeria Market Size and Forecast, By Model Type, 2019 - 2032 (US$ Million)
- 10.6.11.5. Algeria Market Size and Forecast, By End Uses, 2019 - 2032 (US$ Million)
- 10.6.12. Egypt
- 10.6.12.1. Overview
- 10.6.12.2. Market Analysis, Forecast, and Y-O-Y Growth Rate, 2019 - 2032, (US$ Million)
- 10.6.12.3. Egypt Market Size and Forecast, By Service, 2019 - 2032 (US$ Million)
- 10.6.12.4. Egypt Market Size and Forecast, By Model Type, 2019 - 2032 (US$ Million)
- 10.6.12.5. Egypt Market Size and Forecast, By End Uses, 2019 - 2032 (US$ Million)
- 10.6.13. Rest of MEA
- 10.6.13.1. Overview
- 10.6.13.2. Market Analysis, Forecast, and Y-O-Y Growth Rate, 2019 - 2032, (US$ Million)
- 10.6.13.3. Rest of MEA Market Size and Forecast, By Service, 2019 - 2032 (US$ Million)
- 10.6.13.4. Rest of MEA Market Size and Forecast, By Model Type, 2019 - 2032 (US$ Million)
- 10.6.13.5. Rest of MEA Market Size and Forecast, By End Uses, 2019 - 2032 (US$ Million)
11. Key Vendor Analysis- Preclinical CRO Industry
- 11.1. Competitive Dashboard
- 11.2. Company Profiles
- 11.2.1. Eurofins Scientific
- 11.2.2. LABCORP
- 11.2.3. PRA Health Sciences, Inc.
- 11.2.4. Wuxi AppTec
- 11.2.5. Medpace, Inc.
- 11.2.6. PPD (Thermo Fisher Scientific, Inc.)
- 11.2.7. Charles River Laboratories International, Inc.
- 11.2.8. SGA SA
- 11.2.9. Intertek Group Plc (IGP)
- 11.2.10. Crown Bioscience
- 11.2.11. Others
12. 360 Degree Analyst View
13. Appendix
- 13.1. Research Methodology
- 13.2. References
- 13.3. Abbreviations
- 13.4. Disclaimer
- 13.5. Contact Us
