|
|
市場調査レポート
商品コード
1485834
カーボン検証市場:製品タイプ別、組織規模別、エンドユーザー別、国別、地域別 - 産業分析、市場規模、市場シェア、予測、2024年~2032年Carbon Verification Market, By Product Type, By Organization Size, By End User, By Country, and By Region - Industry Analysis, Market Size, Market Share & Forecast from 2024-2032 |
||||||
|
|||||||
カスタマイズ可能
|
|||||||


| カーボン検証市場:製品タイプ別、組織規模別、エンドユーザー別、国別、地域別 - 産業分析、市場規模、市場シェア、予測、2024年~2032年 |
|
出版日: 2024年05月17日
発行: AnalystView Market Insights
ページ情報: 英文 260 Pages
納期: 2~3営業日
|

全表示
- 概要
- 図表
- 目次
レポートハイライト
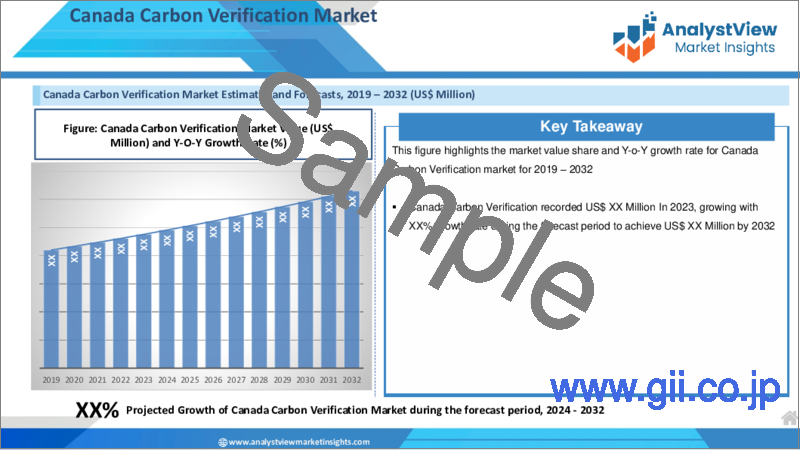
カーボン検証市場規模は2023年に119億9,910万米ドルとなり、2024年から2032年にかけてCAGR 25.5%で拡大
カーボン検証市場- 市場力学
気候変動に対する意識の高まりと温室効果ガス排出削減の必要性
気候変動に対する意識の高まりと温室効果ガス排出量削減の必要性は、決定的な課題の一つです。異常気象から海面上昇、生物多様性の損失、食糧や水の安全保障への脅威まで、気候変動の深刻な影響を認識する人が増えています。気候変動対策の世界の基準であるVerraによると、2020年現在、1,500以上のVCSプロジェクトが認定されています。Verraは、2021年に110のプロジェクトに対して300 MtCO2eのオフセットクレジットを提供しました。さらに、世界で最も普及している温室効果ガス(GHG)クレジットプログラムは、Verified Carbon Standard(VCS)プログラムです。VCSプログラムのおかげで、10億トン以上の炭素やその他の温室効果ガスの排出が削減されたり、環境から排除されたりしています。私たちの共通の環境を守るための継続的な努力の重要かつ常に変化する部分が、VCSプログラムなのです。
カーボン検証市場-主な洞察
弊社のリサーチアナリストの分析によると、世界市場は予測期間(2024-2032年)に約25.5%のCAGRで毎年成長すると予測されています。
製品タイプ別では、化学分析が2023年に最大の市場シェアを示すと予測されています。
エンドユーザーセグメンテーションに基づくと、2023年にはエネルギーが主要タイプでした。
地域別では、欧州が2023年に収益をもたらす主要市場です。
カーボン検証市場-セグメンテーション分析:
世界のカーボン検証市場は、製品タイプ、組織規模、エンドユーザー、地域によって区分されます。
市場は製品タイプによって3つに分類される:化学分析、光学分析、その他。タイプによって、化学分析市場は、持続可能性の目標の変化、市場の需要、規制の変更に影響されたダイナミックなビジネス動向を見ています。炭素クレジットは、政府や規制機関によってますます厳しくなる排出削減基準を企業が遵守するために必要です。要求されるコンプライアンス要件と自発的なコミットメントの両方により、カーボンニュートラルを目指す企業が増えるにつれ、この業界では需要が急増しています。
市場はエンドユーザーによって6つのカテゴリーに分けられる:エネルギー、輸送、住宅・商業ビル、工業、農業、上下水道です。最も市場シェアの高いエンドユーザー分野は、林業と土地利用です。森林再生と再植林の取り組みは、市場において重要な役割を果たすようになり、気候変動緩和のアプローチに大きな変化をもたらしています。これらのプログラムは、生物多様性の保全や生態系の回復を促進すると同時に、炭素を効果的に貯蔵する能力を持っていることで、ますます知られるようになってきています。
カーボン検証市場-地理的洞察
欧州は、欧州連合排出量取引制度(EU ETS)を含む強力な規制枠組みを構築し、市場をリードしてきました。自主市場、規制遵守、排出削減目標の義務化により、この地域ではカーボン検証サービスに対する需要が大幅に増加しています。EUの強力な気候変動対策の結果、EUの排出量は2022年に1990年比で31%以上減少しました。これは主に、再生可能エネルギー源の使用増加と、炭素含有量の多い化石燃料の使用減少によるものです。こうした目標の達成は、エネルギー効率の向上と経済の構造調整によっても可能になりました。
カーボン検証市場-競合情勢:
カーボン検証市場の主要企業には、DNV GL、SGS SA、TUV NORD GROUP、PwC、UL LLC、Deloitte Touche Tohmatsu Limitedなどがあります。さらに、各国の政府機関や規制機関も、炭素規制や報告要件への準拠を確保するために、カーボン検証サービスを提供したり、検証プロセスを監督したりすることがあります。2023年10月、ABBとImperial Collegeは、将来の労働力とエネルギー転換を支援するため、炭素捕捉の協力関係を拡大しました。
目次
第1章 カーボン検証市場概要
- 調査範囲
- 市場推定年
第2章 エグゼクティブサマリー
- 市場内訳
- 競合考察
第3章 カーボン検証の主要市場動向
- 市場促進要因
- 市場抑制要因
- 市場機会
- 市場の将来動向
第4章 カーボン検証産業研究
- PEST分析
- ポーターのファイブフォース分析
- 成長見通しマッピング
- 規制枠組み分析
第5章 カーボン検証市場:COVID-19の影響分析
- COVID-19以前の影響分析
- COVID-19後の影響分析
第6章 カーボン検証市場情勢
- カーボン検証市場シェア分析、2023年
- 主要メーカー別の内訳データ
- 既存企業の分析
- 新興企業の分析
第7章 カーボン検証市場:製品タイプ別
- 概要
- 製品タイプ別のセグメントシェア分析
- 化学分析
- 光学分析
- その他
第8章 カーボン検証市場:組織規模別
- 概要
- 組織規模別のセグメントシェア分析
- 大企業
- 中小企業
第9章 カーボン検証市場:エンドユーザー別
- 概要
- エンドユーザー別のセグメントシェア分析
- エネルギー
- 輸送
- 住宅・商業ビル
- 産業
- 農業
- 水・廃水
第10章 カーボン検証市場:地域別
- イントロダクション
- 北米
- 概要
- 北米の主要メーカー
- 米国
- カナダ
- 欧州
- 概要
- 欧州の主要メーカー
- ドイツ
- イタリア
- 英国
- フランス
- ロシア
- オランダ
- スウェーデン
- ポーランド
- その他
- アジア太平洋(APAC)
- 概要
- アジア太平洋の主要メーカー
- インド
- 中国
- 日本
- 韓国
- オーストラリア
- タイ
- インドネシア
- フィリピン
- その他
- ラテンアメリカ
- 概要
- ラテンアメリカの主要メーカー
- ブラジル
- メキシコ
- アルゼンチン
- コロンビア
- その他
- 中東・アフリカ
- 概要
- 中東・アフリカの主要メーカー
- サウジアラビア
- アラブ首長国連邦
- イスラエル
- トルコ
- アルジェリア
- エジプト
- その他
第11章 主要ベンダー分析:カーボン検証業界
- 競合ダッシュボード
- 企業プロファイル
- DNV GL
- SGS SA
- Bureau Veritas
- TUV NORD GROUP
- Intertek Group plc
- Carbon Trust
- First Environment, Inc.
- PwC
- NSF International
- UL LLC
- COTECNA
- SCS Global Services
- KPMG International Cooperative
- Deloitte Touche Tohmatsu Limited
- Others
第12章 アナリストの全方位展望
List of Tables
- TABLE List of data sources
- TABLE Market drivers; Impact Analysis
- TABLE Market restraints; Impact Analysis
- TABLE Carbon Verification Market: Product Type Snapshot (2023)
- TABLE Segment Dashboard; Definition and Scope, by Product Type
- TABLE Global Carbon Verification Market, by Product Type 2019-2032 (USD Million)
- TABLE Carbon Verification Market: Organization Size Snapshot (2023)
- TABLE Segment Dashboard; Definition and Scope, by Organization Size
- TABLE Global Carbon Verification Market, by Organization Size 2019-2032 (USD Million)
- TABLE Carbon Verification Market: End User Snapshot (2023)
- TABLE Segment Dashboard; Definition and Scope, by End User
- TABLE Global Carbon Verification Market, by End User 2019-2032 (USD Million)
- TABLE Carbon Verification Market: Regional snapshot (2023)
- TABLE Segment Dashboard; Definition and Scope, by Region
- TABLE Global Carbon Verification Market, by Region 2019-2032 (USD Million)
- TABLE North America Carbon Verification Market, by Country, 2019-2032 (USD Million)
- TABLE North America Carbon Verification Market, by Product Type, 2019-2032 (USD Million)
- TABLE North America Carbon Verification Market, by Organization Size, 2019-2032 (USD Million)
- TABLE North America Carbon Verification Market, by End User, 2019-2032 (USD Million)
- TABLE Europe Carbon Verification Market, by Country, 2019-2032 (USD Million)
- TABLE Europe Carbon Verification Market, by Product Type, 2019-2032 (USD Million)
- TABLE Europe Carbon Verification Market, by Organization Size, 2019-2032 (USD Million)
- TABLE Europe Carbon Verification Market, by End User, 2019-2032 (USD Million)
- TABLE Asia Pacific Carbon Verification Market, by Country, 2019-2032 (USD Million)
- TABLE Asia Pacific Carbon Verification Market, by Product Type, 2019-2032 (USD Million)
- TABLE Asia Pacific Carbon Verification Market, by Organization Size, 2019-2032 (USD Million)
- TABLE Asia Pacific Carbon Verification Market, by End User, 2019-2032 (USD Million)
- TABLE Latin America Carbon Verification Market, by Country, 2019-2032 (USD Million)
- TABLE Latin America Carbon Verification Market, by Product Type, 2019-2032 (USD Million)
- TABLE Latin America Carbon Verification Market, by Organization Size, 2019-2032 (USD Million)
- TABLE Latin America Carbon Verification Market, by End User, 2019-2032 (USD Million)
- TABLE Middle East and Africa Carbon Verification Market, by Country, 2019-2032 (USD Million)
- TABLE Middle East and Africa Carbon Verification Market, by Product Type, 2019-2032 (USD Million)
- TABLE Middle East and Africa Carbon Verification Market, by Organization Size, 2019-2032 (USD Million)
- TABLE Middle East and Africa Carbon Verification Market, by End User, 2019-2032 (USD Million)
REPORT HIGHLIGHT
Carbon Verification Market size was valued at USD 11,999.10 million in 2023, expanding at a CAGR of 25.5% from 2024 to 2032.
Carbon verification typically refers to the process of assessing and confirming the amount of carbon emissions reduced, avoided, or sequestered by a particular project or activity. This process is essential for ensuring the credibility and integrity of carbon offset projects, which aim to mitigate climate change by reducing greenhouse gas emissions. Government policies and regulations can significantly influence the growth of carbon markets. The implementation of carbon pricing mechanisms such as cap-and-trade systems or carbon taxes can stimulate market demand for carbon credits. Many companies are increasingly adopting carbon reduction targets as part of their sustainability strategies.
Carbon Verification Market- Market Dynamics
Rising Awareness Of Climate Change & Need to Reduce Greenhouse Gas Emissions
Rising awareness of climate change and the imperative to reduce greenhouse gas emissions is one of the defining challenges. People are increasingly recognizing the severe impacts of climate change, from extreme weather events to rising sea levels, biodiversity loss, and threats to food and water security. According to Verra, the world's leading standards for climate action, there were more than 1,500 accredited VCS projects as of 2020. Verra provided offset credits of 300 MtCO2e for 110 projects in 2021. Moreover, the most popular greenhouse gas (GHG) crediting program in the world is the Verified Carbon Standard (VCS) Programme. More than a billion tonnes of carbon and other GHG emissions have been lowered or eliminated from the environment because of VCS programs. A vital and always-changing part of the continuous endeavor to safeguard our common environment is the VCS Programme.
Carbon Verification Market- Key Insights
As per the analysis shared by our research analyst, the global market is estimated to grow annually at a CAGR of around 25.5% over the forecast period (2024-2032)
Based on product type segmentation, chemical analysis was predicted to show maximum market share in the year 2023
Based on end user segmentation, energy was the leading type in 2023
Based on region, Europe was the leading revenue generator in 2023
Carbon Verification Market- Segmentation Analysis:
The Global Carbon Verification Market is segmented based on Product Type, Organization Size, End User, and Region.
The market is divided into three categories based on product type: Chemical analysis, optical analysis, and Others. Depending on the type, the chemical analysis market is seeing dynamic business trends influenced by shifting sustainability objectives, market demands, and regulatory changes. Carbon credits are necessary for businesses to comply with the increasingly strict emissions reduction standards set by governments and regulatory organizations. Due to both required compliance requirements and voluntary commitments, the industry is seeing a spike in demand as more businesses commit to becoming carbon neutral.
The market is divided into six categories based on end-user: Energy, Transportation, Residential & Commercial Buildings, Industrial, Agricultural, and Water & Wastewater. The end-user segment with the most market share is forestry and land use. Reforestation and reforestation initiatives have become important players in the carbon credit market, leading to a significant shift in the approaches to mitigating climate change. These programmes are becoming more and more well-known for their ability to effectively store carbon while also promoting the preservation of biodiversity and the restoration of ecosystems.
Carbon Verification Market- Geographical Insights
Europe has created a strong regulatory framework, which includes the European Union Emissions Trading System (EU ETS) and has been a leader in the carbon market. Due to the voluntary market, regulatory compliance, and obligatory emission reduction targets, there has been a significant increase in demand for carbon verification services in the region. As a result of the EU's strong climate change response, EU emissions fell by more than 31% in 2022 when compared to 1990 levels. This is mostly due to a rise in the use of renewable energy sources and a decline in the usage of fossil fuels with high carbon content. Achieving these objectives was also made possible by advancements in energy efficiency and structural adjustments in the economy.
Carbon Verification Market- Competitive Landscape:
Large consulting firms like Deloitte, PricewaterhouseCoopers (PwC), Ernst & Young (EY), and KPMG offer carbon verification services as part of their broader sustainability and environmental consulting practices. Major players in the carbon verification market include DNV GL, SGS SA, TUV NORD GROUP, PwC, UL LLC, Deloitte Touche Tohmatsu Limited, etc. Moreover, government agencies and regulatory bodies in various countries may also offer carbon verification services or oversee verification processes to ensure compliance with carbon regulations and reporting requirements. In October 2023, ABB and Imperial College extended carbon capture collaboration to support future workforce and energy transition.
Recent Developments:
In February 2024, The U.S. Department of Energy (DOE) collaborated with the National Renewable Energy Laboratory (NREL) to support a new $15 million research effort to improve the measurement, reporting, and verification (MRV) of carbon dioxide (CO2) removal technologies.
In May 2023, ABU DHABI, UAE and GENEVA, ACX Ltd, the UAE-based global exchange revolutionizing the voluntary carbon market, and Carbon Offset Certification (COC), collaborated to support the commodity industry on its journey to carbon neutrality.
SCOPE OF THE REPORT
The scope of this report covers the market by its major segments, which include as follows:
GLOBAL CARBON VERIFICATION MARKET KEY PLAYERS- DETAILED COMPETITIVE INSIGHTS
DNV GL
SGS SA
Bureau Veritas
TUV NORD GROUP
Intertek Group plc
Carbon Trust
First Environment, Inc.
PwC
NSF International
UL LLC
COTECNA
SCS Global Services
KPMG International Cooperative
Deloitte Touche Tohmatsu Limited
Others
GLOBAL CARBON VERIFICATION MARKET, BY PRODUCT TYPE- MARKET ANALYSIS, 2019 - 2032
- Chemical Analysis
- Optical Analysis
- Others
GLOBAL CARBON VERIFICATION MARKET, BY ORGANIZATION SIZE - MARKET ANALYSIS, 2019 - 2032
- Large Enterprises
- Small and Medium Enterprises (SMEs)
GLOBAL CARBON VERIFICATION MARKET, BY END USER - MARKET ANALYSIS, 2019 - 2032
- Energy
- Transportation
- Residential & Commercial Buildings
- Industrial
- Agricultural
- Water & Wastewater
GLOBAL CARBON VERIFICATION MARKET, BY REGION- MARKET ANALYSIS, 2019 - 2032
- North America
- The U.S.
- Canada
- Europe
- Germany
- France
- Italy
- Spain
- United Kingdom
- Russia
- Netherlands
- Sweden
- Poland
- Rest of Europe
- Asia Pacific
- India
- China
- South Korea
- Japan
- Australia
- Thailand
- Indonesia
- Philippines
- Rest of APAC
- Latin America
- Brazil
- Mexico
- Argentina
- Colombia
- Rest of LATAM
- The Middle East and Africa
- Saudi Arabia
- United Arab Emirates
- Israel
- Turkey
- Algeria
- Egypt
- Rest of MEA
Table of Contents
1.Carbon Verification Market Overview
- 1.1.Study Scope
- 1.2.Market Estimation Years
2.Executive Summary
- 2.1.Market Snippet
- 2.1.1.Carbon Verification Market Snippet by Product Type
- 2.1.2.Carbon Verification Market Snippet by Organization Size
- 2.1.3.Carbon Verification Market Snippet by End User
- 2.1.4.Carbon Verification Market Snippet by Country
- 2.1.5.Carbon Verification Market Snippet by Region
- 2.2.Competitive Insights
3.Carbon Verification Key Market Trends
- 3.1.Carbon Verification Market Drivers
- 3.1.1.Impact Analysis of Market Drivers
- 3.2.Carbon Verification Market Restraints
- 3.2.1.Impact Analysis of Market Restraints
- 3.3.Carbon Verification Market Opportunities
- 3.4.Carbon Verification Market Future Trends
4.Carbon Verification Industry Study
- 4.1.PEST Analysis
- 4.2.Porter's Five Forces Analysis
- 4.3.Growth Prospect Mapping
- 4.4.Regulatory Framework Analysis
5.Carbon Verification Market: COVID-19 Impact Analysis
- 5.1.Pre-COVID-19 Impact Analysis
- 5.2.Post-COVID-19 Impact Analysis
- 5.2.1.Top Performing Segments
- 5.2.2.Marginal Growth Segments
- 5.2.3.Top Looser Segments
- 5.2.4.Marginal Loss Segments
6.Carbon Verification Market Landscape
- 6.1.Carbon Verification Market Share Analysis, 2023
- 6.2.Breakdown Data, by Key Manufacturer
- 6.2.1.Established Players' Analysis
- 6.2.2.Emerging Players' Analysis
7.Carbon Verification Market - By Product Type
- 7.1.Overview
- 7.1.1.Segment Share Analysis, By Product Type, 2023 & 2032 (%)
- 7.1.2.Chemical Analysis
- 7.1.3.Optical Analysis
- 7.1.4.Others
8.Carbon Verification Market - By Organization Size
- 8.1.Overview
- 8.1.1.Segment Share Analysis, By Organization Size, 2023 & 2032 (%)
- 8.1.2.Large Enterprises
- 8.1.3.Small and Medium Enterprises (SMEs)
9.Carbon Verification Market - By End User
- 9.1.Overview
- 9.1.1.Segment Share Analysis, By End User, 2023 & 2032 (%)
- 9.1.2.Energy
- 9.1.3.Transportation
- 9.1.4.Residential & Commercial Buildings
- 9.1.5.Industrial
- 9.1.6.Agricultural
- 9.1.7.Water & Wastewater
10.Carbon Verification Market- By Geography
- 10.1.Introduction
- 10.1.1.Segment Share Analysis, By Geography, 2023 & 2032 (%)
- 10.2.North America
- 10.2.1.Overview
- 10.2.2.Carbon Verification Key Manufacturers in North America
- 10.2.3.North America Market Size and Forecast, By Country, 2019 - 2032 (US$ Million)
- 10.2.4.North America Market Size and Forecast, By Product Type, 2019 - 2032 (US$ Million)
- 10.2.5.North America Market Size and Forecast, By Organization Size, 2019 - 2032 (US$ Million)
- 10.2.6.North America Market Size and Forecast, By End User, 2019 - 2032 (US$ Million)
- 10.2.7.U.S.
- 10.2.7.1.Overview
- 10.2.7.2.Market Analysis, Forecast, and Y-O-Y Growth Rate, 2019 - 2032, (US$ Million)
- 10.2.7.3.U.S. Market Size and Forecast, By Product Type, 2019 - 2032 (US$ Million)
- 10.2.7.4.U.S. Market Size and Forecast, By Organization Size, 2019 - 2032 (US$ Million)
- 10.2.7.5.U.S. Market Size and Forecast, By End User, 2019 - 2032 (US$ Million)
- 10.2.8.Canada
- 10.2.8.1.Overview
- 10.2.8.2.Market Analysis, Forecast, and Y-O-Y Growth Rate, 2019 - 2032, (US$ Million)
- 10.2.8.3.Canada Market Size and Forecast, By Product Type, 2019 - 2032 (US$ Million)
- 10.2.8.4.Canada Market Size and Forecast, By Organization Size, 2019 - 2032 (US$ Million)
- 10.2.8.5.Canada Market Size and Forecast, By End User, 2019 - 2032 (US$ Million)
- 10.3.Europe
- 10.3.1.Overview
- 10.3.2.Carbon Verification Key Manufacturers in Europe
- 10.3.3.Europe Market Size and Forecast, By Country, 2019 - 2032 (US$ Million)
- 10.3.4.Europe Market Size and Forecast, By Product Type, 2019 - 2032 (US$ Million)
- 10.3.5.Europe Market Size and Forecast, By Organization Size, 2019 - 2032 (US$ Million)
- 10.3.6.Europe Market Size and Forecast, By End User, 2019 - 2032 (US$ Million)
- 10.3.7.Germany
- 10.3.7.1.Overview
- 10.3.7.2.Market Analysis, Forecast, and Y-O-Y Growth Rate, 2019 - 2032, (US$ Million)
- 10.3.7.3.Germany Market Size and Forecast, By Product Type, 2019 - 2032 (US$ Million)
- 10.3.7.4.Germany Market Size and Forecast, By Organization Size, 2019 - 2032 (US$ Million)
- 10.3.7.5.Germany Market Size and Forecast, By End User, 2019 - 2032 (US$ Million)
- 10.3.8.Italy
- 10.3.8.1.Overview
- 10.3.8.2.Market Analysis, Forecast, and Y-O-Y Growth Rate, 2019 - 2032, (US$ Million)
- 10.3.8.3.Italy Market Size and Forecast, By Product Type, 2019 - 2032 (US$ Million)
- 10.3.8.4.Italy Market Size and Forecast, By Organization Size, 2019 - 2032 (US$ Million)
- 10.3.8.5.Italy Market Size and Forecast, By End User, 2019 - 2032 (US$ Million)
- 10.3.9.United Kingdom
- 10.3.9.1.Overview
- 10.3.9.2.Market Analysis, Forecast, and Y-O-Y Growth Rate, 2019 - 2032, (US$ Million)
- 10.3.9.3.United Kingdom Market Size and Forecast, By Product Type, 2019 - 2032 (US$ Million)
- 10.3.9.4.United Kingdom Market Size and Forecast, By Organization Size, 2019 - 2032 (US$ Million)
- 10.3.9.5.United Kingdom Market Size and Forecast, By End User, 2019 - 2032 (US$ Million)
- 10.3.10.France
- 10.3.10.1.Overview
- 10.3.10.2.Market Analysis, Forecast, and Y-O-Y Growth Rate, 2019 - 2032, (US$ Million)
- 10.3.10.3.France Market Size and Forecast, By Product Type, 2019 - 2032 (US$ Million)
- 10.3.10.4.France Market Size and Forecast, By Organization Size, 2019 - 2032 (US$ Million)
- 10.3.10.5.France Market Size and Forecast, By End User, 2019 - 2032 (US$ Million)
- 10.3.11.Russia
- 10.3.11.1.Market Analysis, Forecast, and Y-O-Y Growth Rate, 2019 - 2032, (US$ Million)
- 10.3.11.2.Russia Market Size and Forecast, By Product Type, 2019 - 2032 (US$ Million)
- 10.3.11.3.Russia Market Size and Forecast, By Organization Size, 2019 - 2032 (US$ Million)
- 10.3.11.4.Russia Market Size and Forecast, By End User, 2019 - 2032 (US$ Million)
- 10.3.12.Netherlands
- 10.3.12.1.Market Analysis, Forecast, and Y-O-Y Growth Rate, 2019 - 2032, (US$ Million)
- 10.3.12.2.Netherlands Market Size and Forecast, By Product Type, 2019 - 2032 (US$ Million)
- 10.3.12.3.Netherlands Market Size and Forecast, By Organization Size, 2019 - 2032 (US$ Million)
- 10.3.12.4.Netherlands Market Size and Forecast, By End User, 2019 - 2032 (US$ Million)
- 10.3.13.Sweden
- 10.3.13.1.Market Analysis, Forecast, and Y-O-Y Growth Rate, 2019 - 2032, (US$ Million)
- 10.3.13.2.Sweden Market Size and Forecast, By Product Type, 2019 - 2032 (US$ Million)
- 10.3.13.3.Sweden Market Size and Forecast, By Organization Size, 2019 - 2032 (US$ Million)
- 10.3.13.4.Sweden Market Size and Forecast, By End User, 2019 - 2032 (US$ Million)
- 10.3.14.Poland
- 10.3.14.1.Market Analysis, Forecast, and Y-O-Y Growth Rate, 2019 - 2032, (US$ Million)
- 10.3.14.2.Poland Market Size and Forecast, By Product Type, 2019 - 2032 (US$ Million)
- 10.3.14.3.Poland Market Size and Forecast, By Organization Size, 2019 - 2032 (US$ Million)
- 10.3.14.4.Poland Market Size and Forecast, By End User, 2019 - 2032 (US$ Million)
- 10.3.15.Rest of Europe
- 10.3.15.1.Overview
- 10.3.15.2.Market Analysis, Forecast, and Y-O-Y Growth Rate, 2019 - 2032, (US$ Million)
- 10.3.15.3.Rest of the Europe Market Size and Forecast, By Product Type, 2019 - 2032 (US$ Million)
- 10.3.15.4.Rest of the Europe Market Size and Forecast, By Organization Size, 2019 - 2032 (US$ Million)
- 10.3.15.5.Rest of the Europe Market Size and Forecast, By End User, 2019 - 2032 (US$ Million)
- 10.4.Asia Pacific (APAC)
- 10.4.1.Overview
- 10.4.2.Carbon Verification Key Manufacturers in Asia Pacific
- 10.4.3.Asia Pacific Market Size and Forecast, By Country, 2019 - 2032 (US$ Million)
- 10.4.4.Asia Pacific Market Size and Forecast, By Product Type, 2019 - 2032 (US$ Million)
- 10.4.5.Asia Pacific Market Size and Forecast, By Organization Size, 2019 - 2032 (US$ Million)
- 10.4.6.Asia Pacific Market Size and Forecast, By End User, 2019 - 2032 (US$ Million)
- 10.4.7.India
- 10.4.7.1.Overview
- 10.4.7.2.Market Analysis, Forecast, and Y-O-Y Growth Rate, 2019 - 2032, (US$ Million)
- 10.4.7.3.India Market Size and Forecast, By Product Type, 2019 - 2032 (US$ Million)
- 10.4.7.4.India Market Size and Forecast, By Organization Size, 2019 - 2032 (US$ Million)
- 10.4.7.5.India Market Size and Forecast, By End User, 2019 - 2032 (US$ Million)
- 10.4.8.China
- 10.4.8.1.Overview
- 10.4.8.2.Market Analysis, Forecast, and Y-O-Y Growth Rate, 2019 - 2032, (US$ Million)
- 10.4.8.3.China Market Size and Forecast, By Product Type, 2019 - 2032 (US$ Million)
- 10.4.8.4.China Market Size and Forecast, By Organization Size, 2019 - 2032 (US$ Million)
- 10.4.8.5.China Market Size and Forecast, By End User, 2019 - 2032 (US$ Million)
- 10.4.9.Japan
- 10.4.9.1.Overview
- 10.4.9.2.Market Analysis, Forecast, and Y-O-Y Growth Rate, 2019 - 2032, (US$ Million)
- 10.4.9.3.Japan Market Size and Forecast, By Product Type, 2019 - 2032 (US$ Million)
- 10.4.9.4.Japan Market Size and Forecast, By Organization Size, 2019 - 2032 (US$ Million)
- 10.4.9.5.Japan Market Size and Forecast, By End User, 2019 - 2032 (US$ Million)
- 10.4.10.South Korea
- 10.4.10.1.Overview
- 10.4.10.2.Market Analysis, Forecast, and Y-O-Y Growth Rate, 2019 - 2032, (US$ Million)
- 10.4.10.3.South Korea Market Size and Forecast, By Product Type, 2019 - 2032 (US$ Million)
- 10.4.10.4.South Korea Market Size and Forecast, By Organization Size, 2019 - 2032 (US$ Million)
- 10.4.10.5.South Korea Market Size and Forecast, By End User, 2019 - 2032 (US$ Million)
- 10.4.11.Australia
- 10.4.11.1.Overview
- 10.4.11.2.Market Analysis, Forecast, and Y-O-Y Growth Rate, 2019 - 2032, (US$ Million)
- 10.4.11.3.Australia Market Size and Forecast, By Product Type, 2019 - 2032 (US$ Million)
- 10.4.11.4.Australia Market Size and Forecast, By Organization Size, 2019 - 2032 (US$ Million)
- 10.4.11.5.Australia Market Size and Forecast, By End User, 2019 - 2032 (US$ Million)
- 10.4.12.Thailand
- 10.4.12.1.Overview
- 10.4.12.2.Market Analysis, Forecast, and Y-O-Y Growth Rate, 2019 - 2032, (US$ Million)
- 10.4.12.3.Thailand Market Size and Forecast, By Product Type, 2019 - 2032 (US$ Million)
- 10.4.12.4.Thailand Market Size and Forecast, By Organization Size, 2019 - 2032 (US$ Million)
- 10.4.12.5.Thailand Market Size and Forecast, By End User, 2019 - 2032 (US$ Million)
- 10.4.13.Indonesia
- 10.4.13.1.Overview
- 10.4.13.2.Market Analysis, Forecast, and Y-O-Y Growth Rate, 2019 - 2032, (US$ Million)
- 10.4.13.3.Indonesia Market Size and Forecast, By Product Type, 2019 - 2032 (US$ Million)
- 10.4.13.4.Indonesia Market Size and Forecast, By Organization Size, 2019 - 2032 (US$ Million)
- 10.4.13.5.Indonesia Market Size and Forecast, By End User, 2019 - 2032 (US$ Million)
- 10.4.14.Philippines
- 10.4.14.1.Overview
- 10.4.14.2.Market Analysis, Forecast, and Y-O-Y Growth Rate, 2019 - 2032, (US$ Million)
- 10.4.14.3.Philippines Market Size and Forecast, By Product Type, 2019 - 2032 (US$ Million)
- 10.4.14.4.Philippines Market Size and Forecast, By Organization Size, 2019 - 2032 (US$ Million)
- 10.4.14.5.Philippines Market Size and Forecast, By End User, 2019 - 2032 (US$ Million)
- 10.4.15.Rest of APAC
- 10.4.15.1.Overview
- 10.4.15.2.Market Analysis, Forecast, and Y-O-Y Growth Rate, 2019 - 2032, (US$ Million)
- 10.4.15.3.Rest of APAC Market Size and Forecast, By Product Type, 2019 - 2032 (US$ Million)
- 10.4.15.4.Rest of APAC Market Size and Forecast, By Organization Size, 2019 - 2032 (US$ Million)
- 10.4.15.5.Rest of APAC Market Size and Forecast, By End User, 2019 - 2032 (US$ Million)
- 10.5.Latin America
- 10.5.1.Overview
- 10.5.2.Carbon Verification Key Manufacturers in Latin America
- 10.5.3.Latin America Market Size and Forecast, By Country, 2019 - 2032 (US$ Million)
- 10.5.4.Latin America Market Size and Forecast, By Product Type, 2019 - 2032 (US$ Million)
- 10.5.5.Latin America Market Size and Forecast, By Organization Size, 2019 - 2032 (US$ Million)
- 10.5.6.Latin America Market Size and Forecast, By End User, 2019 - 2032 (US$ Million)
- 10.5.7.Brazil
- 10.5.7.1.Overview
- 10.5.7.2.Market Analysis, Forecast, and Y-O-Y Growth Rate, 2019 - 2032, (US$ Million)
- 10.5.7.3.Brazil Market Size and Forecast, By Product Type, 2019 - 2032 (US$ Million)
- 10.5.7.4.Brazil Market Size and Forecast, By Organization Size, 2019 - 2032 (US$ Million)
- 10.5.7.5.Brazil Market Size and Forecast, By End User, 2019 - 2032 (US$ Million)
- 10.5.8.Mexico
- 10.5.8.1.Overview
- 10.5.8.2.Market Analysis, Forecast, and Y-O-Y Growth Rate, 2019 - 2032, (US$ Million)
- 10.5.8.3.Mexico Market Size and Forecast, By Product Type, 2019 - 2032 (US$ Million)
- 10.5.8.4.Mexico Market Size and Forecast, By Organization Size, 2019 - 2032 (US$ Million)
- 10.5.8.5.Mexico Market Size and Forecast, By End User, 2019 - 2032 (US$ Million)
- 10.5.9.Argentina
- 10.5.9.1.Overview
- 10.5.9.2.Market Analysis, Forecast, and Y-O-Y Growth Rate, 2019 - 2032, (US$ Million)
- 10.5.9.3.Argentina Market Size and Forecast, By Product Type, 2019 - 2032 (US$ Million)
- 10.5.9.4.Argentina Market Size and Forecast, By Organization Size, 2019 - 2032 (US$ Million)
- 10.5.9.5.Argentina Market Size and Forecast, By End User, 2019 - 2032 (US$ Million)
- 10.5.10.Colombia
- 10.5.10.1.Overview
- 10.5.10.2.Market Analysis, Forecast, and Y-O-Y Growth Rate, 2019 - 2032, (US$ Million)
- 10.5.10.3.Colombia Market Size and Forecast, By Product Type, 2019 - 2032 (US$ Million)
- 10.5.10.4.Colombia Market Size and Forecast, By Organization Size, 2019 - 2032 (US$ Million)
- 10.5.10.5.Colombia Market Size and Forecast, By End User, 2019 - 2032 (US$ Million)
- 10.5.11.Rest of LATAM
- 10.5.11.1.Overview
- 10.5.11.2.Market Analysis, Forecast, and Y-O-Y Growth Rate, 2019 - 2032, (US$ Million)
- 10.5.11.3.Rest of LATAM Market Size and Forecast, By Product Type, 2019 - 2032 (US$ Million)
- 10.5.11.4.Rest of LATAM Market Size and Forecast, By Organization Size, 2019 - 2032 (US$ Million)
- 10.5.11.5.Rest of LATAM Market Size and Forecast, By End User, 2019 - 2032 (US$ Million)
- 10.6.Middle East and Africa
- 10.6.1.Overview
- 10.6.2.Carbon Verification Key Manufacturers in Middle East and Africa
- 10.6.3.Middle East and Africa Market Size and Forecast, By Country, 2019 - 2032 (US$ Million)
- 10.6.4.Middle East and Africa Market Size and Forecast, By Product Type, 2019 - 2032 (US$ Million)
- 10.6.5.Middle East and Africa Market Size and Forecast, By Organization Size, 2019 - 2032 (US$ Million)
- 10.6.6.Middle East and Africa Market Size and Forecast, By End User, 2019 - 2032 (US$ Million)
- 10.6.7.Saudi Arabia
- 10.6.7.1.Overview
- 10.6.7.2.Market Analysis, Forecast, and Y-O-Y Growth Rate, 2019 - 2032, (US$ Million)
- 10.6.7.3.Saudi Arabia Market Size and Forecast, By Product Type, 2019 - 2032 (US$ Million)
- 10.6.7.4.Saudi Arabia Market Size and Forecast, By Organization Size, 2019 - 2032 (US$ Million)
- 10.6.7.5.Saudi Arabia Market Size and Forecast, By End User, 2019 - 2032 (US$ Million)
- 10.6.8.United Arab Emirates
- 10.6.8.1.Overview
- 10.6.8.2.Market Analysis, Forecast, and Y-O-Y Growth Rate, 2019 - 2032, (US$ Million)
- 10.6.8.3.United Arab Emirates Market Size and Forecast, By Product Type, 2019 - 2032 (US$ Million)
- 10.6.8.4.United Arab Emirates Market Size and Forecast, By Organization Size, 2019 - 2032 (US$ Million)
- 10.6.8.5.United Arab Emirates Market Size and Forecast, By End User, 2019 - 2032 (US$ Million)
- 10.6.9.Israel
- 10.6.9.1.Overview
- 10.6.9.2.Market Analysis, Forecast, and Y-O-Y Growth Rate, 2019 - 2032, (US$ Million)
- 10.6.9.3.Israel Market Size and Forecast, By Product Type, 2019 - 2032 (US$ Million)
- 10.6.9.4.Israel Market Size and Forecast, By Organization Size, 2019 - 2032 (US$ Million)
- 10.6.9.5.Israel Market Size and Forecast, By End User, 2019 - 2032 (US$ Million)
- 10.6.10.Turkey
- 10.6.10.1.Overview
- 10.6.10.2.Market Analysis, Forecast, and Y-O-Y Growth Rate, 2019 - 2032, (US$ Million)
- 10.6.10.3.Turkey Market Size and Forecast, By Product Type, 2019 - 2032 (US$ Million)
- 10.6.10.4.Turkey Market Size and Forecast, By Organization Size, 2019 - 2032 (US$ Million)
- 10.6.10.5.Turkey Market Size and Forecast, By End User, 2019 - 2032 (US$ Million)
- 10.6.11.Algeria
- 10.6.11.1.Overview
- 10.6.11.2.Market Analysis, Forecast, and Y-O-Y Growth Rate, 2019 - 2032, (US$ Million)
- 10.6.11.3.Algeria Market Size and Forecast, By Product Type, 2019 - 2032 (US$ Million)
- 10.6.11.4.Algeria Market Size and Forecast, By Organization Size, 2019 - 2032 (US$ Million)
- 10.6.11.5.Algeria Market Size and Forecast, By End User, 2019 - 2032 (US$ Million)
- 10.6.12.Egypt
- 10.6.12.1.Overview
- 10.6.12.2.Market Analysis, Forecast, and Y-O-Y Growth Rate, 2019 - 2032, (US$ Million)
- 10.6.12.3.Egypt Market Size and Forecast, By Product Type, 2019 - 2032 (US$ Million)
- 10.6.12.4.Egypt Market Size and Forecast, By Organization Size, 2019 - 2032 (US$ Million)
- 10.6.12.5.Egypt Market Size and Forecast, By End User, 2019 - 2032 (US$ Million)
- 10.6.13.Rest of MEA
- 10.6.13.1.Overview
- 10.6.13.2.Market Analysis, Forecast, and Y-O-Y Growth Rate, 2019 - 2032, (US$ Million)
- 10.6.13.3.Rest of MEA Market Size and Forecast, By Product Type, 2019 - 2032 (US$ Million)
- 10.6.13.4.Rest of MEA Market Size and Forecast, By Organization Size, 2019 - 2032 (US$ Million)
- 10.6.13.5.Rest of MEA Market Size and Forecast, By End User, 2019 - 2032 (US$ Million)
11.Key Vendor Analysis- Carbon Verification Industry
- 11.1.Competitive Dashboard
- 11.2.Company Profiles
- 11.2.1.DNV GL
- 11.2.2.SGS SA
- 11.2.3.Bureau Veritas
- 11.2.4.TUV NORD GROUP
- 11.2.5.Intertek Group plc
- 11.2.6.Carbon Trust
- 11.2.7.First Environment, Inc.
- 11.2.8.PwC
- 11.2.9.NSF International
- 11.2.10.UL LLC
- 11.2.11.COTECNA
- 11.2.12.SCS Global Services
- 11.2.13.KPMG International Cooperative
- 11.2.14.Deloitte Touche Tohmatsu Limited
- 11.2.15.Others
12.360 Degree Analyst View
13.Appendix
- 13.1.Research Methodology
- 13.2.References
- 13.3.Abbreviations
- 13.4.Disclaimer
- 13.5.Contact Us

