|
|
市場調査レポート
商品コード
1485829
2D材料市場:材料別、用途別、粒子サイズ別、国別、地域別 - 産業分析、市場規模、市場シェア、予測、2024-2032年2D Materials Market, By Materials, By Application, By Particle Size, By Country, and By Region - Industry Analysis, Market Size, Market Share & Forecast from 2024-2032 |
||||||
|
|||||||
カスタマイズ可能
|
|||||||

| 2D材料市場:材料別、用途別、粒子サイズ別、国別、地域別 - 産業分析、市場規模、市場シェア、予測、2024-2032年 |
|
出版日: 2024年05月17日
発行: AnalystView Market Insights
ページ情報: 英文 355 Pages
納期: 2~3営業日
|

全表示
- 概要
- 図表
- 目次
レポートハイライト
2D材料市場規模は2023年に24億6,754万米ドルとなり、2024年から2032年にかけてCAGR 3.8%で拡大
2D材料市場-市場力学
2D材料市場における研究開発活動の活発化
2D材料は、卓越した強度、柔軟性、導電性などの驚異的な特性を示すため、エレクトロニクスからエネルギー貯蔵まで、さまざまな用途で有望な候補となっています。学術機関、研究所、産業界のパートナー間の協力により、発見と開発のペースが加速し、2D材料研究の豊かなエコシステムが育まれています。2023年11月には、モナシュ大学工学部の新しい研究センターが、塗料、電池、コーティング、センサー、水処理など幅広い用途を持つグラフェンなどの二次元材料の研究と商業化を支援しました。
二次元材料市場-主な洞察
調査アナリストの分析によると、世界市場は予測期間(2024-2032年)に約3.8%のCAGRで年間成長すると推定されます。
材料セグメンテーションに基づくと、グラフェンが2023年に最大市場シェアを示すと予測されます。
用途別では、2023年にコンシューマーエレクトロニクスが主要用途に。
地域別では、北米が2023年の主要収益源です。
2D材料市場-セグメンテーション分析:
世界の2D材料市場は、材料、用途、粒子径、地域に基づいて区分されます。
市場は用途に基づいて8つのカテゴリーに分けられる:半導体、航空宇宙、家電、ヘルスケア、エネルギー。業界を支配しているのは家電分野です。この分野では、グラフェン、黒リン、遷移金属ジカルコゲナイド(TMD)などの材料が、その優れた光学的品質、高いキャリア移動度、卓越した電気伝導性から人気を集めています。トランジスタ、集積回路、センサー、光検出器、発光ダイオード(LED)、太陽電池などは、これらの材料を使用したデバイスのひとつです。
市場は材料によって6つのカテゴリーに分けられる:グラフェン、Mxene、TMDC、黒リン、窒化ホウ素は、2次元材料市場のセグメンテーションに含まれる材料のひとつです。グラフェンの市場シェアは最も高いです。機械的強度が高く、キャリアの移動度が高く、電気伝導性に優れています。グラフェンの用途には、複合材料、エネルギー貯蔵、エレクトロニクス、生物医学などがあります。
2D材料市場-地域別インサイト
2D材料市場で最も市場シェアが高いのは北米です。同国では著名な企業が多数進出しており、自動車製造台数も伸びていることから、自動車需要の増加が見込まれています。米国の2D材料市場は、政府の奨励政策や官民双方からの投資の増加によって、予測期間中にさらに支えられると予想されます。予測期間中の売上高と収益では、アジア太平洋地域が世界市場をリードすると予想されています。同産業は、中国、日本、インドなどの新興国による輸送、エネルギー貯蔵、複合材料、繊維、その他の産業への大規模投資によって牽引されています。この地域の半導体産業の発展と製造業の成長は、予測期間中に太平洋地域を押し上げると予想される2つの要因です。
2D材料市場-競合情勢:
市場参入企業は、製品ラインナップを拡充するために大規模な研究開発投資を行っており、2D材料市場のさらなる拡大に貢献しています。また、市場参入企業は、市場参入範囲の拡大を目指したさまざまな戦略的取り組みを行っています。この点で注目すべき出来事には、新製品の導入、契約上の合意、M&A、投資水準の向上、他の事業体との協力などがあります。例えば、2024年3月には、リンコピン大学の調査チームが、何百種類もの新しい二次元(2D)材料の合成を可能にする方法を開発しました。競争が激化し、新興国市場が発展する中で、二次元材料部門が成長し成功するためには、手頃な価格の製品を提供する必要があります。
目次
第1章 2D材料市場概要
- 調査範囲
- 市場推定年
第2章 エグゼクティブサマリー
- 市場内訳
- 競合考察
第3章 2D材料の主要市場動向
- 市場促進要因
- 市場抑制要因
- 市場の機会
- 市場の将来動向
第4章 2D材料産業研究
- PEST分析
- ポーターのファイブフォース分析
- 成長見通しマッピング
- 規制枠組み分析
第5章 2D材料市場:COVID-19の影響分析
- COVID-19以前の影響分析
- COVID-19後の影響分析
第6章 2D材料市場情勢
- Dマテリアル市場シェア分析、2023年
- 主要メーカー別内訳データ
- 既存企業の分析
- 新興企業の分析
第7章 2D材料市場:材料別
- 概要
- 材料別のセグメントシェア分析
- グラフェン
- 窒化ホウ素
- 黒リン
- TMDC
- Mxene
- その他
第8章 2D材料市場:用途別
- 概要
- 用途別のセグメントシェア分析
- 半導体
- コンシューマーエレクトロニクス
- ヘルスケア
- 航空宇宙
- エネルギー
- 医薬品
- 自動車
- その他
第9章 2D材料市場:粒子サイズ別
- 概要
- 粒子サイズ別のセグメントシェア分析
- 1~20ナノメーター
- 1~50ミクロン
第10章 2D材料市場:地域別
- イントロダクション
- 北米
- 概要
- 北米の主要メーカー
- 米国
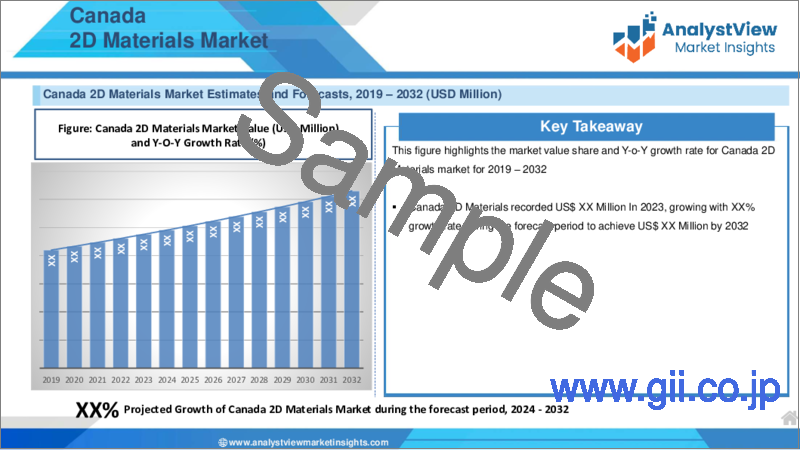
- カナダ
- 欧州
- 概要
- 欧州の主要メーカー
- ドイツ
- イタリア
- 英国
- フランス
- ロシア
- オランダ
- スウェーデン
- ポーランド
- その他
- アジア太平洋(APAC)
- 概要
- アジア太平洋の主要メーカー
- インド
- 中国
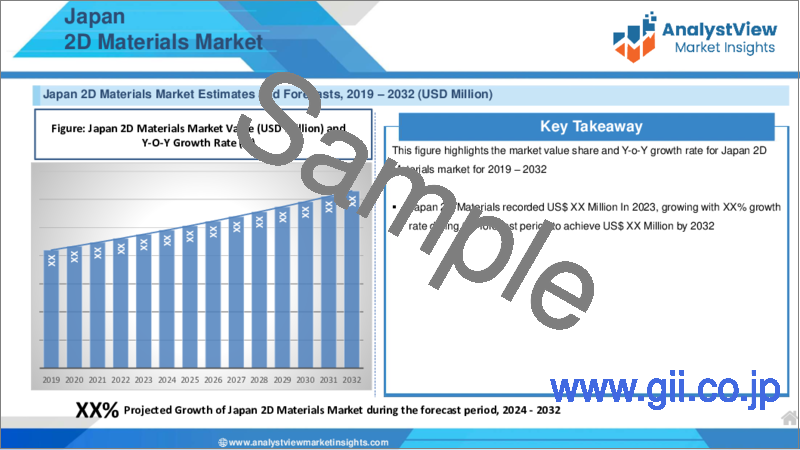
- 日本
- 韓国
- オーストラリア
- タイ
- インドネシア
- フィリピン
- その他
- ラテンアメリカ
- 概要
- ラテンアメリカの主要メーカー
- ブラジル
- メキシコ
- アルゼンチン
- コロンビア
- その他
- 中東・アフリカ
- 概要
- 中東・アフリカの主要メーカー
- サウジアラビア
- アラブ首長国連邦
- イスラエル
- トルコ
- アルジェリア
- エジプト
- その他
第11章 主要ベンダー分析:2D材料業界
- 競争ダッシュボード
- 企業プロファイル
- D Tech Graphene
- Abalonyx AS
- ACS Material,
- AVANZARE
- BASF SE
- XG Sciences
- Planar Tech,
- Garmor
- Nitronix
- Graphenea
- Versarien
- Dimpora
- Ossila Ltd
- Others
第12章 アナリストの全方位展望
List of Tables
- TABLE List of data sources
- TABLE Market drivers; Impact Analysis
- TABLE Market restraints; Impact Analysis
- TABLE 2D Materials Market: Materials Snapshot (2023)
- TABLE Segment Dashboard; Definition and Scope, by Materials
- TABLE Global 2D Materials Market, by Materials 2019-2032 (USD Million)
- TABLE 2D Materials Market: Application Snapshot (2023)
- TABLE Segment Dashboard; Definition and Scope, by Application
- TABLE Global 2D Materials Market, by Application 2019-2032 (USD Million)
- TABLE 2D Materials Market: Particle Size Snapshot (2023)
- TABLE Segment Dashboard; Definition and Scope, by Particle Size
- TABLE Global 2D Materials Market, by Particle Size 2019-2032 (USD Million)
- TABLE 2D Materials Market: Regional snapshot (2023)
- TABLE Segment Dashboard; Definition and Scope, by Region
- TABLE Global 2D Materials Market, by Region 2019-2032 (USD Million)
- TABLE North America 2D Materials Market, by Country, 2019-2032 (USD Million)
- TABLE North America 2D Materials Market, by Materials, 2019-2032 (USD Million)
- TABLE North America 2D Materials Market, by Application, 2019-2032 (USD Million)
- TABLE North America 2D Materials Market, by Particle Size, 2019-2032 (USD Million)
- TABLE Europe 2D Materials Market, by Country, 2019-2032 (USD Million)
- TABLE Europe 2D Materials Market, by Materials, 2019-2032 (USD Million)
- TABLE Europe 2D Materials Market, by Application, 2019-2032 (USD Million)
- TABLE Europe 2D Materials Market, by Particle Size, 2019-2032 (USD Million)
- TABLE Asia Pacific 2D Materials Market, by Country, 2019-2032 (USD Million)
- TABLE Asia Pacific 2D Materials Market, by Materials, 2019-2032 (USD Million)
- TABLE Asia Pacific 2D Materials Market, by Application, 2019-2032 (USD Million)
- TABLE Asia Pacific 2D Materials Market, by Particle Size, 2019-2032 (USD Million)
- TABLE Latin America 2D Materials Market, by Country, 2019-2032 (USD Million)
- TABLE Latin America 2D Materials Market, by Materials, 2019-2032 (USD Million)
- TABLE Latin America 2D Materials Market, by Application, 2019-2032 (USD Million)
- TABLE Latin America 2D Materials Market, by Particle Size, 2019-2032 (USD Million)
- TABLE Middle East and Africa 2D Materials Market, by Country, 2019-2032 (USD Million)
- TABLE Middle East and Africa 2D Materials Market, by Materials, 2019-2032 (USD Million)
- TABLE Middle East and Africa 2D Materials Market, by Application, 2019-2032 (USD Million)
- TABLE Middle East and Africa 2D Materials Market, by Particle Size, 2019-2032 (USD Million)
REPORT HIGHLIGHT
2D Materials Market size was valued at USD 2,467.54 Million in 2023, expanding at a CAGR of 3.8% from 2024 to 2032.
The market for 2D materials is driven by rising renewable energy use, rising use of 2D materials in hydrogen fuel cells in electric cars, cost-cutting measures, eco-friendly standards, and government pollution-free legislation. Research and development expenditures expand the market for 2D materials. Numerous significant market participants are funding R&D to create new technologies for 2D material products, which spurs expansion. Furthermore, the size of the manufacturing process is constrained, and the cost of making 2D materials is considerable. Furthermore, limitations and standardisation prevent the 2D Materials Market from growing. In this scenario, the 2D materials industry's unique materials encounter difficulties.
2D Materials Market- Market Dynamics
Growing Research and Development Activities in the 2D Materials Market
2D materials exhibit extraordinary properties such as exceptional strength, flexibility, and electrical conductivity, making them promising candidates for various applications ranging from electronics to energy storage. Collaboration between academic institutions, research laboratories, and industrial partners has accelerated the pace of discovery and development, fostering a rich ecosystem for 2D material research. In November 2023, A new research centre at the Faculty of Engineering at Monash University supported the study and commercialization of two-dimensional materials, such as graphene, which have a wide range of uses in paints, batteries, coatings, sensors, and water treatment, among other areas.
2D Materials Market- Key Insights
As per the analysis shared by our research analyst, the global market is estimated to grow annually at a CAGR of around 3.8% over the forecast period (2024-2032)
Based on materials segmentation, graphene was predicted to show maximum market share in the year 2023
Based on application segmentation, consumer electronics was the leading application in 2023
Based on region, North America was the leading revenue generator in 2023
2D Materials Market- Segmentation Analysis:
The Global 2D Materials Market is segmented based on Materials, Application, Particle Size, and Region.
The market is divided into eight categories based on application: Semiconductors, aerospace, consumer electronics, healthcare, and energy. The industry was dominated by the consumer electronics sector. This area has witnessed a rise in the popularity of materials like graphene, black phosphorus, and transition metal dichalcogenides (TMDs) because of their superior optical qualities, high carrier mobility, and outstanding electrical conductivity. Transistors, integrated circuits, sensors, photodetectors, light-emitting diodes (LEDs), and solar cells are among the devices that use these materials.
The market is divided into six categories based on materials: Graphene, Mxene, TMDCs, black phosphorus, and boron nitride are among the materials included in the 2-D Materials market segmentation. Graphene has the highest market share. It has great mechanical strength, great carrier mobility, and excellent electrical conductivity. Applications for graphene include composite materials, energy storage, electronics, and biomedicine.
2D Materials Market- Geographical Insights
The 2D Materials Market with the largest market share is in North America. The demand for autos is anticipated to rise due to factors like the number of prominent businesses operating in the nation and growing car manufacturing volumes. The US market for 2D materials is expected to be further supported over the forecast period by encouraging government policies and rising investments from both public and private entities. In terms of sales and revenue throughout the projected period, Asia Pacific is anticipated to lead the global market. The industry is being driven by major investments made in transportation, energy storage, composites, textiles, and other industries by emerging economies like China, Japan, and India. The region's developing semiconductor industry and growing manufacturing sectors are two factors that are anticipated to boost the Pacific during the forecast period.
2D Materials Market- Competitive Landscape:
Prominent industry participants are making significant R&D investments to broaden their product offerings, contributing to the further expansion of the 2-D Materials market. In addition, market participants are engaging in a range of strategic endeavours aimed at broadening their market reach. Notable events in this regard include the introduction of new products, contractual agreements, mergers and acquisitions, increased investment levels, and cooperation with other entities. For instance, in March 2024, Researchers at Linkoping University created a method enabling the synthesis of hundreds of new two-dimensional (2D) materials. To grow and thrive in an increasingly competitive and developing market environment, the 2-D Materials sector needs to provide affordable products.
Recent Developments:
In July 2023, GC entered into a collaborative partnership with Khalifa University of Science and Technology's Research & Innovation Center for Graphene and 2D Materials (RIC2D).
In September 2021, Colloids Limited, the UK's largest masterbatch manufacturer, launched a new facility for bespoke polymer composites using its innovative graphene masterbatch technology called Graphanced.
SCOPE OF THE REPORT
The scope of this report covers the market by its major segments, which include as follows:
GLOBAL 2D MATERIALS MARKET KEY PLAYERS- DETAILED COMPETITIVE INSIGHTS
2D Tech Graphene
Abalonyx AS
ACS Material,
AVANZARE
BASF SE
XG Sciences
Planar Tech,
Garmor
Nitronix
Graphenea
Versarien
Dimpora
Ossila Ltd
Others
GLOBAL 2D MATERIALS MARKET, BY MATERIALS - MARKET ANALYSIS, 2019 - 2032
- Graphene
- Boron Nitride
- Black Phosphorus
- TMDCs
- Mxene
- Others
GLOBAL 2D MATERIALS MARKET, BY APPLICATION- MARKET ANALYSIS, 2019 - 2032
- Semiconductor
- Consumer Electronics
- Healthcare
- Aerospace
- Energy
- Pharmaceuticals
- Automobiles
- Others
GLOBAL 2D MATERIALS MARKET, BY PARTICLE SIZE- MARKET ANALYSIS, 2019 - 2032
- 1 to 20 Nanometers
- 1 to 50 Microns
GLOBAL 2D MATERIALS MARKET, BY REGION- MARKET ANALYSIS, 2019 - 2032
- North America
- The U.S.
- Canada
- Europe
- Germany
- France
- Italy
- Spain
- United Kingdom
- Russia
- Netherlands
- Sweden
- Poland
- Rest of Europe
- Asia Pacific
- India
- China
- South Korea
- Japan
- Australia
- Thailand
- Indonesia
- Philippines
- Rest of APAC
- Latin America
- Brazil
- Mexico
- Argentina
- Colombia
- Rest of LATAM
- The Middle East and Africa
- Saudi Arabia
- United Arab Emirates
- Israel
- Turkey
- Algeria
- Egypt
- Rest of MEA
Table of Contents
1.2D Materials Market Overview
- 1.1.Study Scope
- 1.2.Market Estimation Years
2.Executive Summary
- 2.1.Market Snippet
- 2.1.1.2D Materials Market Snippet by Materials
- 2.1.2.2D Materials Market Snippet by Application
- 2.1.3.2D Materials Market Snippet by Particle Size
- 2.1.4.2D Materials Market Snippet by Country
- 2.1.5.2D Materials Market Snippet by Region
- 2.2.Competitive Insights
3.2D Materials Key Market Trends
- 3.1.2D Materials Market Drivers
- 3.1.1.Impact Analysis of Market Drivers
- 3.2.2D Materials Market Restraints
- 3.2.1.Impact Analysis of Market Restraints
- 3.3.2D Materials Market Opportunities
- 3.4.2D Materials Market Future Trends
4.2D Materials Industry Study
- 4.1.PEST Analysis
- 4.2.Porter's Five Forces Analysis
- 4.3.Growth Prospect Mapping
- 4.4.Regulatory Framework Analysis
5.2D Materials Market: COVID-19 Impact Analysis
- 5.1.Pre-COVID-19 Impact Analysis
- 5.2.Post-COVID-19 Impact Analysis
- 5.2.1.Top Performing Segments
- 5.2.2.Marginal Growth Segments
- 5.2.3.Top Looser Segments
- 5.2.4.Marginal Loss Segments
6.2D Materials Market Landscape
- 6.1.2D Materials Market Share Analysis, 2023
- 6.2.Breakdown Data, by Key Manufacturer
- 6.2.1.Established Players' Analysis
- 6.2.2.Emerging Players' Analysis
7.2D Materials Market - By Materials
- 7.1.Overview
- 7.1.1.Segment Share Analysis, By Materials, 2023 & 2032 (%)
- 7.1.2.Graphene
- 7.1.3.Boron Nitride
- 7.1.4.Black Phosphorus
- 7.1.5.TMDCs
- 7.1.6.Mxene
- 7.1.7.Others
8.2D Materials Market - By Application
- 8.1.Overview
- 8.1.1.Segment Share Analysis, By Application, 2023 & 2032 (%)
- 8.1.2.Semiconductor
- 8.1.3.Consumer Electronics
- 8.1.4.Healthcare
- 8.1.5.Aerospace
- 8.1.6.Energy
- 8.1.7.Pharmaceuticals
- 8.1.8.Automobiles
- 8.1.9.Others
9.2D Materials Market - By Particle Size
- 9.1.Overview
- 9.1.1.Segment Share Analysis, By Particle Size, 2023 & 2032 (%)
- 9.1.2.1 to 20 Nanometers
- 9.1.3.1 to 50 Microns
10.2D Materials Market- By Geography
- 10.1.Introduction
- 10.1.1.Segment Share Analysis, By Geography, 2023 & 2032 (%)
- 10.2.North America
- 10.2.1.Overview
- 10.2.2.2D Materials Key Manufacturers in North America
- 10.2.3.North America Market Size and Forecast, By Country, 2019 - 2032 (US$ Million)
- 10.2.4.North America Market Size and Forecast, By Materials, 2019 - 2032 (US$ Million)
- 10.2.5.North America Market Size and Forecast, By Application, 2019 - 2032 (US$ Million)
- 10.2.6.North America Market Size and Forecast, By Particle Size, 2019 - 2032 (US$ Million)
- 10.2.7.U.S.
- 10.2.7.1.Overview
- 10.2.7.2.Market Analysis, Forecast, and Y-O-Y Growth Rate, 2019 - 2032, (US$ Million)
- 10.2.7.3.U.S. Market Size and Forecast, By Materials, 2019 - 2032 (US$ Million)
- 10.2.7.4.U.S. Market Size and Forecast, By Application, 2019 - 2032 (US$ Million)
- 10.2.7.5.U.S. Market Size and Forecast, By Particle Size, 2019 - 2032 (US$ Million)
- 10.2.8.Canada
- 10.2.8.1.Overview
- 10.2.8.2.Market Analysis, Forecast, and Y-O-Y Growth Rate, 2019 - 2032, (US$ Million)
- 10.2.8.3.Canada Market Size and Forecast, By Materials, 2019 - 2032 (US$ Million)
- 10.2.8.4.Canada Market Size and Forecast, By Application, 2019 - 2032 (US$ Million)
- 10.2.8.5.Canada Market Size and Forecast, By Particle Size, 2019 - 2032 (US$ Million)
- 10.3.Europe
- 10.3.1.Overview
- 10.3.2.2D Materials Key Manufacturers in Europe
- 10.3.3.Europe Market Size and Forecast, By Country, 2019 - 2032 (US$ Million)
- 10.3.4.Europe Market Size and Forecast, By Materials, 2019 - 2032 (US$ Million)
- 10.3.5.Europe Market Size and Forecast, By Application, 2019 - 2032 (US$ Million)
- 10.3.6.Europe Market Size and Forecast, By Particle Size, 2019 - 2032 (US$ Million)
- 10.3.7.Germany
- 10.3.7.1.Overview
- 10.3.7.2.Market Analysis, Forecast, and Y-O-Y Growth Rate, 2019 - 2032, (US$ Million)
- 10.3.7.3.Germany Market Size and Forecast, By Materials, 2019 - 2032 (US$ Million)
- 10.3.7.4.Germany Market Size and Forecast, By Application, 2019 - 2032 (US$ Million)
- 10.3.7.5.Germany Market Size and Forecast, By Particle Size, 2019 - 2032 (US$ Million)
- 10.3.8.Italy
- 10.3.8.1.Overview
- 10.3.8.2.Market Analysis, Forecast, and Y-O-Y Growth Rate, 2019 - 2032, (US$ Million)
- 10.3.8.3.Italy Market Size and Forecast, By Materials, 2019 - 2032 (US$ Million)
- 10.3.8.4.Italy Market Size and Forecast, By Application, 2019 - 2032 (US$ Million)
- 10.3.8.5.Italy Market Size and Forecast, By Particle Size, 2019 - 2032 (US$ Million)
- 10.3.9.United Kingdom
- 10.3.9.1.Overview
- 10.3.9.2.Market Analysis, Forecast, and Y-O-Y Growth Rate, 2019 - 2032, (US$ Million)
- 10.3.9.3.United Kingdom Market Size and Forecast, By Materials, 2019 - 2032 (US$ Million)
- 10.3.9.4.United Kingdom Market Size and Forecast, By Application, 2019 - 2032 (US$ Million)
- 10.3.9.5.United Kingdom Market Size and Forecast, By Particle Size, 2019 - 2032 (US$ Million)
- 10.3.10.France
- 10.3.10.1.Overview
- 10.3.10.2.Market Analysis, Forecast, and Y-O-Y Growth Rate, 2019 - 2032, (US$ Million)
- 10.3.10.3.France Market Size and Forecast, By Materials, 2019 - 2032 (US$ Million)
- 10.3.10.4.France Market Size and Forecast, By Application, 2019 - 2032 (US$ Million)
- 10.3.10.5.France Market Size and Forecast, By Particle Size, 2019 - 2032 (US$ Million)
- 10.3.11.Russia
- 10.3.11.1.Market Analysis, Forecast, and Y-O-Y Growth Rate, 2019 - 2032, (US$ Million)
- 10.3.11.2.Russia Market Size and Forecast, By Materials, 2019 - 2032 (US$ Million)
- 10.3.11.3.Russia Market Size and Forecast, By Application, 2019 - 2032 (US$ Million)
- 10.3.11.4.Russia Market Size and Forecast, By Particle Size, 2019 - 2032 (US$ Million)
- 10.3.12.Netherlands
- 10.3.12.1.Market Analysis, Forecast, and Y-O-Y Growth Rate, 2019 - 2032, (US$ Million)
- 10.3.12.2.Netherlands Market Size and Forecast, By Materials, 2019 - 2032 (US$ Million)
- 10.3.12.3.Netherlands Market Size and Forecast, By Application, 2019 - 2032 (US$ Million)
- 10.3.12.4.Netherlands Market Size and Forecast, By Particle Size, 2019 - 2032 (US$ Million)
- 10.3.13.Sweden
- 10.3.13.1.Market Analysis, Forecast, and Y-O-Y Growth Rate, 2019 - 2032, (US$ Million)
- 10.3.13.2.Sweden Market Size and Forecast, By Materials, 2019 - 2032 (US$ Million)
- 10.3.13.3.Sweden Market Size and Forecast, By Application, 2019 - 2032 (US$ Million)
- 10.3.13.4.Sweden Market Size and Forecast, By Particle Size, 2019 - 2032 (US$ Million)
- 10.3.14.Poland
- 10.3.14.1.Market Analysis, Forecast, and Y-O-Y Growth Rate, 2019 - 2032, (US$ Million)
- 10.3.14.2.Poland Market Size and Forecast, By Materials, 2019 - 2032 (US$ Million)
- 10.3.14.3.Poland Market Size and Forecast, By Application, 2019 - 2032 (US$ Million)
- 10.3.14.4.Poland Market Size and Forecast, By Particle Size, 2019 - 2032 (US$ Million)
- 10.3.15.Rest of Europe
- 10.3.15.1.Overview
- 10.3.15.2.Market Analysis, Forecast, and Y-O-Y Growth Rate, 2019 - 2032, (US$ Million)
- 10.3.15.3.Rest of the Europe Market Size and Forecast, By Materials, 2019 - 2032 (US$ Million)
- 10.3.15.4.Rest of the Europe Market Size and Forecast, By Application, 2019 - 2032 (US$ Million)
- 10.3.15.5.Rest of the Europe Market Size and Forecast, By Particle Size, 2019 - 2032 (US$ Million)
- 10.4.Asia Pacific (APAC)
- 10.4.1.Overview
- 10.4.2.2D Materials Key Manufacturers in Asia Pacific
- 10.4.3.Asia Pacific Market Size and Forecast, By Country, 2019 - 2032 (US$ Million)
- 10.4.4.Asia Pacific Market Size and Forecast, By Materials, 2019 - 2032 (US$ Million)
- 10.4.5.Asia Pacific Market Size and Forecast, By Application, 2019 - 2032 (US$ Million)
- 10.4.6.Asia Pacific Market Size and Forecast, By Particle Size, 2019 - 2032 (US$ Million)
- 10.4.7.India
- 10.4.7.1.Overview
- 10.4.7.2.Market Analysis, Forecast, and Y-O-Y Growth Rate, 2019 - 2032, (US$ Million)
- 10.4.7.3.India Market Size and Forecast, By Materials, 2019 - 2032 (US$ Million)
- 10.4.7.4.India Market Size and Forecast, By Application, 2019 - 2032 (US$ Million)
- 10.4.7.5.India Market Size and Forecast, By Particle Size, 2019 - 2032 (US$ Million)
- 10.4.8.China
- 10.4.8.1.Overview
- 10.4.8.2.Market Analysis, Forecast, and Y-O-Y Growth Rate, 2019 - 2032, (US$ Million)
- 10.4.8.3.China Market Size and Forecast, By Materials, 2019 - 2032 (US$ Million)
- 10.4.8.4.China Market Size and Forecast, By Application, 2019 - 2032 (US$ Million)
- 10.4.8.5.China Market Size and Forecast, By Particle Size, 2019 - 2032 (US$ Million)
- 10.4.9.Japan
- 10.4.9.1.Overview
- 10.4.9.2.Market Analysis, Forecast, and Y-O-Y Growth Rate, 2019 - 2032, (US$ Million)
- 10.4.9.3.Japan Market Size and Forecast, By Materials, 2019 - 2032 (US$ Million)
- 10.4.9.4.Japan Market Size and Forecast, By Application, 2019 - 2032 (US$ Million)
- 10.4.9.5.Japan Market Size and Forecast, By Particle Size, 2019 - 2032 (US$ Million)
- 10.4.10.South Korea
- 10.4.10.1.Overview
- 10.4.10.2.Market Analysis, Forecast, and Y-O-Y Growth Rate, 2019 - 2032, (US$ Million)
- 10.4.10.3.South Korea Market Size and Forecast, By Materials, 2019 - 2032 (US$ Million)
- 10.4.10.4.South Korea Market Size and Forecast, By Application, 2019 - 2032 (US$ Million)
- 10.4.10.5.South Korea Market Size and Forecast, By Particle Size, 2019 - 2032 (US$ Million)
- 10.4.11.Australia
- 10.4.11.1.Overview
- 10.4.11.2.Market Analysis, Forecast, and Y-O-Y Growth Rate, 2019 - 2032, (US$ Million)
- 10.4.11.3.Australia Market Size and Forecast, By Materials, 2019 - 2032 (US$ Million)
- 10.4.11.4.Australia Market Size and Forecast, By Application, 2019 - 2032 (US$ Million)
- 10.4.11.5.Australia Market Size and Forecast, By Particle Size, 2019 - 2032 (US$ Million)
- 10.4.12.Thailand
- 10.4.12.1.Overview
- 10.4.12.2.Market Analysis, Forecast, and Y-O-Y Growth Rate, 2019 - 2032, (US$ Million)
- 10.4.12.3.Thailand Market Size and Forecast, By Materials, 2019 - 2032 (US$ Million)
- 10.4.12.4.Thailand Market Size and Forecast, By Application, 2019 - 2032 (US$ Million)
- 10.4.12.5.Thailand Market Size and Forecast, By Particle Size, 2019 - 2032 (US$ Million)
- 10.4.13.Indonesia
- 10.4.13.1.Overview
- 10.4.13.2.Market Analysis, Forecast, and Y-O-Y Growth Rate, 2019 - 2032, (US$ Million)
- 10.4.13.3.Indonesia Market Size and Forecast, By Materials, 2019 - 2032 (US$ Million)
- 10.4.13.4.Indonesia Market Size and Forecast, By Application, 2019 - 2032 (US$ Million)
- 10.4.13.5.Indonesia Market Size and Forecast, By Particle Size, 2019 - 2032 (US$ Million)
- 10.4.14.Philippines
- 10.4.14.1.Overview
- 10.4.14.2.Market Analysis, Forecast, and Y-O-Y Growth Rate, 2019 - 2032, (US$ Million)
- 10.4.14.3.Philippines Market Size and Forecast, By Materials, 2019 - 2032 (US$ Million)
- 10.4.14.4.Philippines Market Size and Forecast, By Application, 2019 - 2032 (US$ Million)
- 10.4.14.5.Philippines Market Size and Forecast, By Particle Size, 2019 - 2032 (US$ Million)
- 10.4.15.Rest of APAC
- 10.4.15.1.Overview
- 10.4.15.2.Market Analysis, Forecast, and Y-O-Y Growth Rate, 2019 - 2032, (US$ Million)
- 10.4.15.3.Rest of APAC Market Size and Forecast, By Materials, 2019 - 2032 (US$ Million)
- 10.4.15.4.Rest of APAC Market Size and Forecast, By Application, 2019 - 2032 (US$ Million)
- 10.4.15.5.Rest of APAC Market Size and Forecast, By Particle Size, 2019 - 2032 (US$ Million)
- 10.5.Latin America
- 10.5.1.Overview
- 10.5.2.2D Materials Key Manufacturers in Latin America
- 10.5.3.Latin America Market Size and Forecast, By Country, 2019 - 2032 (US$ Million)
- 10.5.4.Latin America Market Size and Forecast, By Materials, 2019 - 2032 (US$ Million)
- 10.5.5.Latin America Market Size and Forecast, By Application, 2019 - 2032 (US$ Million)
- 10.5.6.Latin America Market Size and Forecast, By Particle Size, 2019 - 2032 (US$ Million)
- 10.5.7.Brazil
- 10.5.7.1.Overview
- 10.5.7.2.Market Analysis, Forecast, and Y-O-Y Growth Rate, 2019 - 2032, (US$ Million)
- 10.5.7.3.Brazil Market Size and Forecast, By Materials, 2019 - 2032 (US$ Million)
- 10.5.7.4.Brazil Market Size and Forecast, By Application, 2019 - 2032 (US$ Million)
- 10.5.7.5.Brazil Market Size and Forecast, By Particle Size, 2019 - 2032 (US$ Million)
- 10.5.8.Mexico
- 10.5.8.1.Overview
- 10.5.8.2.Market Analysis, Forecast, and Y-O-Y Growth Rate, 2019 - 2032, (US$ Million)
- 10.5.8.3.Mexico Market Size and Forecast, By Materials, 2019 - 2032 (US$ Million)
- 10.5.8.4.Mexico Market Size and Forecast, By Application, 2019 - 2032 (US$ Million)
- 10.5.8.5.Mexico Market Size and Forecast, By Particle Size, 2019 - 2032 (US$ Million)
- 10.5.9.Argentina
- 10.5.9.1.Overview
- 10.5.9.2.Market Analysis, Forecast, and Y-O-Y Growth Rate, 2019 - 2032, (US$ Million)
- 10.5.9.3.Argentina Market Size and Forecast, By Materials, 2019 - 2032 (US$ Million)
- 10.5.9.4.Argentina Market Size and Forecast, By Application, 2019 - 2032 (US$ Million)
- 10.5.9.5.Argentina Market Size and Forecast, By Particle Size, 2019 - 2032 (US$ Million)
- 10.5.10.Colombia
- 10.5.10.1.Overview
- 10.5.10.2.Market Analysis, Forecast, and Y-O-Y Growth Rate, 2019 - 2032, (US$ Million)
- 10.5.10.3.Colombia Market Size and Forecast, By Materials, 2019 - 2032 (US$ Million)
- 10.5.10.4.Colombia Market Size and Forecast, By Application, 2019 - 2032 (US$ Million)
- 10.5.10.5.Colombia Market Size and Forecast, By Particle Size, 2019 - 2032 (US$ Million)
- 10.5.11.Rest of LATAM
- 10.5.11.1.Overview
- 10.5.11.2.Market Analysis, Forecast, and Y-O-Y Growth Rate, 2019 - 2032, (US$ Million)
- 10.5.11.3.Rest of LATAM Market Size and Forecast, By Materials, 2019 - 2032 (US$ Million)
- 10.5.11.4.Rest of LATAM Market Size and Forecast, By Application, 2019 - 2032 (US$ Million)
- 10.5.11.5.Rest of LATAM Market Size and Forecast, By Particle Size, 2019 - 2032 (US$ Million)
- 10.6.Middle East and Africa
- 10.6.1.Overview
- 10.6.2.2D Materials Key Manufacturers in Middle East and Africa
- 10.6.3.Middle East and Africa Market Size and Forecast, By Country, 2019 - 2032 (US$ Million)
- 10.6.4.Middle East and Africa Market Size and Forecast, By Materials, 2019 - 2032 (US$ Million)
- 10.6.5.Middle East and Africa Market Size and Forecast, By Application, 2019 - 2032 (US$ Million)
- 10.6.6.Middle East and Africa Market Size and Forecast, By Particle Size, 2019 - 2032 (US$ Million)
- 10.6.7.Saudi Arabia
- 10.6.7.1.Overview
- 10.6.7.2.Market Analysis, Forecast, and Y-O-Y Growth Rate, 2019 - 2032, (US$ Million)
- 10.6.7.3.Saudi Arabia Market Size and Forecast, By Materials, 2019 - 2032 (US$ Million)
- 10.6.7.4.Saudi Arabia Market Size and Forecast, By Application, 2019 - 2032 (US$ Million)
- 10.6.7.5.Saudi Arabia Market Size and Forecast, By Particle Size, 2019 - 2032 (US$ Million)
- 10.6.8.United Arab Emirates
- 10.6.8.1.Overview
- 10.6.8.2.Market Analysis, Forecast, and Y-O-Y Growth Rate, 2019 - 2032, (US$ Million)
- 10.6.8.3.United Arab Emirates Market Size and Forecast, By Materials, 2019 - 2032 (US$ Million)
- 10.6.8.4.United Arab Emirates Market Size and Forecast, By Application, 2019 - 2032 (US$ Million)
- 10.6.8.5.United Arab Emirates Market Size and Forecast, By Particle Size, 2019 - 2032 (US$ Million)
- 10.6.9.Israel
- 10.6.9.1.Overview
- 10.6.9.2.Market Analysis, Forecast, and Y-O-Y Growth Rate, 2019 - 2032, (US$ Million)
- 10.6.9.3.Israel Market Size and Forecast, By Materials, 2019 - 2032 (US$ Million)
- 10.6.9.4.Israel Market Size and Forecast, By Application, 2019 - 2032 (US$ Million)
- 10.6.9.5.Israel Market Size and Forecast, By Particle Size, 2019 - 2032 (US$ Million)
- 10.6.10.Turkey
- 10.6.10.1.Overview
- 10.6.10.2.Market Analysis, Forecast, and Y-O-Y Growth Rate, 2019 - 2032, (US$ Million)
- 10.6.10.3.Turkey Market Size and Forecast, By Materials, 2019 - 2032 (US$ Million)
- 10.6.10.4.Turkey Market Size and Forecast, By Application, 2019 - 2032 (US$ Million)
- 10.6.10.5.Turkey Market Size and Forecast, By Particle Size, 2019 - 2032 (US$ Million)
- 10.6.11.Algeria
- 10.6.11.1.Overview
- 10.6.11.2.Market Analysis, Forecast, and Y-O-Y Growth Rate, 2019 - 2032, (US$ Million)
- 10.6.11.3.Algeria Market Size and Forecast, By Materials, 2019 - 2032 (US$ Million)
- 10.6.11.4.Algeria Market Size and Forecast, By Application, 2019 - 2032 (US$ Million)
- 10.6.11.5.Algeria Market Size and Forecast, By Particle Size, 2019 - 2032 (US$ Million)
- 10.6.12.Egypt
- 10.6.12.1.Overview
- 10.6.12.2.Market Analysis, Forecast, and Y-O-Y Growth Rate, 2019 - 2032, (US$ Million)
- 10.6.12.3.Egypt Market Size and Forecast, By Materials, 2019 - 2032 (US$ Million)
- 10.6.12.4.Egypt Market Size and Forecast, By Application, 2019 - 2032 (US$ Million)
- 10.6.12.5.Egypt Market Size and Forecast, By Particle Size, 2019 - 2032 (US$ Million)
- 10.6.13.Rest of MEA
- 10.6.13.1.Overview
- 10.6.13.2.Market Analysis, Forecast, and Y-O-Y Growth Rate, 2019 - 2032, (US$ Million)
- 10.6.13.3.Rest of MEA Market Size and Forecast, By Materials, 2019 - 2032 (US$ Million)
- 10.6.13.4.Rest of MEA Market Size and Forecast, By Application, 2019 - 2032 (US$ Million)
- 10.6.13.5.Rest of MEA Market Size and Forecast, By Particle Size, 2019 - 2032 (US$ Million)
11.Key Vendor Analysis- 2D Materials Industry
- 11.1.Competitive Dashboard
- 11.2.Company Profiles
- 11.2.1.2D Tech Graphene
- 11.2.2. Abalonyx AS
- 11.2.3.ACS Material,
- 11.2.4.AVANZARE
- 11.2.5.BASF SE
- 11.2.6.XG Sciences
- 11.2.7.Planar Tech,
- 11.2.8.Garmor
- 11.2.9.Nitronix
- 11.2.10.Graphenea
- 11.2.11.Versarien
- 11.2.12.Dimpora
- 11.2.13.Ossila Ltd
- 11.2.14.Others
12.360 Degree Analyst View
13.Appendix
- 13.1.Research Methodology
- 13.2.References
- 13.3.Abbreviations
- 13.4.Disclaimer
- 13.5.Contact Us
