|
|
市場調査レポート
商品コード
1485819
自動車用ギガキャスティング市場:ロック力別、用途別、国別、地域別-2024年~2032年の産業分析、市場規模、市場シェア、予測Automotive Gigacasting Market, By Locking Force, By Application, By Country, and By Region - Industry Analysis, Market Size, Market Share & Forecast from 2024-2032 |
||||||
|
|||||||
カスタマイズ可能
|
|||||||


| 自動車用ギガキャスティング市場:ロック力別、用途別、国別、地域別-2024年~2032年の産業分析、市場規模、市場シェア、予測 |
|
出版日: 2024年05月04日
発行: AnalystView Market Insights
ページ情報: 英文 260 Pages
納期: 2~3営業日
|

全表示
- 概要
- 図表
- 目次
レポートのハイライト
車載用ギガキャスティング市場規模は2023年に7,293万米ドルとなり、2024年から2032年にかけて49.92%のCAGRで拡大
自動車用ギガキャスティング市場-市場力学
軽量車両への需要増加が市場成長の原動力となる見込み
ギガキャスティングは、精密鋳造技術を用いて大型で複雑な自動車部品を製造する製造プロセスです。この方法によって、メーカーは軽量でありながら耐久性のある部品を作ることができ、自動車の燃費向上、性能改善、低排出ガスにつながります。小型商用車(LCV)の世界販売台数は2021年に70%以上急増しました。この成長にもかかわらず、国際エネルギー機関(IEA)の報告によると、電動LCVの市場シェアは2%にとどまっており、乗用車に比べて大幅に低いです。材料科学の絶え間ない進歩は、ギガキャストコンポーネントの強度重量比、耐久性、総合的な特性を高める機会を提供します。しかし、ギガキャスティングに必要な初期投資の高さが、市場拡大の課題となる可能性があります。
自動車用ギガキャスティング市場-主要インサイト
当社のリサーチアナリストが共有した分析によると、世界市場は予測期間(2024-2032年)に約49.92%のCAGRで毎年成長すると推定されます。
ロッキングフォースセグメンテーションに基づくと、30,000kN~60,000kNが2023年に最大市場シェアを示すと予測されます。
用途別では、2023年にボディパーツが主要タイプでした。
地域別では、アジア太平洋地域が2023年の売上高でトップ
自動車用ギガキャスティング市場-セグメンテーション分析:
自動車用ギガキャスティングの世界市場は、ロッキングフォース、アプリケーション、地域に基づいてセグメント化されます。
市場はロッキングフォースによって3つのカテゴリーに分けられる:10,000kN~30,000kN、30,000kN~60,000kN、60,000kN以上。30,000 kN~60,000 kNのセグメントが市場を独占しています。ギガキャスティングは、30,000kN~60,000kNの型締力を持つ高圧ダイカストマシンを使用して、大型で複雑な部品を一体生産します。
市場は用途によって3つのカテゴリーに分けられる:ボディ部品、エンジン部品、トランスミッション部品、その他です。ボディ部品セグメントが市場を独占しています。自動車ボディ部品の生産にギガキャスティング技術を適用することで、性能、効率、安全性の面で大きなメリットが得られ、自動車産業全体での採用が促進されます。
自動車用ギガキャスティング市場-地理的洞察
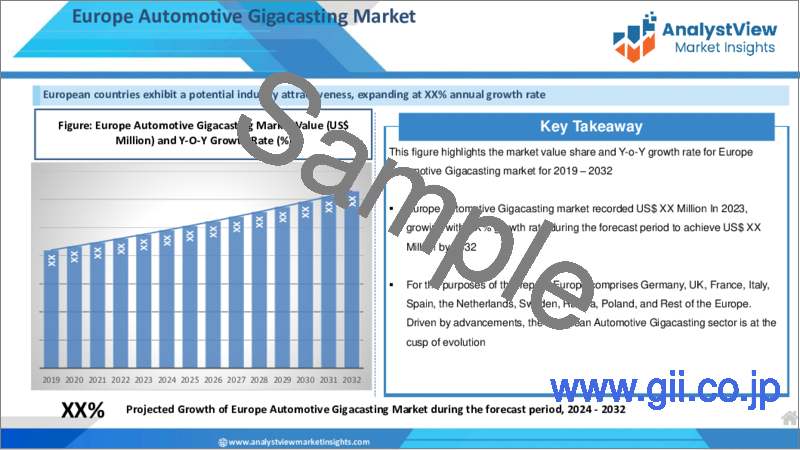
地理的には、この市場は北米、ラテンアメリカ、欧州、アジア太平洋、中東アフリカにまたがっています。これらの地域は、事業活動に貢献している国によってさらに区分されます。市場の成長を牽引しているのは、好調な自動車産業と技術進歩に支えられたアジア太平洋地域です。アジア太平洋諸国は、様々な分野、特に自動車製造における技術革新のパイオニアです。この地域における自動車需要の増加は、生産効率を高めるためのギガキャスティングのような高度な製造技術の採用を急増させました。中国汽車工業協会(CAAM)のデータによると、2023年、中国の自動車生産台数は3,016万台を超え、前年比11.6%増となり、自動車総販売台数は3,009万台を超え、前年比12%増となった。欧州は、軽量、構造効率、コスト効率、拡張性、柔軟性に優れた製造ソリューションの必要性により、市場成長率が2番目に高い地域となっています。
自動車用ギガキャスティング市場-競合情勢:
ギガキャスティングプロセスを強化するため、メーカーは研究開発に投資して材料特性を改善し、ギガキャスティング技術を使用して製造できる部品の範囲を拡大しています。先進的な金型設計、合金の進歩、プロセスの最適化技術を活用することで、企業は競争優位性を獲得できます。自動車メーカーは、ギガキャスティング技術サプライヤーを選択する際、品質と信頼性を優先します。正確な寸法精度と機械的特性を備えた欠陥のない部品を一貫して供給する企業は、競争力を確立することができます。さらに、ギガキャスティング技術プロバイダーの信頼性は、ISO規格などの品質認証によって強化されます。
目次
第1章 自動車用ギガキャスト市場概要
- 調査範囲
- 市場推定年
第2章 エグゼクティブサマリー
- 市場内訳
- 競合考察
第3章 自動車用ギガキャストの主要市場動向
- 市場促進要因
- 市場抑制要因
- 市場機会
- 市場の将来動向
第4章 自動車用ギガキャスト産業の調査
- PEST分析
- ポーターのファイブフォース分析
- 成長見通しマッピング
- 規制枠組み分析
第5章 自動車用ギガキャスティング市場: COVID-19の影響分析
- COVID-19以前の影響分析
- COVID-19後の影響分析
第6章 自動車用ギガキャスティング市場情勢
- 自動車用ギガキャスティング市場シェア分析、2022年
- 主要メーカー別内訳データ
- 既存企業の分析
- 新興企業の分析
第7章 自動車用ギガキャスティング市場-ロック力別
- 概要
- ロック力別セグメントシェア分析
- 10,000 kN ~ 30,000 kN
- 30,000 kN ~ 60,000 kN
- 60,000kN以上
第8章 自動車用ギガキャスティング市場- 用途別
- 概要
- 用途別セグメントシェア分析
- 体の部位
- エンジン部品
- トランスミッション部品
- その他
第9章 自動車用ギガキャスティング市場-地域別
- イントロダクション
- 北米
- 概要
- 北米の主要メーカー
- 米国
- カナダ
- 欧州
- 概要
- 欧州の主要メーカー
- ドイツ
- イタリア
- 英国
- フランス
- ロシア
- オランダ
- スウェーデン
- ポーランド
- その他
- アジア太平洋(APAC)
- 概要
- アジア太平洋の主要メーカー
- インド
- 中国
- 日本
- 韓国
- オーストラリア
- タイ
- インドネシア
- フィリピン
- その他
- ラテンアメリカ
- 概要
- ラテンアメリカの主要メーカー
- ブラジル
- メキシコ
- アルゼンチン
- コロンビア
- その他
- 中東・アフリカ
- 概要
- 中東・アフリカの主要メーカー
- サウジアラビア
- アラブ首長国連邦
- イスラエル
- トルコ
- アルジェリア
- エジプト
- その他
第10章 主要ベンダー分析- 自動車用ギガキャスト業界
- 競争ダッシュボード
- 企業プロファイル
- Idra Srl
- LK Technology Holdings
- Buhler Holding
- Birch Machinery
- Colosio
- Haitian Die Casting
- Handtmann Group
- Huachen Precision Manufacturing
- Norican Group
- Oskar Frech
- Shibaura Machine
- Suzhou Sanji Foundry Equipment
- UBE Machinery
- Yizumi Holdings
- T'Zitai Precision Machinery
- Others
第11章 アナリストの全方位展望
List of Tables
- TABLE List of data sources
- TABLE Market drivers; Impact Analysis
- TABLE Market restraints; Impact Analysis
- TABLE Automotive Gigacasting Market: Locking Force Snapshot (2022)
- TABLE Segment Dashboard; Definition and Scope, by Locking Force
- TABLE Global Automotive Gigacasting Market, by Locking Force 2018-2030 (USD Million)
- TABLE Automotive Gigacasting Market: Application Snapshot (2022)
- TABLE Segment Dashboard; Definition and Scope, by Application
- TABLE Global Automotive Gigacasting Market, by Application 2018-2030 (USD Million)
- TABLE Automotive Gigacasting Market: Regional snapshot (2022)
- TABLE Segment Dashboard; Definition and Scope, by Region
- TABLE Global Automotive Gigacasting Market, by Region 2018-2030 (USD Million)
- TABLE North America Automotive Gigacasting Market, by Country, 2018-2030 (USD Million)
- TABLE North America Automotive Gigacasting Market, by Locking Force, 2018-2030 (USD Million)
- TABLE North America Automotive Gigacasting Market, by Application, 2018-2030 (USD Million)
- TABLE Europe Automotive Gigacasting Market, by Country, 2018-2030 (USD Million)
- TABLE Europe Automotive Gigacasting Market, by Locking Force, 2018-2030 (USD Million)
- TABLE Europe Automotive Gigacasting Market, by Application, 2018-2030 (USD Million)
- TABLE Asia Pacific Automotive Gigacasting Market, by Country, 2018-2030 (USD Million)
- TABLE Asia Pacific Automotive Gigacasting Market, by Locking Force, 2018-2030 (USD Million)
- TABLE Asia Pacific Automotive Gigacasting Market, by Application, 2018-2030 (USD Million)
- TABLE Latin America Automotive Gigacasting Market, by Country, 2018-2030 (USD Million)
- TABLE Latin America Automotive Gigacasting Market, by Locking Force, 2018-2030 (USD Million)
- TABLE Latin America Automotive Gigacasting Market, by Application, 2018-2030 (USD Million)
- TABLE Middle East and Africa Automotive Gigacasting Market, by Country, 2018-2030 (USD Million)
- TABLE Middle East and Africa Automotive Gigacasting Market, by Locking Force, 2018-2030 (USD Million)
- TABLE Middle East and Africa Automotive Gigacasting Market, by Application, 2018-2030 (USD Million)
REPORT HIGHLIGHT
Automotive Gigacasting Market size was valued at USD 72.93 Million in 2023, expanding at a CAGR of 49.92% from 2024 to 2032.
Automotive gigacasting represents an innovative manufacturing method that is transforming the production of large, intricate automotive parts. This cutting-edge technology involves the use of special aluminum alloys to create sizeable castings with complex shapes and dimensions exceeding 2.5 m x 2 m. The resulting lightweight yet durable components, such as vehicle frames, engine blocks, transmission cases, and suspension parts, offer improved performance and fuel efficiency. By adopting gigacasting, car manufacturers can simplify assembly procedures, reduce the number of parts, and enhance safety standards. As the automotive industry continues to emphasize lightweight design, efficiency, and eco-friendliness, gigacasting technology is set to play a crucial role in shaping the future of vehicle production.
Automotive Gigacasting Market- Market Dynamics
Increasing Demand for Lightweight Vehicles is expected to drive the growth of the market
Gigacasting is a manufacturing process that involves producing large, intricate automotive parts using precision casting techniques. This method allows manufacturers to create lightweight yet durable components, leading to enhanced fuel efficiency, improved performance, and lower emissions in vehicles. The global sales of electric light commercial vehicles (LCVs) surged by more than 70% in 2021. Despite this growth, the electric LCV market share remains at 2%, which is significantly lower compared to passenger cars, as reported by the International Energy Agency. The continuous progress in materials science presents opportunities to enhance the strength-to-weight ratio, durability, and overall characteristics of gigacast components. However, the high initial investment required for gigacasting may pose a challenge to market expansion.
Automotive Gigacasting Market- Key Insights
As per the analysis shared by our research analyst, the global market is estimated to grow annually at a CAGR of around 49.92% over the forecast period (2024-2032)
Based on Locking Force segmentation, 30,000 kN to 60,000 kN was predicted to show maximum market share in the year 2023
Based on application segmentation, Body Part was the leading type in 2023
Based on region, Asia Pacific was the leading revenue generator in 2023
Automotive Gigacasting Market- Segmentation Analysis:
The Global Automotive Gigacasting Market is segmented on the basis of Locking Force, Application, and Region.
The market is divided into three categories based on Locking Force: 10,000 kN to 30,000 kN, 30,000 kN to 60,000 kN, and Above 60,000 kN. 30,000 kN to 60,000 kN segment dominates the market. Gigacasting involves the use of high-pressure die-casting machines with a clamping force ranging from 30,000 kN to 60,000 kN to produce large and intricate parts in a single piece.
The market is divided into three categories based on application: Body Part, Engine Part, Transmission Part, and Others. The body Part segment dominates the market. The application of gigacasting technology in producing automotive body parts offers significant benefits in terms of performance, efficiency, and safety, driving its adoption across the automotive industry.
Automotive Gigacasting Market- Geographical Insights
Geographically, this market spans across North America, Latin America, Europe, Asia Pacific, and the Middle East and Africa. These regions are further segmented by countries contributing to business activities. The market growth is predominantly driven by Asia Pacific, owing to its strong automotive industry and technological advancements. Countries in Asia-Pacific have been pioneers in technological innovation across various sectors, particularly in automotive manufacturing. The increasing demand for vehicles in this region has led to a surge in the adoption of advanced manufacturing technologies such as gigacasting to enhance production efficiency. In 2023, China's car production exceeded 30.16 million units, marking an 11.6 percent year-on-year increase, while total car sales surpassed 30.09 million units, reflecting a 12 percent year-on-year growth, as per data from the China Association of Automobile Manufacturers (CAAM). Europe stands as the second largest region for market growth, driven by the necessity for lightweight, structurally efficient, cost-effective, scalable, and flexible manufacturing solutions.
Automotive Gigacasting Market- Competitive Landscape:
To enhance gigacasting processes, manufacturers are investing in research and development to improve material properties and expand the range of components that can be produced using gigacasting technology. By utilizing advanced mold designs, alloy advancements, and process optimization techniques, companies can achieve a competitive advantage. Automotive manufacturers prioritize quality and reliability when selecting gigacasting technology suppliers. Companies that consistently deliver defect-free components with precise dimensional accuracy and mechanical properties can establish a competitive edge. Additionally, the credibility of gigacasting technology providers is bolstered by quality certifications such as ISO standards.
Recent Developments:
L.K. Technology Holdings Limited has recently declared that it successfully organized a Signing Ceremony for Strategic Cooperation in Giga Press and Technology in partnership with Nezha Motors. During this event, both entities established a profound strategic collaboration to jointly develop 20000 tonnes of Giga Press and explore various business opportunities. The forthcoming die-casting unit, resulting from this collaboration, is anticipated to possess the highest clamping force globally.
UBE Machinery Corporation, Ltd., the primary entity of the UBE Group's machinery division, has been awarded a contract to supply an exceptionally large die-casting machine for giga casting. Giga casting entails the utilization of aluminum alloy to seamlessly mold substantial automotive body components. This order has been placed by Ryobi Limited.
SCOPE OF THE REPORT
The scope of this report covers the market by its major segments, which include as follows:
GLOBAL AUTOMOTIVE GIGACASTING MARKET KEY PLAYERS- DETAILED COMPETITIVE INSIGHTS
Idra S.r.l.
L.K. Technology Holdings
Buhler Holding
Birch Machinery
Colosio
Haitian Die Casting
Handtmann Group
Huachen Precision Manufacturing
Norican Group
Oskar Frech
Shibaura Machine
Suzhou Sanji Foundry Equipment
UBE Machinery
Yizumi Holdings
T'Zitai Precision Machinery
Others
GLOBAL AUTOMOTIVE GIGACASTING MARKET, BY LOCKING FORCE- MARKET ANALYSIS, 2019 - 2032
- 10,000 kN to 30,000 kN
- 30,000 kN to 60,000 kN
- Above 60,000 kN
GLOBAL AUTOMOTIVE GIGACASTING MARKET, BY APPLICATION- MARKET ANALYSIS, 2019 - 2032
- Body Part
- Engine Part
- Transmission Part
- Others
GLOBAL AUTOMOTIVE GIGACASTING MARKET, BY REGION- MARKET ANALYSIS, 2019 - 2032
- North America
- The U.S.
- Canada
- Europe
- Germany
- France
- Italy
- Spain
- United Kingdom
- Russia
- Netherlands
- Sweden
- Poland
- Rest of Europe
- Asia Pacific
- India
- China
- South Korea
- Japan
- Australia
- Thailand
- Indonesia
- Philippines
- Rest of APAC
- Latin America
- Brazil
- Mexico
- Argentina
- Colombia
- Rest of LATAM
- The Middle East and Africa
- Saudi Arabia
- United Arab Emirates
- Israel
- Turkey
- Algeria
- Egypt
- Rest of MEA
Table of Contents
1.Automotive Gigacasting Market Overview
- 1.1.Study Scope
- 1.2.Market Estimation Years
2.Executive Summary
- 2.1.Market Snippet
- 2.1.1.Automotive Gigacasting Market Snippet by Locking Force
- 2.1.2.Automotive Gigacasting Market Snippet by Application
- 2.1.3.Automotive Gigacasting Market Snippet by Country
- 2.1.4.Automotive Gigacasting Market Snippet by Region
- 2.2.Competitive Insights
3.Automotive Gigacasting Key Market Trends
- 3.1.Automotive Gigacasting Market Drivers
- 3.1.1.Impact Analysis of Market Drivers
- 3.2.Automotive Gigacasting Market Restraints
- 3.2.1.Impact Analysis of Market Restraints
- 3.3.Automotive Gigacasting Market Opportunities
- 3.4.Automotive Gigacasting Market Future Trends
4.Automotive Gigacasting Industry Study
- 4.1.PEST Analysis
- 4.2.Porter's Five Forces Analysis
- 4.3.Growth Prospect Mapping
- 4.4.Regulatory Framework Analysis
5.Automotive Gigacasting Market: COVID-19 Impact Analysis
- 5.1.Pre-COVID-19 Impact Analysis
- 5.2.Post-COVID-19 Impact Analysis
- 5.2.1.Top Performing Segments
- 5.2.2.Marginal Growth Segments
- 5.2.3.Top Looser Segments
- 5.2.4.Marginal Loss Segments
6.Automotive Gigacasting Market Landscape
- 6.1.Automotive Gigacasting Market Share Analysis, 2022
- 6.2.Breakdown Data, by Key Manufacturer
- 6.2.1.Established Players' Analysis
- 6.2.2.Emerging Players' Analysis
7.Automotive Gigacasting Market - By Locking Force
- 7.1.Overview
- 7.1.1.Segment Share Analysis, By Locking Force, 2022 & 2030 (%)
- 7.1.2.10,000 kN to 30,000 kN
- 7.1.3.30,000 kN to 60,000 kN
- 7.1.4.Above 60,000 kN
8.Automotive Gigacasting Market - By Application
- 8.1.Overview
- 8.1.1.Segment Share Analysis, By Application, 2022 & 2030 (%)
- 8.1.2.Body Part
- 8.1.3.Engine Part
- 8.1.4.Transmission Part
- 8.1.5.Others
9.Automotive Gigacasting Market- By Geography
- 9.1.Introduction
- 9.1.1.Segment Share Analysis, By Geography, 2022 & 2030 (%)
- 9.2.North America
- 9.2.1.Overview
- 9.2.2.Automotive Gigacasting Key Manufacturers in North America
- 9.2.3.North America Market Size and Forecast, By Country, 2018 - 2030 (US$ Million)
- 9.2.4.North America Market Size and Forecast, By Locking Force, 2018 - 2030 (US$ Million)
- 9.2.5.North America Market Size and Forecast, By Application, 2018 - 2030 (US$ Million)
- 9.2.6.U.S.
- 9.2.6.1.Overview
- 9.2.6.2.Market Analysis, Forecast, and Y-O-Y Growth Rate, 2018 - 2030, (US$ Million)
- 9.2.6.3.U.S. Market Size and Forecast, By Locking Force, 2018 - 2030 (US$ Million)
- 9.2.6.4.U.S. Market Size and Forecast, By Application, 2018 - 2030 (US$ Million)
- 9.2.7.Canada
- 9.2.7.1.Overview
- 9.2.7.2.Market Analysis, Forecast, and Y-O-Y Growth Rate, 2018 - 2030, (US$ Million)
- 9.2.7.3.Canada Market Size and Forecast, By Locking Force, 2018 - 2030 (US$ Million)
- 9.2.7.4.Canada Market Size and Forecast, By Application, 2018 - 2030 (US$ Million)
- 9.3.Europe
- 9.3.1.Overview
- 9.3.2.Automotive Gigacasting Key Manufacturers in Europe
- 9.3.3.Europe Market Size and Forecast, By Country, 2018 - 2030 (US$ Million)
- 9.3.4.Europe Market Size and Forecast, By Locking Force, 2018 - 2030 (US$ Million)
- 9.3.5.Europe Market Size and Forecast, By Application, 2018 - 2030 (US$ Million)
- 9.3.6.Germany
- 9.3.6.1.Overview
- 9.3.6.2.Market Analysis, Forecast, and Y-O-Y Growth Rate, 2018 - 2030, (US$ Million)
- 9.3.6.3.Germany Market Size and Forecast, By Locking Force, 2018 - 2030 (US$ Million)
- 9.3.6.4.Germany Market Size and Forecast, By Application, 2018 - 2030 (US$ Million)
- 9.3.7.Italy
- 9.3.7.1.Overview
- 9.3.7.2.Market Analysis, Forecast, and Y-O-Y Growth Rate, 2018 - 2030, (US$ Million)
- 9.3.7.3.Italy Market Size and Forecast, By Locking Force, 2018 - 2030 (US$ Million)
- 9.3.7.4.Italy Market Size and Forecast, By Application, 2018 - 2030 (US$ Million)
- 9.3.8.United Kingdom
- 9.3.8.1.Overview
- 9.3.8.2.Market Analysis, Forecast, and Y-O-Y Growth Rate, 2018 - 2030, (US$ Million)
- 9.3.8.3.United Kingdom Market Size and Forecast, By Locking Force, 2018 - 2030 (US$ Million)
- 9.3.8.4.United Kingdom Market Size and Forecast, By Application, 2018 - 2030 (US$ Million)
- 9.3.9.France
- 9.3.9.1.Overview
- 9.3.9.2.Market Analysis, Forecast, and Y-O-Y Growth Rate, 2018 - 2030, (US$ Million)
- 9.3.9.3.France Market Size and Forecast, By Locking Force, 2018 - 2030 (US$ Million)
- 9.3.9.4.France Market Size and Forecast, By Application, 2018 - 2030 (US$ Million)
- 9.3.10.Russia
- 9.3.10.1.Market Analysis, Forecast, and Y-O-Y Growth Rate, 2018 - 2030, (US$ Million)
- 9.3.10.2.Russia Market Size and Forecast, By Locking Force, 2018 - 2030 (US$ Million)
- 9.3.10.3.Russia Market Size and Forecast, By Application, 2018 - 2030 (US$ Million)
- 9.3.11.Netherlands
- 9.3.11.1.Market Analysis, Forecast, and Y-O-Y Growth Rate, 2018 - 2030, (US$ Million)
- 9.3.11.2.Netherlands Market Size and Forecast, By Locking Force, 2018 - 2030 (US$ Million)
- 9.3.11.3.Netherlands Market Size and Forecast, By Application, 2018 - 2030 (US$ Million)
- 9.3.12.Sweden
- 9.3.12.1.Market Analysis, Forecast, and Y-O-Y Growth Rate, 2018 - 2030, (US$ Million)
- 9.3.12.2.Sweden Market Size and Forecast, By Locking Force, 2018 - 2030 (US$ Million)
- 9.3.12.3.Sweden Market Size and Forecast, By Application, 2018 - 2030 (US$ Million)
- 9.3.13.Poland
- 9.3.13.1.Market Analysis, Forecast, and Y-O-Y Growth Rate, 2018 - 2030, (US$ Million)
- 9.3.13.2.Poland Market Size and Forecast, By Locking Force, 2018 - 2030 (US$ Million)
- 9.3.13.3.Poland Market Size and Forecast, By Application, 2018 - 2030 (US$ Million)
- 9.3.14.Rest of Europe
- 9.3.14.1.Overview
- 9.3.14.2.Market Analysis, Forecast, and Y-O-Y Growth Rate, 2018 - 2030, (US$ Million)
- 9.3.14.3.Rest of the Europe Market Size and Forecast, By Locking Force, 2018 - 2030 (US$ Million)
- 9.3.14.4.Rest of the Europe Market Size and Forecast, By Application, 2018 - 2030 (US$ Million)
- 9.4.Asia Pacific (APAC)
- 9.4.1.Overview
- 9.4.2.Automotive Gigacasting Key Manufacturers in Asia Pacific
- 9.4.3.Asia Pacific Market Size and Forecast, By Country, 2018 - 2030 (US$ Million)
- 9.4.4.Asia Pacific Market Size and Forecast, By Locking Force, 2018 - 2030 (US$ Million)
- 9.4.5.Asia Pacific Market Size and Forecast, By Application, 2018 - 2030 (US$ Million)
- 9.4.6.India
- 9.4.6.1.Overview
- 9.4.6.2.Market Analysis, Forecast, and Y-O-Y Growth Rate, 2018 - 2030, (US$ Million)
- 9.4.6.3.India Market Size and Forecast, By Locking Force, 2018 - 2030 (US$ Million)
- 9.4.6.4.India Market Size and Forecast, By Application, 2018 - 2030 (US$ Million)
- 9.4.7.China
- 9.4.7.1.Overview
- 9.4.7.2.Market Analysis, Forecast, and Y-O-Y Growth Rate, 2018 - 2030, (US$ Million)
- 9.4.7.3.China Market Size and Forecast, By Locking Force, 2018 - 2030 (US$ Million)
- 9.4.7.4.China Market Size and Forecast, By Application, 2018 - 2030 (US$ Million)
- 9.4.8.Japan
- 9.4.8.1.Overview
- 9.4.8.2.Market Analysis, Forecast, and Y-O-Y Growth Rate, 2018 - 2030, (US$ Million)
- 9.4.8.3.Japan Market Size and Forecast, By Locking Force, 2018 - 2030 (US$ Million)
- 9.4.8.4.Japan Market Size and Forecast, By Application, 2018 - 2030 (US$ Million)
- 9.4.9.South Korea
- 9.4.9.1.Overview
- 9.4.9.2.Market Analysis, Forecast, and Y-O-Y Growth Rate, 2018 - 2030, (US$ Million)
- 9.4.9.3.South Korea Market Size and Forecast, By Locking Force, 2018 - 2030 (US$ Million)
- 9.4.9.4.South Korea Market Size and Forecast, By Application, 2018 - 2030 (US$ Million)
- 9.4.10.Australia
- 9.4.10.1.Overview
- 9.4.10.2.Market Analysis, Forecast, and Y-O-Y Growth Rate, 2018 - 2030, (US$ Million)
- 9.4.10.3.Australia Market Size and Forecast, By Locking Force, 2018 - 2030 (US$ Million)
- 9.4.10.4.Australia Market Size and Forecast, By Application, 2018 - 2030 (US$ Million)
- 9.4.11.Thailand
- 9.4.11.1.Overview
- 9.4.11.2.Market Analysis, Forecast, and Y-O-Y Growth Rate, 2018 - 2030, (US$ Million)
- 9.4.11.3.Thailand Market Size and Forecast, By Locking Force, 2018 - 2030 (US$ Million)
- 9.4.11.4.Thailand Market Size and Forecast, By Application, 2018 - 2030 (US$ Million)
- 9.4.12.Indonesia
- 9.4.12.1.Overview
- 9.4.12.2.Market Analysis, Forecast, and Y-O-Y Growth Rate, 2018 - 2030, (US$ Million)
- 9.4.12.3.Indonesia Market Size and Forecast, By Locking Force, 2018 - 2030 (US$ Million)
- 9.4.12.4.Indonesia Market Size and Forecast, By Application, 2018 - 2030 (US$ Million)
- 9.4.13.Philippines
- 9.4.13.1.Overview
- 9.4.13.2.Market Analysis, Forecast, and Y-O-Y Growth Rate, 2018 - 2030, (US$ Million)
- 9.4.13.3.Philippines Market Size and Forecast, By Locking Force, 2018 - 2030 (US$ Million)
- 9.4.13.4.Philippines Market Size and Forecast, By Application, 2018 - 2030 (US$ Million)
- 9.4.14.Rest of APAC
- 9.4.14.1.Overview
- 9.4.14.2.Market Analysis, Forecast, and Y-O-Y Growth Rate, 2018 - 2030, (US$ Million)
- 9.4.14.3.Rest of APAC Market Size and Forecast, By Locking Force, 2018 - 2030 (US$ Million)
- 9.4.14.4.Rest of APAC Market Size and Forecast, By Application, 2018 - 2030 (US$ Million)
- 9.5.Latin America
- 9.5.1.Overview
- 9.5.2.Automotive Gigacasting Key Manufacturers in Latin America
- 9.5.3.Latin America Market Size and Forecast, By Country, 2018 - 2030 (US$ Million)
- 9.5.4.Latin America Market Size and Forecast, By Locking Force, 2018 - 2030 (US$ Million)
- 9.5.5.Latin America Market Size and Forecast, By Application, 2018 - 2030 (US$ Million)
- 9.5.6.Brazil
- 9.5.6.1.Overview
- 9.5.6.2.Market Analysis, Forecast, and Y-O-Y Growth Rate, 2018 - 2030, (US$ Million)
- 9.5.6.3.Brazil Market Size and Forecast, By Locking Force, 2018 - 2030 (US$ Million)
- 9.5.6.4.Brazil Market Size and Forecast, By Application, 2018 - 2030 (US$ Million)
- 9.5.7.Mexico
- 9.5.7.1.Overview
- 9.5.7.2.Market Analysis, Forecast, and Y-O-Y Growth Rate, 2018 - 2030, (US$ Million)
- 9.5.7.3.Mexico Market Size and Forecast, By Locking Force, 2018 - 2030 (US$ Million)
- 9.5.7.4.Mexico Market Size and Forecast, By Application, 2018 - 2030 (US$ Million)
- 9.5.8.Argentina
- 9.5.8.1.Overview
- 9.5.8.2.Market Analysis, Forecast, and Y-O-Y Growth Rate, 2018 - 2030, (US$ Million)
- 9.5.8.3.Argentina Market Size and Forecast, By Locking Force, 2018 - 2030 (US$ Million)
- 9.5.8.4.Argentina Market Size and Forecast, By Application, 2018 - 2030 (US$ Million)
- 9.5.9.Colombia
- 9.5.9.1.Overview
- 9.5.9.2.Market Analysis, Forecast, and Y-O-Y Growth Rate, 2018 - 2030, (US$ Million)
- 9.5.9.3.Colombia Market Size and Forecast, By Locking Force, 2018 - 2030 (US$ Million)
- 9.5.9.4.Colombia Market Size and Forecast, By Application, 2018 - 2030 (US$ Million)
- 9.5.10.Rest of LATAM
- 9.5.10.1.Overview
- 9.5.10.2.Market Analysis, Forecast, and Y-O-Y Growth Rate, 2018 - 2030, (US$ Million)
- 9.5.10.3.Rest of LATAM Market Size and Forecast, By Locking Force, 2018 - 2030 (US$ Million)
- 9.5.10.4.Rest of LATAM Market Size and Forecast, By Application, 2018 - 2030 (US$ Million)
- 9.6.Middle East and Africa
- 9.6.1.Overview
- 9.6.2.Automotive Gigacasting Key Manufacturers in Middle East and Africa
- 9.6.3.Middle East and Africa Market Size and Forecast, By Country, 2018 - 2030 (US$ Million)
- 9.6.4.Middle East and Africa Market Size and Forecast, By Locking Force, 2018 - 2030 (US$ Million)
- 9.6.5.Middle East and Africa Market Size and Forecast, By Application, 2018 - 2030 (US$ Million)
- 9.6.6.Saudi Arabia
- 9.6.6.1.Overview
- 9.6.6.2.Market Analysis, Forecast, and Y-O-Y Growth Rate, 2018 - 2030, (US$ Million)
- 9.6.6.3.Saudi Arabia Market Size and Forecast, By Locking Force, 2018 - 2030 (US$ Million)
- 9.6.6.4.Saudi Arabia Market Size and Forecast, By Application, 2018 - 2030 (US$ Million)
- 9.6.7.United Arab Emirates
- 9.6.7.1.Overview
- 9.6.7.2.Market Analysis, Forecast, and Y-O-Y Growth Rate, 2018 - 2030, (US$ Million)
- 9.6.7.3.United Arab Emirates Market Size and Forecast, By Locking Force, 2018 - 2030 (US$ Million)
- 9.6.7.4.United Arab Emirates Market Size and Forecast, By Application, 2018 - 2030 (US$ Million)
- 9.6.8.Israel
- 9.6.8.1.Overview
- 9.6.8.2.Market Analysis, Forecast, and Y-O-Y Growth Rate, 2018 - 2030, (US$ Million)
- 9.6.8.3.Israel Market Size and Forecast, By Locking Force, 2018 - 2030 (US$ Million)
- 9.6.8.4.Israel Market Size and Forecast, By Application, 2018 - 2030 (US$ Million)
- 9.6.9.Turkey
- 9.6.9.1.Overview
- 9.6.9.2.Market Analysis, Forecast, and Y-O-Y Growth Rate, 2018 - 2030, (US$ Million)
- 9.6.9.3.Turkey Market Size and Forecast, By Locking Force, 2018 - 2030 (US$ Million)
- 9.6.9.4.Turkey Market Size and Forecast, By Application, 2018 - 2030 (US$ Million)
- 9.6.10.Algeria
- 9.6.10.1.Overview
- 9.6.10.2.Market Analysis, Forecast, and Y-O-Y Growth Rate, 2018 - 2030, (US$ Million)
- 9.6.10.3.Algeria Market Size and Forecast, By Locking Force, 2018 - 2030 (US$ Million)
- 9.6.10.4.Algeria Market Size and Forecast, By Application, 2018 - 2030 (US$ Million)
- 9.6.11.Egypt
- 9.6.11.1.Overview
- 9.6.11.2.Market Analysis, Forecast, and Y-O-Y Growth Rate, 2018 - 2030, (US$ Million)
- 9.6.11.3.Egypt Market Size and Forecast, By Locking Force, 2018 - 2030 (US$ Million)
- 9.6.11.4.Egypt Market Size and Forecast, By Application, 2018 - 2030 (US$ Million)
- 9.6.12.Rest of MEA
- 9.6.12.1.Overview
- 9.6.12.2.Market Analysis, Forecast, and Y-O-Y Growth Rate, 2018 - 2030, (US$ Million)
- 9.6.12.3.Rest of MEA Market Size and Forecast, By Locking Force, 2018 - 2030 (US$ Million)
- 9.6.12.4.Rest of MEA Market Size and Forecast, By Application, 2018 - 2030 (US$ Million)
10.Key Vendor Analysis- Automotive Gigacasting Industry
- 10.1.Competitive Dashboard
- 10.2.Company Profiles
- 10.2.1.Idra S.r.l.
- 10.2.2.L.K. Technology Holdings
- 10.2.3.Buhler Holding
- 10.2.4.Birch Machinery
- 10.2.5.Colosio
- 10.2.6.Haitian Die Casting
- 10.2.7.Handtmann Group
- 10.2.8.Huachen Precision Manufacturing
- 10.2.9.Norican Group
- 10.2.10.Oskar Frech
- 10.2.11.Shibaura Machine
- 10.2.12.Suzhou Sanji Foundry Equipment
- 10.2.13.UBE Machinery
- 10.2.14.Yizumi Holdings
- 10.2.15.T'Zitai Precision Machinery
- 10.2.16.Others
11.360 Degree Analyst View
12.Appendix
- 12.1.Research Methodology
- 12.2.References
- 12.3.Abbreviations
- 12.4.Disclaimer
- 12.5.Contact Us
