|
|
市場調査レポート
商品コード
1424988
検体採取カード市場:検体タイプ別、製品別、用途別、エンドユーザー別、国別、地域別 - 産業分析、市場規模、市場シェア、予測、2023-2030年Specimen Collection Cards Market, By Specimen Type, By Product, By Application, By End-User, By Country, and By Region - Industry Analysis, Market Size, Market Share & Forecast from 2023-2030 |
||||||
|
|||||||
カスタマイズ可能
|
|||||||

| 検体採取カード市場:検体タイプ別、製品別、用途別、エンドユーザー別、国別、地域別 - 産業分析、市場規模、市場シェア、予測、2023-2030年 |
|
出版日: 2024年02月07日
発行: AnalystView Market Insights
ページ情報: 英文 285 Pages
納期: 2~3営業日
|

全表示
- 概要
- 図表
- 目次
レポートハイライト
2022年の検体採取カード市場規模は4億4,501万米ドルで、2023年から2030年にかけてCAGR 4.5%で拡大
検体採取カード市場-市場力学
効率的な人間工学へのニーズの高まりと新製品の研究開発活動の高まりが市場需要を促進
有利な政府法、効果的なエルゴノミクス、非侵襲的な処置への注目の高まりから、市場の拡大が見込まれます。また、製品リリースの増加や研究開発の活発化が市場拡大にプラスに働くと予想されます。ワクチン製造に関連する検査や調査は業務量が多いため、流行初期には検体採取カードの需要が大きかった。検体採取カード市場は、法医学毒物学用途の成長によって大きな影響を受け、正確な検体採取のための信頼できる効果的なツールとして、これらのカードが広く受け入れられるようになった。
検体採取カードは、使用が簡単で信頼性が高く、保存期間が長いため、法薬毒物学で広く使用されています。非侵襲性、必要検体量の少なさ、保管・輸送中の検体安定性の向上など、いくつかの利点があり、これらすべてが法薬毒物検査の効率と精度の向上に寄与しています。加えて、遺伝子検査、ウェルビーイングイニシアチブ、ヘルスモニタリング、個別化薬物療法が重視されるようになっていることも、市場の拡大に寄与しています。唾液、血液、組織などのさまざまな生物学的サンプルを収集する実用的で信頼できる方法を提供する検体収集カードは、遺伝子検査手順において不可欠な機器へと進化しています。
検体採取カード市場-主要インサイト
リサーチアナリストの分析によると、世界市場は予測期間(2023-2030年)にCAGR約4.5%で年間成長すると予測されています。
検体タイプ別では、血液検体採取需要の高まりにより、血液が2022年に最大市場シェアを示すと予測されています。
製品別では、Whatman 903が、主に調査での採用増加により、2022年に主要セグメントとなりました。
用途別では、新生児スクリーニングが2022年の主要分野で、主に新生児のスクリーニングやスキャニングの需要が高いためです。
エンドユーザー別では、主に血液や尿に関連するさまざまな疾患の診断ニーズの高まりにより、病院・診療所が2022年の主要セグメントでした。
地域別では、北米が2022年の主要収益源であり、これは最先端の製品、MLソリューションの採用が増加しているためです。
検体採取カード市場-セグメンテーション分析:
検体採取カードの世界市場は、検体タイプ、製品タイプ、用途、エンドユーザー、地域によって区分されます。
検体タイプにより、血液、唾液、尿、頬側細胞、その他の5つに分類されます。血液セグメントが市場を独占しています。疾病検査手順における血液サンプルの需要の高まりが、同分野の成長を後押しすると期待されています。
市場は製品によって4つのカテゴリーに分けられる:Whatman 903、Alstrom 226、FTA、その他。Whatman 903は市場を独占しており、予測期間中もその優位性を維持すると思われます。Whatman 903製品はサンプル採取と検査に非常に効果的です。
新生児スクリーニング、感染症検査、フォレンジック、ヘルスモニタリング、その他。新生児スクリーニングが市場を独占しており、予測期間中もその優位性は維持されると思われます。これは、新生児スクリーニングと疾病診断の進歩によるものです。
市場はエンドユーザーに基づき、病院&クリニック、診断センター、その他の3つに分類されます。病院・診療所が市場を独占しており、予測期間中もその優位性は維持されると思われます。これは、病院・診療所における検体採取の需要が高いことが一因です。
検体採取カード市場-地理的洞察
地理的に、この市場は北米、ラテンアメリカ、欧州、アジア太平洋、中東・アフリカの地域に広がっています。これらの地域はビジネスをもたらす国によってさらに分けられます。予測期間中、北米が市場を独占すると見られています。これは、抗生物質、免疫抑制剤、抗てんかん薬など、さまざまな医薬品の薬剤プロファイルに対する要求が高まっているためです。市場拡大の主な要因となっています。この分野の市場拡大を支えるその他の要因としては、確立されたヘルスケアインフラの存在や、研究に対する政府資金の利用可能性などが挙げられます。
検体採取カード市場-競合情勢:
検体採取カードの市場は、多数の有名な市場プレーヤーと多数の新興企業や専門的なライバルが共存しているため、かなり統合されています。消費者に最先端の機能を提供するため、大手企業は研究開発とイノベーションに投資しています。主要市場参入企業は、合弁事業や提携戦略に注力し、新興国市場や経済的に有利な地域への地理的拡大を図っています。
目次
第1章 検体採取カード市場概要
- 調査範囲
- 市場推定年数
第2章 エグゼクティブサマリー
- 市場内訳
- 競合考察
第3章 検体採取カードの主要な市場動向
- 市場促進要因
- 市場抑制要因
- 市場機会
- 今後の市場動向
第4章 検体採取カード業界の調査
- PEST分析
- ポーターのファイブフォース分析
- 成長見通しのマッピング
- 規制枠組みの分析
第5章 検体収集カード市場:COVID-19の影響分析
- COVID-19以前の影響分析
- COVID-19以後の影響分析
第6章 検体採取カード市場情勢
- 検体コレクションカード市場シェア分析、2022年
- 主要メーカー別の内訳データ
- 既存企業の分析
- 新興企業の分析
第7章 検体採取カード市場- 検体タイプ別
- 概要
- 検体タイプ別のセグメントシェア分析
- 血液
- 唾液
- 尿
- 頬細胞
- その他
第8章 検体採取カード市場- 製品別
- 概要
- 製品別のセグメントシェア分析
- Whatman 903
- Alstrom 226
- FTA
- その他
第9章 検体コレクションカード市場- 用途別
- 概要
- 用途別のセグメントシェア分析
- 新生児スクリーニング
- 感染症検査
- 法医学
- ヘルスモニタリング
- その他
第10章 検体コレクションカード市場- エンドユーザー別
- 概要
- エンドユーザー別のセグメントシェア分析
- 病院・診療所
- 診断センター
- その他
第11章 検体採取カード市場- 地域別
- イントロダクション
- 北米
- 概要
- 北米の主要メーカー
- 米国
- カナダ
- 欧州
- 概要
- 欧州の主要メーカー
- ドイツ
- イタリア
- 英国
- フランス
- ロシア
- オランダ
- スウェーデン
- ポーランド
- その他
- アジア太平洋(APAC)
- 概要
- アジア太平洋の主要メーカー
- インド
- 中国
- 日本
- 韓国
- オーストラリア
- タイ
- インドネシア
- フィリピン
- その他
- ラテンアメリカ
- 概要
- ラテンアメリカの主要メーカー
- ブラジル
- メキシコ
- アルゼンチン
- コロンビア
- その他
- 中東とアフリカ
- 概要
- 中東とアフリカの主要メーカー
- サウジアラビア
- アラブ首長国連邦
- イスラエル
- トルコ
- アルジェリア
- エジプト
- その他
第12章 主要ベンダー分析- 検体採取カード業界
- 競合ダッシュボード
- 企業プロファイル
- ABBYY
- QIAGEN
- PerkinElmer Inc.
- DBS System SA
- Danaher Corporation
- Eastern Business Forms, Inc.
- Ahlstrom
- ARCHIMED Life Science GmbH
- F Hoffman La Roche Ltd.
- Shimadzu Scientific Instruments
- GenTegra LLC
- FortiusBio
- CENTOGENE NV
- Genomica SA
- Others
第13章 アナリストの全方位展望
List of Tables
- TABLE List of data sources
- TABLE Market drivers; Impact Analysis
- TABLE Market restraints; Impact Analysis
- TABLE Specimen Collection Cards Market: Specimen Type Snapshot (2022)
- TABLE Segment Dashboard; Definition and Scope, by Specimen Type
- TABLE Global Specimen Collection Cards Market, by Specimen Type 2018-2030 (USD Million)
- TABLE Specimen Collection Cards Market: Product Snapshot (2022)
- TABLE Segment Dashboard; Definition and Scope, by Product
- TABLE Global Specimen Collection Cards Market, by Product 2018-2030 (USD Million)
- TABLE Specimen Collection Cards Market: Application Snapshot (2022)
- TABLE Segment Dashboard; Definition and Scope, by Application
- TABLE Global Specimen Collection Cards Market, by Application 2018-2030 (USD Million)
- TABLE Specimen Collection Cards Market: End User Snapshot (2022)
- TABLE Segment Dashboard; Definition and Scope, by End User
- TABLE Global Specimen Collection Cards Market, by End User 2018-2030 (USD Million)
- TABLE Specimen Collection Cards Market: Regional snapshot (2022)
- TABLE Segment Dashboard; Definition and Scope, by Region
- TABLE Global Specimen Collection Cards Market, by Region 2018-2030 (USD Million)
- TABLE North America Specimen Collection Cards Market, by Country, 2018-2030 (USD Million)
- TABLE North America Specimen Collection Cards Market, by Specimen Type, 2018-2030 (USD Million)
- TABLE North America Specimen Collection Cards Market, by Product, 2018-2030 (USD Million)
- TABLE North America Specimen Collection Cards Market, by Application, 2018-2030 (USD Million)
- TABLE North America Specimen Collection Cards Market, by End User, 2018-2030 (USD Million)
- TABLE Europe Specimen Collection Cards Market, by Country, 2018-2030 (USD Million)
- TABLE Europe Specimen Collection Cards Market, by Specimen Type, 2018-2030 (USD Million)
- TABLE Europe Specimen Collection Cards Market, by Product, 2018-2030 (USD Million)
- TABLE Europe Specimen Collection Cards Market, by Application, 2018-2030 (USD Million)
- TABLE Europe Specimen Collection Cards Market, by End User, 2018-2030 (USD Million)
- TABLE Asia Pacific Specimen Collection Cards Market, by Country, 2018-2030 (USD Million)
- TABLE Asia Pacific Specimen Collection Cards Market, by Specimen Type, 2018-2030 (USD Million)
- TABLE Asia Pacific Specimen Collection Cards Market, by Product, 2018-2030 (USD Million)
- TABLE Asia Pacific Specimen Collection Cards Market, by Application, 2018-2030 (USD Million)
- TABLE Asia Pacific Specimen Collection Cards Market, by End User, 2018-2030 (USD Million)
- TABLE Latin America Specimen Collection Cards Market, by Country, 2018-2030 (USD Million)
- TABLE Latin America Specimen Collection Cards Market, by Specimen Type, 2018-2030 (USD Million)
- TABLE Latin America Specimen Collection Cards Market, by Product, 2018-2030 (USD Million)
- TABLE Latin America Specimen Collection Cards Market, by Application, 2018-2030 (USD Million)
- TABLE Latin America Specimen Collection Cards Market, by End User, 2018-2030 (USD Million)
- TABLE Middle East and Africa Specimen Collection Cards Market, by Country, 2018-2030 (USD Million)
- TABLE Middle East and Africa Specimen Collection Cards Market, by Specimen Type, 2018-2030 (USD Million)
- TABLE Middle East and Africa Specimen Collection Cards Market, by Product, 2018-2030 (USD Million)
- TABLE Middle East and Africa Specimen Collection Cards Market, by Application, 2018-2030 (USD Million)
- TABLE Middle East and Africa Specimen Collection Cards Market, by End User, 2018-2030 (USD Million)
REPORT HIGHLIGHT
Specimen Collection Cards Market size was valued at USD 445.01 Million in 2022, expanding at a CAGR of 4.5% from 2023 to 2030.
The procedure of obtaining tissue or fluids for laboratory analysis is known as specimen collection. Serum samples, virology swab samples, biopsy and necropsy tissue, cerebrospinal fluid, whole blood for PCR, and urine samples are a few examples of the samples that may be obtained. The Specimen collecting Card portfolio makes the collecting, transportation, and storage of bio samples at room temperature easy and affordable.
Specimen Collection Cards Market- Market Dynamics
Increasing need for efficient ergonomics & rising R&D activities in new products to propel market demand
The market is expected to rise because of advantageous government laws, effective ergonomics, and a growing focus on non-invasive procedures. In addition, it is anticipated that a growing number of product releases and a rise in research and development will positively affect market expansion. Because of the heavy workload of testing and research related to vaccine production, there was a significant demand for specimen collection cards during the early stages of the epidemic. The market for specimen-collecting cards was significantly impacted by the growth of forensic toxicology applications, which pushed these cards' widespread acceptance as reliable and effective tools for accurate sample collection.
Specimen collection cards are widely used in forensic toxicology because they are simple to use, dependable, and have a long shelf life. They offer several advantages, including noninvasiveness, a lower sample volume requirement, and enhanced sample stability during storage and transit, all of which contribute to higher efficiency & accuracy in forensic toxicological testing. In addition, the growing emphasis on genetic testing, well-being initiatives, health monitoring, and personalized medication is credited with the market's expansion. Specimen collection cards, which provide a practical and dependable way to gather different biological samples, such as saliva, blood, and tissue, have evolved into indispensable instruments in genetic testing procedures.
Specimen Collection Cards Market- Key Insights
As per the analysis shared by our research analyst, the global market is estimated to grow annually at a CAGR of around 4.5% over the forecast period (2023-2030)
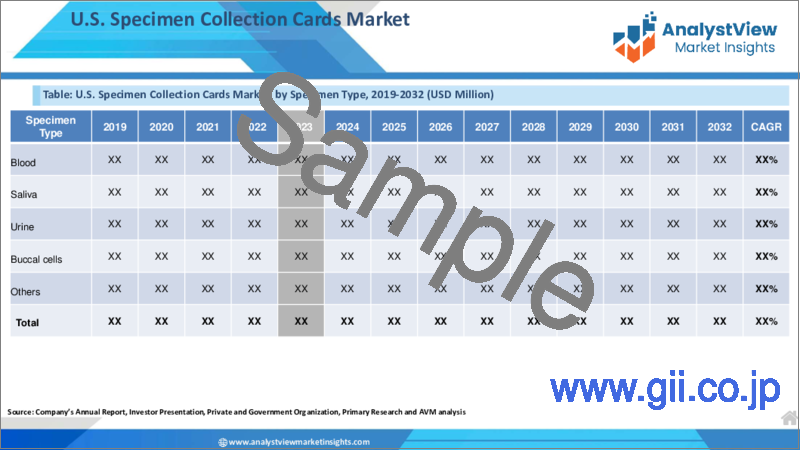
Based on Specimen Type segmentation, blood was predicted to show maximum market share in the year 2022, owing to rising demand for collection of blood samples.
Based on Product segmentation, Whatman 903 was the leading segment in 2022, mainly due to increased adoption in research.
Based on Application segmentation, newborn screening was the leading segment in 2022, mainly due to high demand for screening, scanning in newborn babies.
Based on End user segmentation, hospitals & clinics was the leading type in 2022, mainly due to rising need for diagnostics of different blood, urine related diseases.
On the basis of region, North America was the leading revenue generator in 2022, owing to growing adoption cutting edge Product, ML solutions.
Specimen Collection Cards Market- Segmentation Analysis:
The Global Specimen Collection Cards Market is segmented on the basis of Specimen Type, Product, Application, End-User, and Region.
The market is divided into five categories based on Specimen Type: blood, saliva, urine, buccal cells, and others. The blood segment dominates the market. The growing demand for blood sample in disease testing procedures is expected to boost the segment growth.
The market is divided into four categories based on Product: Whatman 903, Alstrom 226, FTA, and others. The Whatman 903 dominates the market and is likely to maintain its dominance during the forecast period. Whatman 903 products are highly effective in sample collection & testing.
The market is divided into five categories based on Application: newborn screening, infectious disease testing, forensics, health monitoring, and others. The newborn screening dominates the market and is likely to maintain its dominance during the forecast period. This is due to advancement in newborn screening and disease diagnosis.
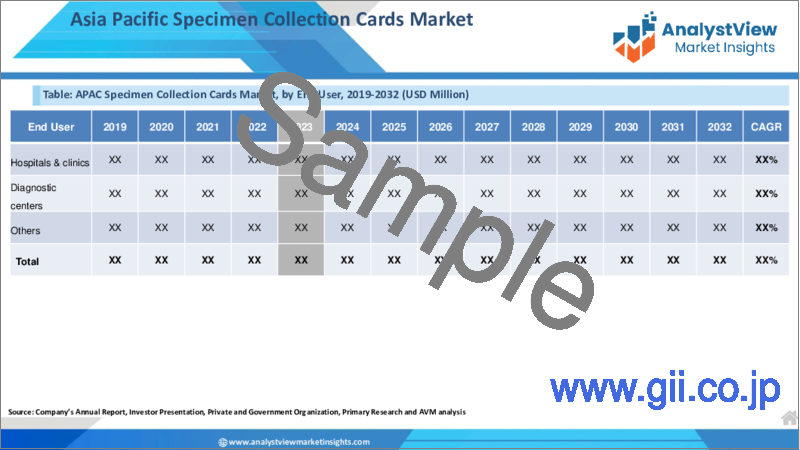
The market is divided into three categories based on End User: hospitals & clinics, diagnostic centers, and others. The hospitals & clinics dominate the market and is likely to maintain its dominance during the forecast period. This is partly due to high demand for specimen collection in hospitals & clinics.
Specimen Collection Cards Market- Geographical Insights
Geographically, this market is widespread into the regions of North America, Latin America, Europe, Asia Pacific, and the Middle East and Africa. These regions are further divided as per the nations bringing business. North America is expected to dominate the market during the forecast period. This is explained by the increasing requirement for drug profile for a variety of pharmaceuticals, including antibiotics, immunosuppressants, and antiepileptics. It is a major driver of the market's expansion. Other factors that are expected to support market expansion in this area include the existence of a well-established healthcare infrastructure and the availability of government funding for research.
Specimen Collection Cards Market- Competitive Landscape:
With numerous well-known market players coexisting with numerous startups and specialized rivals, the market for specimen collection cards is rather consolidated. To provide consumers with cutting-edge features, the big businesses invest in R&D and innovation. Major market participants are concentrating on joint ventures, cooperative strategies, and expanding geographically into developing and economically advantageous areas.
Recent Developments:
In 2022, GenTegra LLC received funding of USD 2.8 million to leverage on its research and development activities.
SCOPE OF THE REPORT
The scope of this report covers the market by its major segments, which include as follows:
GLOBAL SPECIMEN COLLECTION CARDS MARKET KEY PLAYERS
- QIAGEN
- PerkinElmer Inc.
- DBS System SA
- Danaher Corporation
- Eastern Business Forms, Inc.
- Ahlstrom
- ARCHIMED Life Science GmbH
- F Hoffman La Roche Ltd.
- Shimadzu Scientific Instruments
- GenTegra LLC
- FortiusBio
- CENTOGENE N.V.
- Genomica SA
- Others
GLOBAL SPECIMEN COLLECTION CARDS MARKET, BY SPECIMEN TYPE
- Blood
- Saliva
- Urine
- Buccal cells
- Others
GLOBAL SPECIMEN COLLECTION CARDS MARKET, BY PRODUCT
- Whatman 903
- Alstrom 226
- FTA
- Others
GLOBAL SPECIMEN COLLECTION CARDS MARKET, BY APPLICATION
- Newborn screening
- Infectious disease testing
- Forensics
- Health monitoring
- Others
GLOBAL SPECIMEN COLLECTION CARDS MARKET, BY END-USER
- Hospitals & clinics
- Diagnostic centers
- Others
GLOBAL SPECIMEN COLLECTION CARDS MARKET, BY REGION
- North America
- The U.S.
- Canada
- Europe
- Germany
- France
- Italy
- Spain
- United Kingdom
- Russia
- Netherlands
- Sweden
- Poland
- Rest of Europe
- Asia Pacific
- India
- China
- South Korea
- Japan
- Australia
- Thailand
- Indonesia
- Philippines
- Rest of APAC
- Latin America
- Brazil
- Mexico
- Argentina
- Colombia
- Rest of LATAM
- The Middle East and Africa
- Saudi Arabia
- United Arab Emirates
- Israel
- Turkey
- Algeria
- Egypt
- Rest of MEA
Table of Contents
1. Specimen Collection Cards Market Overview
- 1.1. Study Scope
- 1.2. Market Estimation Years
2. Executive Summary
- 2.1. Market Snippet
- 2.1.1. Specimen Collection Cards Market Snippet by Specimen Type
- 2.1.2. Specimen Collection Cards Market Snippet by Product
- 2.1.3. Specimen Collection Cards Market Snippet by Application
- 2.1.4. Specimen Collection Cards Market Snippet by End User
- 2.1.5. Specimen Collection Cards Market Snippet by Country
- 2.1.6. Specimen Collection Cards Market Snippet by Region
- 2.2. Competitive Insights
3. Specimen Collection Cards Key Market Trends
- 3.1. Specimen Collection Cards Market Drivers
- 3.1.1. Impact Analysis of Market Drivers
- 3.2. Specimen Collection Cards Market Restraints
- 3.2.1. Impact Analysis of Market Restraints
- 3.3. Specimen Collection Cards Market Opportunities
- 3.4. Specimen Collection Cards Market Future Trends
4. Specimen Collection Cards Industry Study
- 4.1. PEST Analysis
- 4.2. Porter's Five Forces Analysis
- 4.3. Growth Prospect Mapping
- 4.4. Regulatory Framework Analysis
5. Specimen Collection Cards Market: COVID-19 Impact Analysis
- 5.1. Pre-COVID-19 Impact Analysis
- 5.2. Post-COVID-19 Impact Analysis
- 5.2.1. Top Performing Segments
- 5.2.2. Marginal Growth Segments
- 5.2.3. Top Looser Segments
- 5.2.4. Marginal Loss Segments
6. Specimen Collection Cards Market Landscape
- 6.1. Specimen Collection Cards Market Share Analysis, 2022
- 6.2. Breakdown Data, by Key Manufacturer
- 6.2.1. Established Players' Analysis
- 6.2.2. Emerging Players' Analysis
7. Specimen Collection Cards Market - By Specimen Type
- 7.1. Overview
- 7.1.1. Segment Share Analysis, By Specimen Type, 2022 & 2030 (%)
- 7.1.2. Blood
- 7.1.3. Saliva
- 7.1.4. Urine
- 7.1.5. Buccal cells
- 7.1.6. Others
8. Specimen Collection Cards Market - By Product
- 8.1. Overview
- 8.1.1. Segment Share Analysis, By Product, 2022 & 2030 (%)
- 8.1.2. Whatman 903
- 8.1.3. Alstrom 226
- 8.1.4. FTA
- 8.1.5. Others
9. Specimen Collection Cards Market - By Application
- 9.1. Overview
- 9.1.1. Segment Share Analysis, By Application, 2022 & 2030 (%)
- 9.1.2. Newborn screening
- 9.1.3. Infectious disease testing
- 9.1.4. Forensics
- 9.1.5. Health monitoring
- 9.1.6. Others
10. Specimen Collection Cards Market - By End User
- 10.1. Overview
- 10.1.1. Segment Share Analysis, By Product, 2022 & 2030 (%)
- 10.1.2. Hospitals & clinics
- 10.1.3. Diagnostic centers
- 10.1.4. Others
11. Specimen Collection Cards Market- By Geography
- 11.1. Introduction
- 11.1.1. Segment Share Analysis, By Geography, 2022 & 2030 (%)
- 11.2. North America
- 11.2.1. Overview
- 11.2.2. Specimen Collection Cards Key Manufacturers in North America
- 11.2.3. North America Market Size and Forecast, By Country, 2018 - 2030 (US$ Million)
- 11.2.4. North America Market Size and Forecast, By Specimen Type, 2018 - 2030 (US$ Million)
- 11.2.5. North America Market Size and Forecast, By Product, 2018 - 2030 (US$ Million)
- 11.2.6. North America Market Size and Forecast, By Application, 2018 - 2030 (US$ Million)
- 11.2.7. North America Market Size and Forecast, By End User, 2018 - 2030 (US$ Million)
- 11.2.8. U.S.
- 11.2.8.1. Overview
- 11.2.8.2. Market Analysis, Forecast, and Y-O-Y Growth Rate, 2018 - 2030, (US$ Million)
- 11.2.8.3. U.S. Market Size and Forecast, By Specimen Type, 2018 - 2030 (US$ Million)
- 11.2.8.4. U.S. Market Size and Forecast, By Product, 2018 - 2030 (US$ Million)
- 11.2.8.5. U.S. Market Size and Forecast, By Application, 2018 - 2030 (US$ Million)
- 11.2.8.6. U.S. Market Size and Forecast, By End User, 2018 - 2030 (US$ Million)
- 11.2.9. Canada
- 11.2.9.1. Overview
- 11.2.9.2. Market Analysis, Forecast, and Y-O-Y Growth Rate, 2018 - 2030, (US$ Million)
- 11.2.9.3. Canada Market Size and Forecast, By Specimen Type, 2018 - 2030 (US$ Million)
- 11.2.9.4. Canada Market Size and Forecast, By Product, 2018 - 2030 (US$ Million)
- 11.2.9.5. Canada Market Size and Forecast, By Application, 2018 - 2030 (US$ Million)
- 11.2.9.6. Canada Market Size and Forecast, By End User, 2018 - 2030 (US$ Million)
- 11.3. Europe
- 11.3.1. Overview
- 11.3.2. Specimen Collection Cards Key Manufacturers in Europe
- 11.3.3. Europe Market Size and Forecast, By Country, 2018 - 2030 (US$ Million)
- 11.3.4. Europe Market Size and Forecast, By Specimen Type, 2018 - 2030 (US$ Million)
- 11.3.5. Europe Market Size and Forecast, By Product, 2018 - 2030 (US$ Million)
- 11.3.6. Europe Market Size and Forecast, By Application, 2018 - 2030 (US$ Million)
- 11.3.7. Europe Market Size and Forecast, By End User, 2018 - 2030 (US$ Million)
- 11.3.8. Germany
- 11.3.8.1. Overview
- 11.3.8.2. Market Analysis, Forecast, and Y-O-Y Growth Rate, 2018 - 2030, (US$ Million)
- 11.3.8.3. Germany Market Size and Forecast, By Specimen Type, 2018 - 2030 (US$ Million)
- 11.3.8.4. Germany Market Size and Forecast, By Product, 2018 - 2030 (US$ Million)
- 11.3.8.5. Germany Market Size and Forecast, By Application, 2018 - 2030 (US$ Million)
- 11.3.8.6. Germany Market Size and Forecast, By End User, 2018 - 2030 (US$ Million)
- 11.3.9. Italy
- 11.3.9.1. Overview
- 11.3.9.2. Market Analysis, Forecast, and Y-O-Y Growth Rate, 2018 - 2030, (US$ Million)
- 11.3.9.3. Italy Market Size and Forecast, By Specimen Type, 2018 - 2030 (US$ Million)
- 11.3.9.4. Italy Market Size and Forecast, By Product, 2018 - 2030 (US$ Million)
- 11.3.9.5. Italy Market Size and Forecast, By Application, 2018 - 2030 (US$ Million)
- 11.3.9.6. Italy Market Size and Forecast, By End User, 2018 - 2030 (US$ Million)
- 11.3.10. United Kingdom
- 11.3.10.1. Overview
- 11.3.10.2. Market Analysis, Forecast, and Y-O-Y Growth Rate, 2018 - 2030, (US$ Million)
- 11.3.10.3. United Kingdom Market Size and Forecast, By Specimen Type, 2018 - 2030 (US$ Million)
- 11.3.10.4. United Kingdom Market Size and Forecast, By Product, 2018 - 2030 (US$ Million)
- 11.3.10.5. United Kingdom Market Size and Forecast, By Application, 2018 - 2030 (US$ Million)
- 11.3.10.6. United Kingdom Market Size and Forecast, By End User, 2018 - 2030 (US$ Million)
- 11.3.11. France
- 11.3.11.1. Overview
- 11.3.11.2. Market Analysis, Forecast, and Y-O-Y Growth Rate, 2018 - 2030, (US$ Million)
- 11.3.11.3. France Market Size and Forecast, By Specimen Type, 2018 - 2030 (US$ Million)
- 11.3.11.4. France Market Size and Forecast, By Product, 2018 - 2030 (US$ Million)
- 11.3.11.5. France Market Size and Forecast, By Application, 2018 - 2030 (US$ Million)
- 11.3.11.6. France Market Size and Forecast, By End User, 2018 - 2030 (US$ Million)
- 11.3.12. Russia
- 11.3.12.1. Market Analysis, Forecast, and Y-O-Y Growth Rate, 2018 - 2030, (US$ Million)
- 11.3.12.2. Russia Market Size and Forecast, By Specimen Type, 2018 - 2030 (US$ Million)
- 11.3.12.3. Russia Market Size and Forecast, By Product, 2018 - 2030 (US$ Million)
- 11.3.12.4. Russia Market Size and Forecast, By Application, 2018 - 2030 (US$ Million)
- 11.3.12.5. Russia Market Size and Forecast, By End User, 2018 - 2030 (US$ Million)
- 11.3.13. Netherlands
- 11.3.13.1. Market Analysis, Forecast, and Y-O-Y Growth Rate, 2018 - 2030, (US$ Million)
- 11.3.13.2. Netherlands Market Size and Forecast, By Specimen Type, 2018 - 2030 (US$ Million)
- 11.3.13.3. Netherlands Market Size and Forecast, By Product, 2018 - 2030 (US$ Million)
- 11.3.13.4. Netherlands Market Size and Forecast, By Application, 2018 - 2030 (US$ Million)
- 11.3.13.5. Netherlands Market Size and Forecast, By End User, 2018 - 2030 (US$ Million)
- 11.3.14. Sweden
- 11.3.14.1. Market Analysis, Forecast, and Y-O-Y Growth Rate, 2018 - 2030, (US$ Million)
- 11.3.14.2. Sweden Market Size and Forecast, By Specimen Type, 2018 - 2030 (US$ Million)
- 11.3.14.3. Sweden Market Size and Forecast, By Product, 2018 - 2030 (US$ Million)
- 11.3.14.4. Sweden Market Size and Forecast, By Application, 2018 - 2030 (US$ Million)
- 11.3.14.5. Sweden Market Size and Forecast, By End User, 2018 - 2030 (US$ Million)
- 11.3.15. Poland
- 11.3.15.1. Market Analysis, Forecast, and Y-O-Y Growth Rate, 2018 - 2030, (US$ Million)
- 11.3.15.2. Poland Market Size and Forecast, By Specimen Type, 2018 - 2030 (US$ Million)
- 11.3.15.3. Poland Market Size and Forecast, By Product, 2018 - 2030 (US$ Million)
- 11.3.15.4. Poland Market Size and Forecast, By Application, 2018 - 2030 (US$ Million)
- 11.3.15.5. Poland Market Size and Forecast, By End User, 2018 - 2030 (US$ Million)
- 11.3.16. Rest of Europe
- 11.3.16.1. Overview
- 11.3.16.2. Market Analysis, Forecast, and Y-O-Y Growth Rate, 2018 - 2030, (US$ Million)
- 11.3.16.3. Rest of the Europe Market Size and Forecast, By Specimen Type, 2018 - 2030 (US$ Million)
- 11.3.16.4. Rest of the Europe Market Size and Forecast, By Product, 2018 - 2030 (US$ Million)
- 11.3.16.5. Rest of the Europe Market Size and Forecast, By Application, 2018 - 2030 (US$ Million)
- 11.3.16.6. Rest of the Europe Market Size and Forecast, By End User, 2018 - 2030 (US$ Million)
- 11.4. Asia Pacific (APAC)
- 11.4.1. Overview
- 11.4.2. Specimen Collection Cards Key Manufacturers in Asia Pacific
- 11.4.3. Asia Pacific Market Size and Forecast, By Country, 2018 - 2030 (US$ Million)
- 11.4.4. Asia Pacific Market Size and Forecast, By Specimen Type, 2018 - 2030 (US$ Million)
- 11.4.5. Asia Pacific Market Size and Forecast, By Product, 2018 - 2030 (US$ Million)
- 11.4.6. Asia Pacific Market Size and Forecast, By Application, 2018 - 2030 (US$ Million)
- 11.4.7. Asia Pacific Market Size and Forecast, By End User, 2018 - 2030 (US$ Million)
- 11.4.8. India
- 11.4.8.1. Overview
- 11.4.8.2. Market Analysis, Forecast, and Y-O-Y Growth Rate, 2018 - 2030, (US$ Million)
- 11.4.8.3. India Market Size and Forecast, By Specimen Type, 2018 - 2030 (US$ Million)
- 11.4.8.4. India Market Size and Forecast, By Product, 2018 - 2030 (US$ Million)
- 11.4.8.5. India Market Size and Forecast, By Application, 2018 - 2030 (US$ Million)
- 11.4.8.6. India Market Size and Forecast, By End User, 2018 - 2030 (US$ Million)
- 11.4.9. China
- 11.4.9.1. Overview
- 11.4.9.2. Market Analysis, Forecast, and Y-O-Y Growth Rate, 2018 - 2030, (US$ Million)
- 11.4.9.3. China Market Size and Forecast, By Specimen Type, 2018 - 2030 (US$ Million)
- 11.4.9.4. China Market Size and Forecast, By Product, 2018 - 2030 (US$ Million)
- 11.4.9.5. China Market Size and Forecast, By Application, 2018 - 2030 (US$ Million)
- 11.4.9.6. China Market Size and Forecast, By End User, 2018 - 2030 (US$ Million)
- 11.4.10. Japan
- 11.4.10.1. Overview
- 11.4.10.2. Market Analysis, Forecast, and Y-O-Y Growth Rate, 2018 - 2030, (US$ Million)
- 11.4.10.3. Japan Market Size and Forecast, By Specimen Type, 2018 - 2030 (US$ Million)
- 11.4.10.4. Japan Market Size and Forecast, By Product, 2018 - 2030 (US$ Million)
- 11.4.10.5. Japan Market Size and Forecast, By Application, 2018 - 2030 (US$ Million)
- 11.4.10.6. Japan Market Size and Forecast, By End User, 2018 - 2030 (US$ Million)
- 11.4.11. South Korea
- 11.4.11.1. Overview
- 11.4.11.2. Market Analysis, Forecast, and Y-O-Y Growth Rate, 2018 - 2030, (US$ Million)
- 11.4.11.3. South Korea Market Size and Forecast, By Specimen Type, 2018 - 2030 (US$ Million)
- 11.4.11.4. South Korea Market Size and Forecast, By Product, 2018 - 2030 (US$ Million)
- 11.4.11.5. South Korea Market Size and Forecast, By Application, 2018 - 2030 (US$ Million)
- 11.4.11.6. South Korea Market Size and Forecast, By End User, 2018 - 2030 (US$ Million)
- 11.4.12. Australia
- 11.4.12.1. Overview
- 11.4.12.2. Market Analysis, Forecast, and Y-O-Y Growth Rate, 2018 - 2030, (US$ Million)
- 11.4.12.3. Australia Market Size and Forecast, By Specimen Type, 2018 - 2030 (US$ Million)
- 11.4.12.4. Australia Market Size and Forecast, By Product, 2018 - 2030 (US$ Million)
- 11.4.12.5. Australia Market Size and Forecast, By Application, 2018 - 2030 (US$ Million)
- 11.4.12.6. Australia Market Size and Forecast, By End User, 2018 - 2030 (US$ Million)
- 11.4.13. Thailand
- 11.4.13.1. Overview
- 11.4.13.2. Market Analysis, Forecast, and Y-O-Y Growth Rate, 2018 - 2030, (US$ Million)
- 11.4.13.3. Thailand Market Size and Forecast, By Specimen Type, 2018 - 2030 (US$ Million)
- 11.4.13.4. Thailand Market Size and Forecast, By Product, 2018 - 2030 (US$ Million)
- 11.4.13.5. Thailand Market Size and Forecast, By Application, 2018 - 2030 (US$ Million)
- 11.4.13.6. Thailand Market Size and Forecast, By End User, 2018 - 2030 (US$ Million)
- 11.4.14. Indonesia
- 11.4.14.1. Overview
- 11.4.14.2. Market Analysis, Forecast, and Y-O-Y Growth Rate, 2018 - 2030, (US$ Million)
- 11.4.14.3. Indonesia Market Size and Forecast, By Specimen Type, 2018 - 2030 (US$ Million)
- 11.4.14.4. Indonesia Market Size and Forecast, By Product, 2018 - 2030 (US$ Million)
- 11.4.14.5. Indonesia Market Size and Forecast, By Application, 2018 - 2030 (US$ Million)
- 11.4.14.6. Indonesia Market Size and Forecast, By End User, 2018 - 2030 (US$ Million)
- 11.4.15. Philippines
- 11.4.15.1. Overview
- 11.4.15.2. Market Analysis, Forecast, and Y-O-Y Growth Rate, 2018 - 2030, (US$ Million)
- 11.4.15.3. Philippines Market Size and Forecast, By Specimen Type, 2018 - 2030 (US$ Million)
- 11.4.15.4. Philippines Market Size and Forecast, By Product, 2018 - 2030 (US$ Million)
- 11.4.15.5. Philippines Market Size and Forecast, By Application, 2018 - 2030 (US$ Million)
- 11.4.15.6. Philippines Market Size and Forecast, By End User, 2018 - 2030 (US$ Million)
- 11.4.16. Rest of APAC
- 11.4.16.1. Overview
- 11.4.16.2. Market Analysis, Forecast, and Y-O-Y Growth Rate, 2018 - 2030, (US$ Million)
- 11.4.16.3. Rest of APAC Market Size and Forecast, By Specimen Type, 2018 - 2030 (US$ Million)
- 11.4.16.4. Rest of APAC Market Size and Forecast, By Product, 2018 - 2030 (US$ Million)
- 11.4.16.5. Rest of APAC Market Size and Forecast, By Application, 2018 - 2030 (US$ Million)
- 11.4.16.6. Rest of APAC Market Size and Forecast, By End User, 2018 - 2030 (US$ Million)
- 11.5. Latin America
- 11.5.1. Overview
- 11.5.2. Specimen Collection Cards Key Manufacturers in Latin America
- 11.5.3. Latin America Market Size and Forecast, By Country, 2018 - 2030 (US$ Million)
- 11.5.4. Latin America Market Size and Forecast, By Specimen Type, 2018 - 2030 (US$ Million)
- 11.5.5. Latin America Market Size and Forecast, By Product, 2018 - 2030 (US$ Million)
- 11.5.6. Latin America Market Size and Forecast, By Application, 2018 - 2030 (US$ Million)
- 11.5.7. Latin America Market Size and Forecast, By End User, 2018 - 2030 (US$ Million)
- 11.5.8. Brazil
- 11.5.8.1. Overview
- 11.5.8.2. Market Analysis, Forecast, and Y-O-Y Growth Rate, 2018 - 2030, (US$ Million)
- 11.5.8.3. Brazil Market Size and Forecast, By Specimen Type, 2018 - 2030 (US$ Million)
- 11.5.8.4. Brazil Market Size and Forecast, By Product, 2018 - 2030 (US$ Million)
- 11.5.8.5. Brazil Market Size and Forecast, By Application, 2018 - 2030 (US$ Million)
- 11.5.8.6. Brazil Market Size and Forecast, By End User, 2018 - 2030 (US$ Million)
- 11.5.9. Mexico
- 11.5.9.1. Overview
- 11.5.9.2. Market Analysis, Forecast, and Y-O-Y Growth Rate, 2018 - 2030, (US$ Million)
- 11.5.9.3. Mexico Market Size and Forecast, By Specimen Type, 2018 - 2030 (US$ Million)
- 11.5.9.4. Mexico Market Size and Forecast, By Product, 2018 - 2030 (US$ Million)
- 11.5.9.5. Mexico Market Size and Forecast, By Application, 2018 - 2030 (US$ Million)
- 11.5.9.6. Mexico Market Size and Forecast, By End User, 2018 - 2030 (US$ Million)
- 11.5.10. Argentina
- 11.5.10.1. Overview
- 11.5.10.2. Market Analysis, Forecast, and Y-O-Y Growth Rate, 2018 - 2030, (US$ Million)
- 11.5.10.3. Argentina Market Size and Forecast, By Specimen Type, 2018 - 2030 (US$ Million)
- 11.5.10.4. Argentina Market Size and Forecast, By Product, 2018 - 2030 (US$ Million)
- 11.5.10.5. Argentina Market Size and Forecast, By Application, 2018 - 2030 (US$ Million)
- 11.5.10.6. Argentina Market Size and Forecast, By End User, 2018 - 2030 (US$ Million)
- 11.5.11. Colombia
- 11.5.11.1. Overview
- 11.5.11.2. Market Analysis, Forecast, and Y-O-Y Growth Rate, 2018 - 2030, (US$ Million)
- 11.5.11.3. Colombia Market Size and Forecast, By Specimen Type, 2018 - 2030 (US$ Million)
- 11.5.11.4. Colombia Market Size and Forecast, By Product, 2018 - 2030 (US$ Million)
- 11.5.11.5. Colombia Market Size and Forecast, By Application, 2018 - 2030 (US$ Million)
- 11.5.11.6. Colombia Market Size and Forecast, By End User, 2018 - 2030 (US$ Million)
- 11.5.12. Rest of LATAM
- 11.5.12.1. Overview
- 11.5.12.2. Market Analysis, Forecast, and Y-O-Y Growth Rate, 2018 - 2030, (US$ Million)
- 11.5.12.3. Rest of LATAM Market Size and Forecast, By Specimen Type, 2018 - 2030 (US$ Million)
- 11.5.12.4. Rest of LATAM Market Size and Forecast, By Product, 2018 - 2030 (US$ Million)
- 11.5.12.5. Rest of LATAM Market Size and Forecast, By Application, 2018 - 2030 (US$ Million)
- 11.5.12.6. Rest of LATAM Market Size and Forecast, By End User, 2018 - 2030 (US$ Million)
- 11.6. Middle East and Africa
- 11.6.1. Overview
- 11.6.2. Specimen Collection Cards Key Manufacturers in Middle East and Africa
- 11.6.3. Middle East and Africa Market Size and Forecast, By Country, 2018 - 2030 (US$ Million)
- 11.6.4. Middle East and Africa Market Size and Forecast, By Specimen Type, 2018 - 2030 (US$ Million)
- 11.6.5. Middle East and Africa Market Size and Forecast, By Product, 2018 - 2030 (US$ Million)
- 11.6.6. Middle East and Africa Market Size and Forecast, By Application, 2018 - 2030 (US$ Million)
- 11.6.7. Middle East and Africa Market Size and Forecast, By End User, 2018 - 2030 (US$ Million)
- 11.6.8. Saudi Arabia
- 11.6.8.1. Overview
- 11.6.8.2. Market Analysis, Forecast, and Y-O-Y Growth Rate, 2018 - 2030, (US$ Million)
- 11.6.8.3. Saudi Arabia Market Size and Forecast, By Specimen Type, 2018 - 2030 (US$ Million)
- 11.6.8.4. Saudi Arabia Market Size and Forecast, By Product, 2018 - 2030 (US$ Million)
- 11.6.8.5. Saudi Arabia Market Size and Forecast, By Application, 2018 - 2030 (US$ Million)
- 11.6.8.6. Saudi Arabia Market Size and Forecast, By End User, 2018 - 2030 (US$ Million)
- 11.6.9. United Arab Emirates
- 11.6.9.1. Overview
- 11.6.9.2. Market Analysis, Forecast, and Y-O-Y Growth Rate, 2018 - 2030, (US$ Million)
- 11.6.9.3. United Arab Emirates Market Size and Forecast, By Specimen Type, 2018 - 2030 (US$ Million)
- 11.6.9.4. United Arab Emirates Market Size and Forecast, By Product, 2018 - 2030 (US$ Million)
- 11.6.9.5. United Arab Emirates Market Size and Forecast, By Application, 2018 - 2030 (US$ Million)
- 11.6.9.6. United Arab Emirates Market Size and Forecast, By End User, 2018 - 2030 (US$ Million)
- 11.6.10. Israel
- 11.6.10.1. Overview
- 11.6.10.2. Market Analysis, Forecast, and Y-O-Y Growth Rate, 2018 - 2030, (US$ Million)
- 11.6.10.3. Israel Market Size and Forecast, By Specimen Type, 2018 - 2030 (US$ Million)
- 11.6.10.4. Israel Market Size and Forecast, By Product, 2018 - 2030 (US$ Million)
- 11.6.10.5. Israel Market Size and Forecast, By Application, 2018 - 2030 (US$ Million)
- 11.6.10.6. Israel Market Size and Forecast, By End User, 2018 - 2030 (US$ Million)
- 11.6.11. Turkey
- 11.6.11.1. Overview
- 11.6.11.2. Market Analysis, Forecast, and Y-O-Y Growth Rate, 2018 - 2030, (US$ Million)
- 11.6.11.3. Turkey Market Size and Forecast, By Specimen Type, 2018 - 2030 (US$ Million)
- 11.6.11.4. Turkey Market Size and Forecast, By Product, 2018 - 2030 (US$ Million)
- 11.6.11.5. Turkey Market Size and Forecast, By Application, 2018 - 2030 (US$ Million)
- 11.6.11.6. Turkey Market Size and Forecast, By End User, 2018 - 2030 (US$ Million)
- 11.6.12. Algeria
- 11.6.12.1. Overview
- 11.6.12.2. Market Analysis, Forecast, and Y-O-Y Growth Rate, 2018 - 2030, (US$ Million)
- 11.6.12.3. Algeria Market Size and Forecast, By Specimen Type, 2018 - 2030 (US$ Million)
- 11.6.12.4. Algeria Market Size and Forecast, By Product, 2018 - 2030 (US$ Million)
- 11.6.12.5. Algeria Market Size and Forecast, By Application, 2018 - 2030 (US$ Million)
- 11.6.12.6. Algeria Market Size and Forecast, By End User, 2018 - 2030 (US$ Million)
- 11.6.13. Egypt
- 11.6.13.1. Overview
- 11.6.13.2. Market Analysis, Forecast, and Y-O-Y Growth Rate, 2018 - 2030, (US$ Million)
- 11.6.13.3. Egypt Market Size and Forecast, By Specimen Type, 2018 - 2030 (US$ Million)
- 11.6.13.4. Egypt Market Size and Forecast, By Product, 2018 - 2030 (US$ Million)
- 11.6.13.5. Egypt Market Size and Forecast, By Application, 2018 - 2030 (US$ Million)
- 11.6.13.6. Egypt Market Size and Forecast, By End User, 2018 - 2030 (US$ Million)
- 11.6.14. Rest of MEA
- 11.6.14.1. Overview
- 11.6.14.2. Market Analysis, Forecast, and Y-O-Y Growth Rate, 2018 - 2030, (US$ Million)
- 11.6.14.3. Rest of MEA Market Size and Forecast, By Specimen Type, 2018 - 2030 (US$ Million)
- 11.6.14.4. Rest of MEA Market Size and Forecast, By Product, 2018 - 2030 (US$ Million)
- 11.6.14.5. Rest of MEA Market Size and Forecast, By Application, 2018 - 2030 (US$ Million)
- 11.6.14.6. Rest of MEA Market Size and Forecast, By End User, 2018 - 2030 (US$ Million)
12. Key Vendor Analysis- Specimen Collection Cards Industry
- 12.1. Competitive Dashboard
- 12.2. Company Profiles
- 12.2.1. ABBYY
- 12.2.2. QIAGEN
- 12.2.3. PerkinElmer Inc.
- 12.2.4. DBS System SA
- 12.2.5. Danaher Corporation
- 12.2.6. Eastern Business Forms, Inc.
- 12.2.7. Ahlstrom
- 12.2.8. ARCHIMED Life Science GmbH
- 12.2.9. F Hoffman La Roche Ltd.
- 12.2.10. Shimadzu Scientific Instruments
- 12.2.11. GenTegra LLC
- 12.2.12. FortiusBio
- 12.2.13. CENTOGENE N.V.
- 12.2.14. Genomica SA
- 12.2.15. Others
13. 360 Degree Analyst View
14. Appendix
- 14.1. Research Methodology
- 14.2. References
- 14.3. Abbreviations
- 14.4. Disclaimer
- 14.5. Contact Us

