|
|
市場調査レポート
商品コード
1408920
セルソーティングの世界市場:製品タイプ別、技術別、用途別、最終用途別、国別、地域別 - 産業分析、市場規模、市場シェア、予測(2024~2032年)Cell Sorting Market, By Product Type, By Technology, By Application, By End-Use, By Country, and By Region - Industry Analysis, Market Size, Market Share & Forecast from 2024-2032 |
||||||
|
|
|||||||
|
● お客様のご希望に応じて、既存データの加工や未掲載情報(例:国別セグメント)の追加などの対応が可能です。 詳細はお問い合わせください。 |
|||||||


| セルソーティングの世界市場:製品タイプ別、技術別、用途別、最終用途別、国別、地域別 - 産業分析、市場規模、市場シェア、予測(2024~2032年) |
|
出版日: 2024年01月14日
発行: AnalystView Market Insights
ページ情報: 英文 288 Pages
納期: 2~3営業日
|
- 全表示
- 概要
- 図表
- 目次
レポートハイライト
世界のセルソーティングの市場規模は、2023年に9億4,567万米ドルとなり、2024~2032年にかけてCAGR 10.5%で拡大すると予測されています。
セルソーティング市場 - 市場力学
慢性疾患の蔓延が市場需要を促進
がんや糖尿病のような慢性疾患が一般的になるにつれ、細胞ベースの治療薬に対する需要が高まっています。セルソーティング技術は、これらの病気を理解し、そのための新しい治療法を開発するために不可欠です。セルソーティングのプロセスを通じて、医療専門家や科学者は様々な種類の細胞から特定の細胞を区別することができ、病気の原因や免疫学的マーカー、オーダーメイドの治療法の開発に関するより深い洞察を得ることができます。個別化された医療技術やより強力な治療法は、これらの相互関係をより深く理解することから生まれるかもしれないです。個別化治療技術やバイオマーカーの同定は、セルソーティングを用いて特定の細胞集団を分離することで達成できます。そして、これらの細胞集団はさらに定義され、評価されます。慢性疾患の世界の増加により、免疫療法や幹細胞療法を含む細胞ベースの治療に対する需要が高まっています。最終的な細胞ベースの製品の安全性と有効性を保証するために、セルソーティング技術はこれらの治療に使用する特定の細胞タイプの分離と濃縮を可能にします。したがって、予測期間を通じて、世界のセルソーティング市場は、慢性疾患の罹患率の増加によってもたらされる細胞ベースの治療に対する需要の増加により、より速い速度で上昇すると思われます。
セルソーティング市場 - 主要洞察
- 世界市場は、予測期間中(2024~2032年)に約10.5%のCAGRで毎年成長すると予測されています。
- 技術セグメンテーションに基づくと、蛍光ベースの液滴セルソーティングセグメントが予測期間中に市場を独占すると予測されます。
- 最終用途セグメンテーションに基づくと、研究機関セグメントが予測期間中に最も速い速度で成長すると予測されています。
- 地域別では、北米が予測期間中に市場を独占すると予測されています。
セルソーティング市場 - セグメンテーション分析:
- 世界のセルソーティング市場は、製品タイプ、技術、用途、最終用途、地域に基づいてセグメント化されます。
- 技術に基づき、世界市場は磁気活性化セルソーティング、蛍光ベースの液滴セルソーティング、MEMS-マイクロフルイディクスに分けられます。蛍光ベースの液滴セルソーティングセグメントは、非常に正確で精度の高いソーティングプロセスであるため、予測期間中に市場を独占すると予想されます。単一細胞のソーティングとハイスループット分析を必要とする多くの科学的テストに不可欠です。この用途では、蛍光活性化セルソーティング(FACS)がゴールドスタンダード技術です。FACSは、2つ以上の容器に入った生きた細胞の混合物を、各細胞の蛍光特性や光散乱特性に従って、一度に1細胞ずつ濾過する方法を提供します。個々の細胞からの蛍光シグナルを素早く、じっくり、バランスよく記録し、体内の関心のある特定の細胞を同定できる実用的な科学機器です。それによって、このセグメントの成長を牽引しています。
- 最終用途に基づき、市場は医学部・学術機関、研究機関、製薬・バイオ技術企業、病院・臨床検査機関に区分されます。研究機関セグメントは、細胞分析研究への取り組みの増加により、予測期間中に最も速い速度で成長すると予想されています。
セルソーティング市場 - 地理的洞察
地域的には、この市場は北米、ラテンアメリカ、欧州、アジア太平洋、中東・アフリカの地域に広がっています。これらの地域は、ビジネスをもたらす国によってさらに分けられます。北米は、製薬・バイオ技術分野への大規模な投資、がん研究におけるこのアプローチの利用率の上昇、米国などの国々における新規治療法の開発により、予測期間中に市場を独占すると予想されます。また、感染症やがんの罹患率が高まっていることも、地域拡大に拍車をかけています。米国疾病予防管理センターによると、2021年には感染症や寄生虫症を主な診断として1,550万人が診察室を訪れています。セルソーティング障害とがんの有病率の上昇は、全国的なヘルスケアコストの上昇とともに、この分野の市場拡大を後押ししています。
セルソーティング市場 - 競合情勢:
市場参入主要企業は以下の通り:Thermo Fisher Scientific Inc.、 Sony Biotechnology Inc.,、Miltenyi Biotec、Union Biometrica Inc.、STEMCELL Technologies Inc.、TERUMO BCT, INC.、Abgenex、Sysmex Europe GmbH、Sepmag、NanoCellect Biomedical、BD、Bio-Rad Laboratories, Inc.、Cytonome/ST, LLC、On-chip Biotechnologies Co.Ltd.、Beckman Coulter, Inc.、Luminex Corporation、pluriSelect Life Science UG(haftungsbeschrankt)&Co.KG、Bay bioscience Co.Ltd.、Cellular Highwaysなどがあります。これらのプレーヤーは、主要な市場シェアを獲得するために様々な戦略を行っています。M&A、契約、提携、製品発売などです。
目次
第1章 セルソーティングの市場概要
- 調査範囲
- 市場推定年数
第2章 エグゼクティブサマリー
- 市場内訳
- 競合考察
第3章 セルソーティングの主要な市場動向
- 市場促進要因
- 市場抑制要因
- 市場機会
- 今後の市場動向
第4章 セルソーティングの産業調査
- PEST分析
- ポーターのファイブフォース分析
- 成長見通しのマッピング
- 規制枠組みの分析
第5章 セルソーティング市場:COVID-19の影響分析
- COVID-19以前の影響分析
- COVID-19後の影響分析
第6章 セルソーティングの市場情勢
- セルソーティング市場シェア分析、2023年
- 内訳データ:主要メーカー別
- 既存企業の分析
- 新興企業の分析
第7章 セルソーティング市場:製品タイプ別
- 概要
- セグメントシェア分析:製品タイプ別
- 試薬・消耗品
- セルソーター
- サービス
第8章 セルソーティング市場:技術別
- 概要
- セグメントシェア分析:技術別
- 磁気活性化セルソーティング
- 蛍光ベースの液滴セルソーティング
- MEMS - マイクロフルイディクス
第9章 セルソーティング市場:用途別
- 概要
- セグメントシェア分析:用途別
- 臨床
- 研究
第10章 セルソーティング市場:最終用途別
- 概要
- セグメントシェア分析:最終用途別
- 医学部・学術機関
- 研究機関
- 製薬・バイオ技術企業
- 病院・臨床検査機関
第11章 セルソーティング市場:地域別
- イントロダクション
- 北米
- 概要
- 北米の主要メーカー
- 米国
- カナダ
- 欧州
- 概要
- 欧州の主要メーカー
- ドイツ
- イタリア
- 英国
- フランス
- ロシア
- オランダ
- スウェーデン
- ポーランド
- その他
- アジア太平洋
- 概要
- アジア太平洋の主要メーカー
- インド
- 中国
- 日本
- 韓国
- オーストラリア
- タイ
- インドネシア
- フィリピン
- その他
- ラテンアメリカ
- 概要
- ラテンアメリカの主要メーカー
- ブラジル
- メキシコ
- アルゼンチン
- コロンビア
- その他
- 中東・アフリカ
- 概要
- 中東・アフリカの主要メーカー
- サウジアラビア
- アラブ首長国連邦
- イスラエル
- トルコ
- アルジェリア
- エジプト
- その他
第12章 主要ベンダー分析:セルソーティング産業
- 競合ダッシュボード
- 企業プロファイル
- Thermo Fisher Scientific Inc.
- Sony Biotechnology Inc.
- Miltenyi Biotec
- Union Biometrica, Inc.
- STEMCELL Technologies Inc.
- TERUMO BCT, INC.
- Abgenex
- Sysmex Europe GmbH
- Sepmag
- NanoCellect Biomedical
- BD
- Bio-Rad Laboratories, Inc.
- Cytonome/ST, LLC
- On-chip Biotechnologies Co., Ltd.
- Beckman Coulter, Inc.
- Luminex Corporation
第13章 アナリストの全方位展望
List of Tables
- TABLE List of data Product Types
- TABLE Market drivers; Impact Analysis
- TABLE Market restraints; Impact Analysis
- TABLE Cell Sorting Market: Product Type Snapshot (2023)
- TABLE Segment Dashboard; Definition and Scope, by Product Type
- TABLE Global Cell Sorting Market, by Product Type 2019-2032 (USD Million)
- TABLE Cell Sorting Market: Technology Snapshot (2023)
- TABLE Segment Dashboard; Definition and Scope, by Technology
- TABLE Global Cell Sorting Market, by Technology 2019-2032 (USD Million)
- TABLE Cell Sorting Market: Application Snapshot (2023)
- TABLE Segment Dashboard; Definition and Scope, by Application
- TABLE Global Cell Sorting Market, by Application 2019-2032 (USD Million)
- TABLE Cell Sorting Market: End-Use Snapshot (2023)
- TABLE Segment Dashboard; Definition and Scope, by End-Use
- TABLE Global Cell Sorting Market, by End-Use 2019-2032 (USD Million)
- TABLE Cell Sorting Market: Regional snapshot (2023)
- TABLE Segment Dashboard; Definition and Scope, by Region
- TABLE Global Cell Sorting Market, by Region 2019-2032 (USD Million)
- TABLE North America Cell Sorting Market, by Country, 2019-2032 (USD Million)
- TABLE North America Cell Sorting Market, by Product Type, 2019-2032 (USD Million)
- TABLE North America Cell Sorting Market, by Technology, 2019-2032 (USD Million)
- TABLE North America Cell Sorting Market, by Application, 2019-2032 (USD Million)
- TABLE North America Cell Sorting Market, by End-Use, 2019-2032 (USD Million)
- TABLE Europe Cell Sorting Market, by Country, 2019-2032 (USD Million)
- TABLE Europe Cell Sorting Market, by Product Type, 2019-2032 (USD Million)
- TABLE Europe Cell Sorting Market, by Technology, 2019-2032 (USD Million)
- TABLE Europe Cell Sorting Market, by Application, 2019-2032 (USD Million)
- TABLE Europe Cell Sorting Market, by End-Use, 2019-2032 (USD Million)
- TABLE Asia Pacific Cell Sorting Market, by Country, 2019-2032 (USD Million)
- TABLE Asia Pacific Cell Sorting Market, by Product Type, 2019-2032 (USD Million)
- TABLE Asia Pacific Cell Sorting Market, by Technology, 2019-2032 (USD Million)
- TABLE Asia Pacific Cell Sorting Market, by Application, 2019-2032 (USD Million)
- TABLE Asia Pacific Cell Sorting Market, by End-Use, 2019-2032 (USD Million)
- TABLE Latin America Cell Sorting Market, by Country, 2019-2032 (USD Million)
- TABLE Latin America Cell Sorting Market, by Product Type, 2019-2032 (USD Million)
- TABLE Latin America Cell Sorting Market, by Technology, 2019-2032 (USD Million)
- TABLE Latin America Cell Sorting Market, by Application, 2019-2032 (USD Million)
- TABLE Latin America Cell Sorting Market, by End-Use, 2019-2032 (USD Million)
- TABLE Middle East and Africa Cell Sorting Market, by Country, 2019-2032 (USD Million)
- TABLE Middle East and Africa Cell Sorting Market, by Product Type, 2019-2032 (USD Million)
- TABLE Middle East and Africa Cell Sorting Market, by Technology, 2019-2032 (USD Million)
- TABLE Middle East and Africa Cell Sorting Market, by Application, 2019-2032 (USD Million)
- TABLE Middle East and Africa Cell Sorting Market, by End-Use, 2019-2032 (USD Million)
List of Figures
- FIGURE Cell Sorting Market Segmentation
- FIGURE Market research methodology
- FIGURE Value chain analysis
- FIGURE Porter's Five Forces Analysis
- FIGURE Market Attractiveness Analysis
- FIGURE COVID-19 Impact Analysis
- FIGURE Pre & Post COVID-19 Impact Comparision Study
- FIGURE Competitive Landscape; Key company market share analysis, 2023
- FIGURE Product Type segment market share analysis, 2023 & 2032
- FIGURE Product Type segment market size forecast and trend analysis, 2019 to 2032 (USD Million)
- FIGURE Technology segment market share analysis, 2023 & 2032
- FIGURE Technology segment market size forecast and trend analysis, 2019 to 2032 (USD Million)
- FIGURE Application segment market share analysis, 2023 & 2032
- FIGURE Application segment market size forecast and trend analysis, 2019 to 2032 (USD Million)
- FIGURE End-Use segment market share analysis, 2023 & 2032
- FIGURE End-Use segment market size forecast and trend analysis, 2019 to 2032 (USD Million)
- FIGURE Regional segment market share analysis, 2023 & 2032
- FIGURE Regional segment market size forecast and trend analysis, 2019 to 2032 (USD Million)
- FIGURE North America Cell Sorting Market share and leading players, 2023
- FIGURE Europe Cell Sorting Market share and leading players, 2023
- FIGURE Asia Pacific Cell Sorting Market share and leading players, 2023
- FIGURE Latin America Cell Sorting Market share and leading players, 2023
- FIGURE Middle East and Africa Cell Sorting Market share and leading players, 2023
- FIGURE North America market share analysis by country, 2023
- FIGURE U.S. Cell Sorting Market size, forecast and trend analysis, 2019 to 2032 (USD Million)
- FIGURE Canada Cell Sorting Market size, forecast and trend analysis, 2019 to 2032 (USD Million)
- FIGURE Europe Cell Sorting Market share analysis by country, 2023
- FIGURE Germany Cell Sorting Market size, forecast and trend analysis, 2019 to 2032 (USD Million)
- FIGURE Spain Cell Sorting Market size, forecast and trend analysis, 2019 to 2032 (USD Million)
- FIGURE Italy Cell Sorting Market size, forecast and trend analysis, 2019 to 2032 (USD Million)
- FIGURE France Cell Sorting Market size, forecast and trend analysis, 2019 to 2032 (USD Million)
- FIGURE UK Cell Sorting Market size, forecast and trend analysis, 2019 to 2032 (USD Million)
- FIGURE Russia Cell Sorting Market size, forecast and trend analysis, 2019 to 2032 (USD Million)
- FIGURE Netherlands Cell Sorting Market size, forecast and trend analysis, 2019 to 2032 (USD Million)
- FIGURE Sweden Cell Sorting Market size, forecast and trend analysis, 2019 to 2032 (USD Million)
- FIGURE Poland Cell Sorting Market size, forecast and trend analysis, 2019 to 2032 (USD Million)
- FIGURE Rest of the Europe Cell Sorting Market size, forecast and trend analysis, 2019 to 2032 (USD Million)
- FIGURE Asia Pacific Cell Sorting Market share analysis by country, 2023
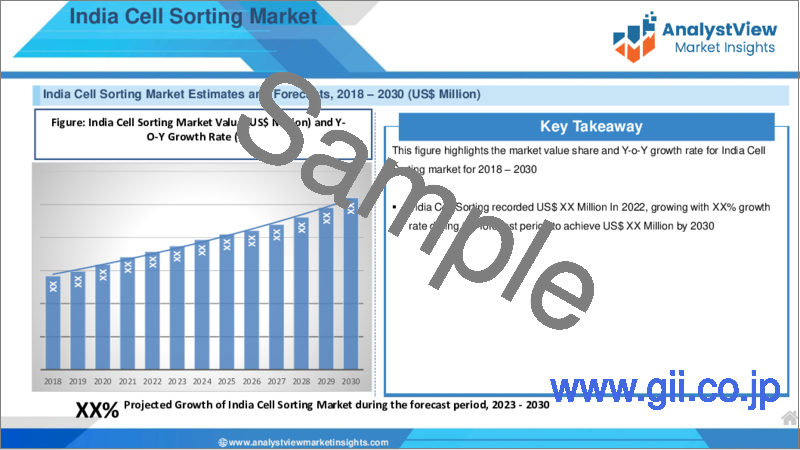
- FIGURE India Cell Sorting Market size, forecast and trend analysis, 2019 to 2032 (USD Million)
- FIGURE China Cell Sorting Market size, forecast and trend analysis, 2019 to 2032 (USD Million)
- FIGURE Japan Cell Sorting Market size, forecast and trend analysis, 2019 to 2032 (USD Million)
- FIGURE South Korea Cell Sorting Market size, forecast and trend analysis, 2019 to 2032 (USD Million)
- FIGURE Australia Cell Sorting Market size, forecast and trend analysis, 2019 to 2032 (USD Million)
- FIGURE Thailand Cell Sorting Market size, forecast and trend analysis, 2019 to 2032 (USD Million)
- FIGURE Indonesia Cell Sorting Market size, forecast and trend analysis, 2019 to 2032 (USD Million)
- FIGURE Phillipines Cell Sorting Market size, forecast and trend analysis, 2019 to 2032 (USD Million)
- FIGURE Rest of APAC Cell Sorting Market size, forecast and trend analysis, 2019 to 2032 (USD Million)
- FIGURE Latin America Cell Sorting Market size, forecast and trend analysis, 2019 to 2032 (USD Million)
- FIGURE Latin America Cell Sorting Market share analysis by country, 2023
- FIGURE Brazil Cell Sorting Market size, forecast and trend analysis, 2019 to 2032 (USD Million)
- FIGURE Mexico Cell Sorting Market size, forecast and trend analysis, 2019 to 2032 (USD Million)
- FIGURE Argentina Cell Sorting Market size, forecast and trend analysis, 2019 to 2032 (USD Million)
- FIGURE Colombia Cell Sorting Market size, forecast and trend analysis, 2019 to 2032 (USD Million)
- FIGURE Rest of LATAM Cell Sorting Market size, forecast and trend analysis, 2019 to 2032 (USD Million)
- FIGURE Middle East and Africa Cell Sorting Market size, forecast and trend analysis, 2019 to 2032 (USD Million)
- FIGURE Middle East and Africa Cell Sorting Market share analysis by country, 2023
- FIGURE Saudi Arabia Cell Sorting Market size, forecast and trend analysis, 2019 to 2032 (USD Million)
- FIGURE United Arab Emirates Cell Sorting Market size, forecast and trend analysis, 2019 to 2032 (USD Million)
- FIGURE Israel Cell Sorting Market size, forecast and trend analysis, 2019 to 2032 (USD Million)
- FIGURE Turkey Cell Sorting Market size, forecast and trend analysis, 2019 to 2032 (USD Million)
- FIGURE Algeria Cell Sorting Market size, forecast and trend analysis, 2019 to 2032 (USD Million)
- FIGURE Egypt Cell Sorting Market size, forecast and trend analysis, 2019 to 2032 (USD Million)
- FIGURE Rest of MEA Cell Sorting Market size, forecast and trend analysis, 2019 to 2032 (USD Million)
REPORT HIGHLIGHT
Cell Sorting Market size was valued at USD 945.67 Million in 2023, expanding at a CAGR of 10.5% from 2024 to 2032.
Sorting cells is a process that involves removing cells from an organism and classifying the cells according to their form. To indicate areas of interest and their impact, the cells are labeled in addition to being marked. Variations in cell size, surface protein expression, and morphology (shape) are used to divide the cells. There are several uses for sorting a heterogeneous combination of biological cells in biotechnology and biopharmaceuticals.
Cell Sorting Market- Market Dynamics
Growing prevalence of chronic disease to propel market demand
The demand for cell-based therapeutics has grown as chronic illnesses like cancer and diabetes become more common. Cell sorting technology is essential to comprehending these illnesses and developing novel therapies for them. Through the process of cell sorting, medical professionals and scientists may distinguish certain cells from a variety of cell types, providing them with more insights into disease causes, immunological markers, and the development of tailored therapies. Personalized medical techniques and more potent therapies may result from a better understanding of these interconnections. Personalized therapy techniques or biomarker identification can be achieved by isolating particular cell populations using cell sorting. These populations can then be further defined and evaluated. Globally increasing rates of chronic illness are driving up demand for cellular-based treatments including immunotherapies and stem cell therapy. To assure the safety and efficacy of the final cell-based products, cell sorting technology enables the separation and enrichment of certain cell types for use in these therapies. Therefore, throughout the projected period, the worldwide cell sorting market would rise at a faster rate because of the increased demand for cell-based treatments brought on by the increasing incidence of chronic illnesses.
Cell Sorting Market- Key Insights
- As per the analysis shared by our research analyst, the global market is estimated to grow annually at a CAGR of around 10.5% over the forecast period (2024-2032)
- Based on technology segmentation, the Fluorescence-based Droplet Cell Sorting segment is expected to dominate the market during the forecast period
- Based on end-use segmentation, the research institutions segment is expected to grow at the fastest rate over the forecast period
- Based on region, North America is expected to dominate the market during the forecast period
Cell Sorting Market- Segmentation Analysis:
- The Global Cell Sorting Market is segmented based on Product Type, Technology, Application, End-Use, and Region.
- Based on the technology, the global market is divided into Magnetic-activated Cell Sorting, Fluorescence-based Droplet Cell Sorting and MEMS - Microfluidics. The Fluorescence-based Droplet Cell Sorting segment is expected to dominate the market during the forecast period because it is a very exact and accurate sorting process. It is crucial for many scientific tests that call for single-cell sorting and high-throughput analysis. For this application, fluorescence-activated cell sorting (FACS) is the gold standard technology. It offers a way to filter a mixture of living cells in two or more vessels, one cell at a time, according to the fluorescence and light-scattering properties of each cell. It is a practical scientific instrument that allows for the quick, deliberate, and balanced recording of fluorescence signals from individual cells and the identification of particular cells of interest inside the body. Thereby, driving the segment growth.
- Based on the end-use, the market is segmented into Medical Schools and Academic Institutions, Research Institutions, Pharmaceutical and Biotechnology Companies and Hospitals and Clinical Testing Laboratories. The Research Institutions segment is expected to grow at the fastest rate over the forecast period due to the increase in cellular analysis research efforts.
Cell Sorting Market- Geographical Insights
Geographically, this market is widespread in the regions of North America, Latin America, Europe, Asia Pacific, and the Middle East and Africa. These regions are further divided as per the nations bringing business. North America is expected to dominate the market during the forecast period due to the large investments in the pharmaceutical and biotechnology sectors and the rising usage of this approach in cancer research, as well as the development of novel treatments in nations such as the United States. Regional expansion is also fueled by the nation's growing rates of infectious illnesses and cancer. The country saw 15.5 million visits to doctor's offices in 2021 with the primary diagnosis of infectious and parasitic disorders, according to the Centers for Disease Control and Prevention. The rising prevalence of cell-sorting disorders and cancer, together with rising healthcare costs nationwide, are driving up market expansion in the area.
Cell Sorting Market- Competitive Landscape:
The key players operating in the market are: Thermo Fisher Scientific Inc., Sony Biotechnology Inc., Miltenyi Biotec, Union Biometrica, Inc., STEMCELL Technologies Inc., TERUMO BCT, INC., Abgenex, Sysmex Europe GmbH, Sepmag, NanoCellect Biomedical, BD, Bio-Rad Laboratories, Inc., Cytonome/ST, LLC, On-chip Biotechnologies Co., Ltd. Corporation, Beckman Coulter, Inc., Luminex Corporation, pluriSelect Life Science UG (haftungsbeschrankt) & Co. KG, Bay bioscience Co., Ltd. and Cellular Highways among others. These players perform various strategies to capture a major market share. Strategies like merger & acquisition, agreement, collaboration, product launches and others.
Recent Developments:
In October 2023, Sony Corporation announced the release of the FP7000 spectral cell sorter, which uses fluidics, sophisticated electronics, and unique spectral technology to provide high-speed, high-parameter sorting with over 44 colors and straightforward processes.
SCOPE OF THE REPORT
The scope of this report covers the market by its major segments, which include as follows:
GLOBAL CELL SORTING MARKET KEY PLAYERS- DETAILED COMPETITIVE INSIGHTS
- Thermo Fisher Scientific Inc.
- Sony Biotechnology Inc.
- Miltenyi Biotec
- Union Biometrica, Inc.
- STEMCELL Technologies Inc.
- TERUMO BCT, INC.
- Abgenex
- Sysmex Europe GmbH
- Sepmag
- NanoCellect Biomedical
- BD
- Bio-Rad Laboratories, Inc.
- Cytonome/ST, LLC
- On-chip Biotechnologies Co., Ltd.
- Beckman Coulter, Inc.
- Luminex Corporation
GLOBAL CELL SORTING MARKET, BY PRODUCT TYPE- MARKET ANALYSIS, 2019 - 2032
- Reagents and Consumables
- Cell Sorters
- Services
GLOBAL CELL SORTING MARKET, BY TECHNOLOGY- MARKET ANALYSIS, 2019 - 2032
- Magnetic-activated Cell Sorting
- Fluorescence-based Droplet Cell Sorting
- MEMS - Microfluidics
GLOBAL CELL SORTING MARKET, BY APPLICATION- MARKET ANALYSIS, 2019 - 2032
- Clinical
- Research
GLOBAL CELL SORTING MARKET, BY END-USE- MARKET ANALYSIS, 2019 - 2032
- Medical Schools and Academic Institutions
- Research Institutions
- Pharmaceutical and Biotechnology Companies
- Hospitals and Clinical Testing Laboratories
GLOBAL CELL SORTING MARKET, BY REGION- MARKET ANALYSIS, 2019 - 2032
- North America
- The U.S.
- Canada
- Europe
- Germany
- France
- Italy
- Spain
- United Kingdom
- Russia
- Netherlands
- Sweden
- Poland
- Rest of Europe
- Asia Pacific
- India
- China
- South Korea
- Japan
- Australia
- Thailand
- Indonesia
- Philippines
- Rest of APAC
- Latin America
- Brazil
- Mexico
- Argentina
- Colombia
- Rest of LATAM
- The Middle East and Africa
- Saudi Arabia
- United Arab Emirates
- Israel
- Turkey
- Algeria
- Egypt
- Rest of MEA
Table of Contents
1. Cell Sorting Market Overview
- 1.1. Study Scope
- 1.2. Market Estimation Years
2. Executive Summary
- 2.1. Market Snippet
- 2.1.1. Cell Sorting Market Snippet by Product Type
- 2.1.2. Cell Sorting Market Snippet by Technology
- 2.1.3. Cell Sorting Market Snippet by Application
- 2.1.4. Cell Sorting Market Snippet by End-Use
- 2.1.5. Cell Sorting Market Snippet by Country
- 2.1.6. Cell Sorting Market Snippet by Region
- 2.2. Competitive Insights
3. Cell Sorting Key Market Trends
- 3.1. Cell Sorting Market Drivers
- 3.1.1. Impact Analysis of Market Drivers
- 3.2. Cell Sorting Market Restraints
- 3.2.1. Impact Analysis of Market Restraints
- 3.3. Cell Sorting Market Opportunities
- 3.4. Cell Sorting Market Future Trends
4. Cell Sorting Industry Study
- 4.1. PEST Analysis
- 4.2. Porter's Five Forces Analysis
- 4.3. Growth Prospect Mapping
- 4.4. Regulatory Framework Analysis
5. Cell Sorting Market: COVID-19 Impact Analysis
- 5.1. Pre-COVID-19 Impact Analysis
- 5.2. Post-COVID-19 Impact Analysis
- 5.2.1. Top Performing Segments
- 5.2.2. Marginal Growth Segments
- 5.2.3. Top Looser Segments
- 5.2.4. Marginal Loss Segments
6. Cell Sorting Market Landscape
- 6.1. Cell Sorting Market Share Analysis, 2023
- 6.2. Breakdown Data, by Key Manufacturer
- 6.2.1. Established Players' Analysis
- 6.2.2. Emerging Players' Analysis
7. Cell Sorting Market - By Product Type
- 7.1. Overview
- 7.1.1. Segment Share Analysis, By Product Type, 2023 & 2032 (%)
- 7.1.2. Reagents and Consumables
- 7.1.3. Cell Sorters
- 7.1.4. Services
8. Cell Sorting Market - By Technology
- 8.1. Overview
- 8.1.1. Segment Share Analysis, By Technology, 2023 & 2032 (%)
- 8.1.2. Magnetic-activated Cell Sorting
- 8.1.3. Fluorescence-based Droplet Cell Sorting
- 8.1.4. MEMS - Microfluidics
9. Cell Sorting Market - By Application
- 9.1. Overview
- 9.1.1. Segment Share Analysis, By Application, 2023 & 2032 (%)
- 9.1.2. Clinical
- 9.1.3. Research
10. Cell Sorting Market - By End-Use
- 10.1. Overview
- 10.1.1. Segment Share Analysis, By End-Use, 2023 & 2032 (%)
- 10.1.2. Medical Schools and Academic Institutions
- 10.1.3. Research Institutions
- 10.1.4. Pharmaceutical and Biotechnology Companies
- 10.1.5. Hospitals and Clinical Testing Laboratories
11. Cell Sorting Market- By Geography
- 11.1. Introduction
- 11.1.1. Segment Share Analysis, By Geography, 2023 & 2032 (%)
- 11.2. North America
- 11.2.1. Overview
- 11.2.2. Cell Sorting Key Manufacturers in North America
- 11.2.3. North America Market Size and Forecast, By Country, 2019 - 2032 (US$ Million)
- 11.2.4. North America Market Size and Forecast, By Product Type, 2019 - 2032 (US$ Million)
- 11.2.5. North America Market Size and Forecast, By Technology, 2019 - 2032 (US$ Million)
- 11.2.6. North America Market Size and Forecast, By Application, 2019 - 2032 (US$ Million)
- 11.2.7. North America Market Size and Forecast, By End-Use, 2019 - 2032 (US$ Million)
- 11.2.8. U.S.
- 11.2.8.1. Overview
- 11.2.8.2. Market Analysis, Forecast, and Y-O-Y Growth Rate, 2019 - 2032, (US$ Million)
- 11.2.8.3. U.S. Market Size and Forecast, By Product Type, 2019 - 2032 (US$ Million)
- 11.2.8.4. U.S. Market Size and Forecast, By Technology, 2019 - 2032 (US$ Million)
- 11.2.8.5. U.S. Market Size and Forecast, By Application, 2019 - 2032 (US$ Million)
- 11.2.8.6. U.S. Market Size and Forecast, By End-Use, 2019 - 2032 (US$ Million)
- 11.2.9. Canada
- 11.2.9.1. Overview
- 11.2.9.2. Market Analysis, Forecast, and Y-O-Y Growth Rate, 2019 - 2032, (US$ Million)
- 11.2.9.3. Canada Market Size and Forecast, By Product Type, 2019 - 2032 (US$ Million)
- 11.2.9.4. Canada Market Size and Forecast, By Technology, 2019 - 2032 (US$ Million)
- 11.2.9.5. Canada Market Size and Forecast, By Application, 2019 - 2032 (US$ Million)
- 11.2.9.6. Canada Market Size and Forecast, By End-Use, 2019 - 2032 (US$ Million)
- 11.3. Europe
- 11.3.1. Overview
- 11.3.2. Cell Sorting Key Manufacturers in Europe
- 11.3.3. Europe Market Size and Forecast, By Country, 2019 - 2032 (US$ Million)
- 11.3.4. Europe Market Size and Forecast, By Product Type, 2019 - 2032 (US$ Million)
- 11.3.5. Europe Market Size and Forecast, By Technology, 2019 - 2032 (US$ Million)
- 11.3.6. Europe Market Size and Forecast, By Application, 2019 - 2032 (US$ Million)
- 11.3.7. Europe Market Size and Forecast, By End-Use, 2019 - 2032 (US$ Million)
- 11.3.8. Germany
- 11.3.8.1. Overview
- 11.3.8.2. Market Analysis, Forecast, and Y-O-Y Growth Rate, 2019 - 2032, (US$ Million)
- 11.3.8.3. Germany Market Size and Forecast, By Product Type, 2019 - 2032 (US$ Million)
- 11.3.8.4. Germany Market Size and Forecast, By Technology, 2019 - 2032 (US$ Million)
- 11.3.8.5. Germany Market Size and Forecast, By Application, 2019 - 2032 (US$ Million)
- 11.3.8.6. Germany Market Size and Forecast, By End-Use, 2019 - 2032 (US$ Million)
- 11.3.9. Italy
- 11.3.9.1. Overview
- 11.3.9.2. Market Analysis, Forecast, and Y-O-Y Growth Rate, 2019 - 2032, (US$ Million)
- 11.3.9.3. Italy Market Size and Forecast, By Product Type, 2019 - 2032 (US$ Million)
- 11.3.9.4. Italy Market Size and Forecast, By Technology, 2019 - 2032 (US$ Million)
- 11.3.9.5. Italy Market Size and Forecast, By Application, 2019 - 2032 (US$ Million)
- 11.3.9.6. Italy Market Size and Forecast, By End-Use, 2019 - 2032 (US$ Million)
- 11.3.10. United Kingdom
- 11.3.10.1. Overview
- 11.3.10.2. Market Analysis, Forecast, and Y-O-Y Growth Rate, 2019 - 2032, (US$ Million)
- 11.3.10.3. United Kingdom Market Size and Forecast, By Product Type, 2019 - 2032 (US$ Million)
- 11.3.10.4. United Kingdom Market Size and Forecast, By Technology, 2019 - 2032 (US$ Million)
- 11.3.10.5. United Kingdom Market Size and Forecast, By Application, 2019 - 2032 (US$ Million)
- 11.3.10.6. United Kingdom Market Size and Forecast, By End-Use, 2019 - 2032 (US$ Million)
- 11.3.11. France
- 11.3.11.1. Overview
- 11.3.11.2. Market Analysis, Forecast, and Y-O-Y Growth Rate, 2019 - 2032, (US$ Million)
- 11.3.11.3. France Market Size and Forecast, By Product Type, 2019 - 2032 (US$ Million)
- 11.3.11.4. France Market Size and Forecast, By Technology, 2019 - 2032 (US$ Million)
- 11.3.11.5. France Market Size and Forecast, By Application, 2019 - 2032 (US$ Million)
- 11.3.11.6. France Market Size and Forecast, By End-Use, 2019 - 2032 (US$ Million)
- 11.3.12. Russia
- 11.3.12.1. Market Analysis, Forecast, and Y-O-Y Growth Rate, 2019 - 2032, (US$ Million)
- 11.3.12.2. Russia Market Size and Forecast, By Product Type, 2019 - 2032 (US$ Million)
- 11.3.12.3. Russia Market Size and Forecast, By Technology, 2019 - 2032 (US$ Million)
- 11.3.12.4. Russia Market Size and Forecast, By Application, 2019 - 2032 (US$ Million)
- 11.3.12.5. Russia Market Size and Forecast, By End-Use, 2019 - 2032 (US$ Million)
- 11.3.13. Netherlands
- 11.3.13.1. Market Analysis, Forecast, and Y-O-Y Growth Rate, 2019 - 2032, (US$ Million)
- 11.3.13.2. Netherlands Market Size and Forecast, By Product Type, 2019 - 2032 (US$ Million)
- 11.3.13.3. Netherlands Market Size and Forecast, By Technology, 2019 - 2032 (US$ Million)
- 11.3.13.4. Netherlands Market Size and Forecast, By Application, 2019 - 2032 (US$ Million)
- 11.3.13.5. Netherlands Market Size and Forecast, By End-Use, 2019 - 2032 (US$ Million)
- 11.3.14. Sweden
- 11.3.14.1. Market Analysis, Forecast, and Y-O-Y Growth Rate, 2019 - 2032, (US$ Million)
- 11.3.14.2. Sweden Market Size and Forecast, By Product Type, 2019 - 2032 (US$ Million)
- 11.3.14.3. Sweden Market Size and Forecast, By Technology, 2019 - 2032 (US$ Million)
- 11.3.14.4. Sweden Market Size and Forecast, By Application, 2019 - 2032 (US$ Million)
- 11.3.14.5. Sweden Market Size and Forecast, By End-Use, 2019 - 2032 (US$ Million)
- 11.3.15. Poland
- 11.3.15.1. Market Analysis, Forecast, and Y-O-Y Growth Rate, 2019 - 2032, (US$ Million)
- 11.3.15.2. Poland Market Size and Forecast, By Product Type, 2019 - 2032 (US$ Million)
- 11.3.15.3. Poland Market Size and Forecast, By Technology, 2019 - 2032 (US$ Million)
- 11.3.15.4. Poland Market Size and Forecast, By Application, 2019 - 2032 (US$ Million)
- 11.3.15.5. Poland Market Size and Forecast, By End-Use, 2019 - 2032 (US$ Million)
- 11.3.16. Rest of Europe
- 11.3.16.1. Overview
- 11.3.16.2. Market Analysis, Forecast, and Y-O-Y Growth Rate, 2019 - 2032, (US$ Million)
- 11.3.16.3. Rest of the Europe Market Size and Forecast, By Product Type, 2019 - 2032 (US$ Million)
- 11.3.16.4. Rest of the Europe Market Size and Forecast, By Technology, 2019 - 2032 (US$ Million)
- 11.3.16.5. Rest of the Europe Market Size and Forecast, By Application, 2019 - 2032 (US$ Million)
- 11.3.16.6. Rest of the Europe Market Size and Forecast, By End-Use, 2019 - 2032 (US$ Million)
- 11.4. Asia Pacific (APAC)
- 11.4.1. Overview
- 11.4.2. Cell Sorting Key Manufacturers in Asia Pacific
- 11.4.3. Asia Pacific Market Size and Forecast, By Country, 2019 - 2032 (US$ Million)
- 11.4.4. Asia Pacific Market Size and Forecast, By Product Type, 2019 - 2032 (US$ Million)
- 11.4.5. Asia Pacific Market Size and Forecast, By Technology, 2019 - 2032 (US$ Million)
- 11.4.6. Asia Pacific Market Size and Forecast, By Application, 2019 - 2032 (US$ Million)
- 11.4.7. Asia Pacific Market Size and Forecast, By End-Use, 2019 - 2032 (US$ Million)
- 11.4.8. India
- 11.4.8.1. Overview
- 11.4.8.2. Market Analysis, Forecast, and Y-O-Y Growth Rate, 2019 - 2032, (US$ Million)
- 11.4.8.3. India Market Size and Forecast, By Product Type, 2019 - 2032 (US$ Million)
- 11.4.8.4. India Market Size and Forecast, By Technology, 2019 - 2032 (US$ Million)
- 11.4.8.5. India Market Size and Forecast, By Application, 2019 - 2032 (US$ Million)
- 11.4.8.6. India Market Size and Forecast, By End-Use, 2019 - 2032 (US$ Million)
- 11.4.9. China
- 11.4.9.1. Overview
- 11.4.9.2. Market Analysis, Forecast, and Y-O-Y Growth Rate, 2019 - 2032, (US$ Million)
- 11.4.9.3. China Market Size and Forecast, By Product Type, 2019 - 2032 (US$ Million)
- 11.4.9.4. China Market Size and Forecast, By Technology, 2019 - 2032 (US$ Million)
- 11.4.9.5. China Market Size and Forecast, By Application, 2019 - 2032 (US$ Million)
- 11.4.9.6. China Market Size and Forecast, By End-Use, 2019 - 2032 (US$ Million)
- 11.4.10. Japan
- 11.4.10.1. Overview
- 11.4.10.2. Market Analysis, Forecast, and Y-O-Y Growth Rate, 2019 - 2032, (US$ Million)
- 11.4.10.3. Japan Market Size and Forecast, By Product Type, 2019 - 2032 (US$ Million)
- 11.4.10.4. Japan Market Size and Forecast, By Technology, 2019 - 2032 (US$ Million)
- 11.4.10.5. Japan Market Size and Forecast, By Application, 2019 - 2032 (US$ Million)
- 11.4.10.6. Japan Market Size and Forecast, By End-Use, 2019 - 2032 (US$ Million)
- 11.4.11. South Korea
- 11.4.11.1. Overview
- 11.4.11.2. Market Analysis, Forecast, and Y-O-Y Growth Rate, 2019 - 2032, (US$ Million)
- 11.4.11.3. South Korea Market Size and Forecast, By Product Type, 2019 - 2032 (US$ Million)
- 11.4.11.4. South Korea Market Size and Forecast, By Technology, 2019 - 2032 (US$ Million)
- 11.4.11.5. South Korea Market Size and Forecast, By Application, 2019 - 2032 (US$ Million)
- 11.4.11.6. South Korea Market Size and Forecast, By End-Use, 2019 - 2032 (US$ Million)
- 11.4.12. Australia
- 11.4.12.1. Overview
- 11.4.12.2. Market Analysis, Forecast, and Y-O-Y Growth Rate, 2019 - 2032, (US$ Million)
- 11.4.12.3. Australia Market Size and Forecast, By Product Type, 2019 - 2032 (US$ Million)
- 11.4.12.4. Australia Market Size and Forecast, By Technology, 2019 - 2032 (US$ Million)
- 11.4.12.5. Australia Market Size and Forecast, By Application, 2019 - 2032 (US$ Million)
- 11.4.12.6. Australia Market Size and Forecast, By End-Use, 2019 - 2032 (US$ Million)
- 11.4.13. Thailand
- 11.4.13.1. Overview
- 11.4.13.2. Market Analysis, Forecast, and Y-O-Y Growth Rate, 2019 - 2032, (US$ Million)
- 11.4.13.3. Thailand Market Size and Forecast, By Product Type, 2019 - 2032 (US$ Million)
- 11.4.13.4. Thailand Market Size and Forecast, By Technology, 2019 - 2032 (US$ Million)
- 11.4.13.5. Thailand Market Size and Forecast, By Application, 2019 - 2032 (US$ Million)
- 11.4.13.6. Thailand Market Size and Forecast, By End-Use, 2019 - 2032 (US$ Million)
- 11.4.14. Indonesia
- 11.4.14.1. Overview
- 11.4.14.2. Market Analysis, Forecast, and Y-O-Y Growth Rate, 2019 - 2032, (US$ Million)
- 11.4.14.3. Indonesia Market Size and Forecast, By Product Type, 2019 - 2032 (US$ Million)
- 11.4.14.4. Indonesia Market Size and Forecast, By Technology, 2019 - 2032 (US$ Million)
- 11.4.14.5. Indonesia Market Size and Forecast, By Application, 2019 - 2032 (US$ Million)
- 11.4.14.6. Indonesia Market Size and Forecast, By End-Use, 2019 - 2032 (US$ Million)
- 11.4.15. Philippines
- 11.4.15.1. Overview
- 11.4.15.2. Market Analysis, Forecast, and Y-O-Y Growth Rate, 2019 - 2032, (US$ Million)
- 11.4.15.3. Philippines Market Size and Forecast, By Product Type, 2019 - 2032 (US$ Million)
- 11.4.15.4. Philippines Market Size and Forecast, By Technology, 2019 - 2032 (US$ Million)
- 11.4.15.5. Philippines Market Size and Forecast, By Application, 2019 - 2032 (US$ Million)
- 11.4.15.6. Philippines Market Size and Forecast, By End-Use, 2019 - 2032 (US$ Million)
- 11.4.16. Rest of APAC
- 11.4.16.1. Overview
- 11.4.16.2. Market Analysis, Forecast, and Y-O-Y Growth Rate, 2019 - 2032, (US$ Million)
- 11.4.16.3. Rest of APAC Market Size and Forecast, By Product Type, 2019 - 2032 (US$ Million)
- 11.4.16.4. Rest of APAC Market Size and Forecast, By Technology, 2019 - 2032 (US$ Million)
- 11.4.16.5. Rest of APAC Market Size and Forecast, By Application, 2019 - 2032 (US$ Million)
- 11.4.16.6. Rest of APAC Market Size and Forecast, By End-Use, 2019 - 2032 (US$ Million)
- 11.5. Latin America
- 11.5.1. Overview
- 11.5.2. Cell Sorting Key Manufacturers in Latin America
- 11.5.3. Latin America Market Size and Forecast, By Country, 2019 - 2032 (US$ Million)
- 11.5.4. Latin America Market Size and Forecast, By Product Type, 2019 - 2032 (US$ Million)
- 11.5.5. Latin America Market Size and Forecast, By Technology, 2019 - 2032 (US$ Million)
- 11.5.6. Latin America Market Size and Forecast, By Application, 2019 - 2032 (US$ Million)
- 11.5.7. Latin America Market Size and Forecast, By End-Use, 2019 - 2032 (US$ Million)
- 11.5.8. Brazil
- 11.5.8.1. Overview
- 11.5.8.2. Market Analysis, Forecast, and Y-O-Y Growth Rate, 2019 - 2032, (US$ Million)
- 11.5.8.3. Brazil Market Size and Forecast, By Product Type, 2019 - 2032 (US$ Million)
- 11.5.8.4. Brazil Market Size and Forecast, By Technology, 2019 - 2032 (US$ Million)
- 11.5.8.5. Brazil Market Size and Forecast, By Application, 2019 - 2032 (US$ Million)
- 11.5.8.6. Brazil Market Size and Forecast, By End-Use, 2019 - 2032 (US$ Million)
- 11.5.9. Mexico
- 11.5.9.1. Overview
- 11.5.9.2. Market Analysis, Forecast, and Y-O-Y Growth Rate, 2019 - 2032, (US$ Million)
- 11.5.9.3. Mexico Market Size and Forecast, By Product Type, 2019 - 2032 (US$ Million)
- 11.5.9.4. Mexico Market Size and Forecast, By Technology, 2019 - 2032 (US$ Million)
- 11.5.9.5. Mexico Market Size and Forecast, By Application, 2019 - 2032 (US$ Million)
- 11.5.9.6. Mexico Market Size and Forecast, By End-Use, 2019 - 2032 (US$ Million)
- 11.5.10. Argentina
- 11.5.10.1. Overview
- 11.5.10.2. Market Analysis, Forecast, and Y-O-Y Growth Rate, 2019 - 2032, (US$ Million)
- 11.5.10.3. Argentina Market Size and Forecast, By Product Type, 2019 - 2032 (US$ Million)
- 11.5.10.4. Argentina Market Size and Forecast, By Technology, 2019 - 2032 (US$ Million)
- 11.5.10.5. Argentina Market Size and Forecast, By Application, 2019 - 2032 (US$ Million)
- 11.5.10.6. Argentina Market Size and Forecast, By End-Use, 2019 - 2032 (US$ Million)
- 11.5.11. Colombia
- 11.5.11.1. Overview
- 11.5.11.2. Market Analysis, Forecast, and Y-O-Y Growth Rate, 2019 - 2032, (US$ Million)
- 11.5.11.3. Colombia Market Size and Forecast, By Product Type, 2019 - 2032 (US$ Million)
- 11.5.11.4. Colombia Market Size and Forecast, By Technology, 2019 - 2032 (US$ Million)
- 11.5.11.5. Colombia Market Size and Forecast, By Application, 2019 - 2032 (US$ Million)
- 11.5.11.6. Colombia Market Size and Forecast, By End-Use, 2019 - 2032 (US$ Million)
- 11.5.12. Rest of LATAM
- 11.5.12.1. Overview
- 11.5.12.2. Market Analysis, Forecast, and Y-O-Y Growth Rate, 2019 - 2032, (US$ Million)
- 11.5.12.3. Rest of LATAM Market Size and Forecast, By Product Type, 2019 - 2032 (US$ Million)
- 11.5.12.4. Rest of LATAM Market Size and Forecast, By Technology, 2019 - 2032 (US$ Million)
- 11.5.12.5. Rest of LATAM Market Size and Forecast, By Application, 2019 - 2032 (US$ Million)
- 11.5.12.6. Rest of LATAM Market Size and Forecast, By End-Use, 2019 - 2032 (US$ Million)
- 11.6. Middle East and Africa
- 11.6.1. Overview
- 11.6.2. Cell Sorting Key Manufacturers in Middle East and Africa
- 11.6.3. Middle East and Africa Market Size and Forecast, By Country, 2019 - 2032 (US$ Million)
- 11.6.4. Middle East and Africa Market Size and Forecast, By Product Type, 2019 - 2032 (US$ Million)
- 11.6.5. Middle East and Africa Market Size and Forecast, By Technology, 2019 - 2032 (US$ Million)
- 11.6.6. Middle East and Africa Market Size and Forecast, By Application, 2019 - 2032 (US$ Million)
- 11.6.7. Middle East and Africa Market Size and Forecast, By End-Use, 2019 - 2032 (US$ Million)
- 11.6.8. Saudi Arabia
- 11.6.8.1. Overview
- 11.6.8.2. Market Analysis, Forecast, and Y-O-Y Growth Rate, 2019 - 2032, (US$ Million)
- 11.6.8.3. Saudi Arabia Market Size and Forecast, By Product Type, 2019 - 2032 (US$ Million)
- 11.6.8.4. Saudi Arabia Market Size and Forecast, By Technology, 2019 - 2032 (US$ Million)
- 11.6.8.5. Saudi Arabia Market Size and Forecast, By Application, 2019 - 2032 (US$ Million)
- 11.6.8.6. Saudi Arabia Market Size and Forecast, By End-Use, 2019 - 2032 (US$ Million)
- 11.6.9. United Arab Emirates
- 11.6.9.1. Overview
- 11.6.9.2. Market Analysis, Forecast, and Y-O-Y Growth Rate, 2019 - 2032, (US$ Million)
- 11.6.9.3. United Arab Emirates Market Size and Forecast, By Product Type, 2019 - 2032 (US$ Million)
- 11.6.9.4. United Arab Emirates Market Size and Forecast, By Technology, 2019 - 2032 (US$ Million)
- 11.6.9.5. United Arab Emirates Market Size and Forecast, By Application, 2019 - 2032 (US$ Million)
- 11.6.9.6. United Arab Emirates Market Size and Forecast, By End-Use, 2019 - 2032 (US$ Million)
- 11.6.10. Israel
- 11.6.10.1. Overview
- 11.6.10.2. Market Analysis, Forecast, and Y-O-Y Growth Rate, 2019 - 2032, (US$ Million)
- 11.6.10.3. Israel Market Size and Forecast, By Product Type, 2019 - 2032 (US$ Million)
- 11.6.10.4. Israel Market Size and Forecast, By Technology, 2019 - 2032 (US$ Million)
- 11.6.10.5. Israel Market Size and Forecast, By Application, 2019 - 2032 (US$ Million)
- 11.6.10.6. Israel Market Size and Forecast, By End-Use, 2019 - 2032 (US$ Million)
- 11.6.11. Turkey
- 11.6.11.1. Overview
- 11.6.11.2. Market Analysis, Forecast, and Y-O-Y Growth Rate, 2019 - 2032, (US$ Million)
- 11.6.11.3. Turkey Market Size and Forecast, By Product Type, 2019 - 2032 (US$ Million)
- 11.6.11.4. Turkey Market Size and Forecast, By Technology, 2019 - 2032 (US$ Million)
- 11.6.11.5. Turkey Market Size and Forecast, By Application, 2019 - 2032 (US$ Million)
- 11.6.11.6. Turkey Market Size and Forecast, By End-Use, 2019 - 2032 (US$ Million)
- 11.6.12. Algeria
- 11.6.12.1. Overview
- 11.6.12.2. Market Analysis, Forecast, and Y-O-Y Growth Rate, 2019 - 2032, (US$ Million)
- 11.6.12.3. Algeria Market Size and Forecast, By Product Type, 2019 - 2032 (US$ Million)
- 11.6.12.4. Algeria Market Size and Forecast, By Technology, 2019 - 2032 (US$ Million)
- 11.6.12.5. Algeria Market Size and Forecast, By Application, 2019 - 2032 (US$ Million)
- 11.6.12.6. Algeria Market Size and Forecast, By End-Use, 2019 - 2032 (US$ Million)
- 11.6.13. Egypt
- 11.6.13.1. Overview
- 11.6.13.2. Market Analysis, Forecast, and Y-O-Y Growth Rate, 2019 - 2032, (US$ Million)
- 11.6.13.3. Egypt Market Size and Forecast, By Product Type, 2019 - 2032 (US$ Million)
- 11.6.13.4. Egypt Market Size and Forecast, By Technology, 2019 - 2032 (US$ Million)
- 11.6.13.5. Egypt Market Size and Forecast, By Application, 2019 - 2032 (US$ Million)
- 11.6.13.6. Egypt Market Size and Forecast, By End-Use, 2019 - 2032 (US$ Million)
- 11.6.14. Rest of MEA
- 11.6.14.1. Overview
- 11.6.14.2. Market Analysis, Forecast, and Y-O-Y Growth Rate, 2019 - 2032, (US$ Million)
- 11.6.14.3. Rest of MEA Market Size and Forecast, By Product Type, 2019 - 2032 (US$ Million)
- 11.6.14.4. Rest of MEA Market Size and Forecast, By Technology, 2019 - 2032 (US$ Million)
- 11.6.14.5. Rest of MEA Market Size and Forecast, By Application, 2019 - 2032 (US$ Million)
- 11.6.14.6. Rest of MEA Market Size and Forecast, By End-Use, 2019 - 2032 (US$ Million)
12. Key Vendor Analysis- Cell Sorting Industry
- 12.1. Competitive Dashboard
- 12.2. Company Profiles
- 12.2.1. Thermo Fisher Scientific Inc.
- 12.2.2. Sony Biotechnology Inc.
- 12.2.3. Miltenyi Biotec
- 12.2.4. Union Biometrica, Inc.
- 12.2.5. STEMCELL Technologies Inc.
- 12.2.6. TERUMO BCT, INC.
- 12.2.7. Abgenex
- 12.2.8. Sysmex Europe GmbH
- 12.2.9. Sepmag
- 12.2.10. NanoCellect Biomedical
- 12.2.11. BD
- 12.2.12. Bio-Rad Laboratories, Inc.
- 12.2.13. Cytonome/ST, LLC
- 12.2.14. On-chip Biotechnologies Co., Ltd.
- 12.2.15. Beckman Coulter, Inc.
- 12.2.16. Luminex Corporation
13. 360 Degree Analyst View
14. Appendix
- 14.1. Research Methodology
- 14.2. References
- 14.3. Abbreviations
- 14.4. Disclaimer
- 14.5. Contact Us