|
|
市場調査レポート
商品コード
1401833
自律型AIおよび自律型エージェント市場:コンポーネント別、技術別、展開タイプ別、用途別、国別、地域別- 産業分析、市場規模、市場シェア、2023-2030年予測Autonomous AI And Autonomous Agents Market, By Component, By Technology, By Deployment Type, By Application, By Country, and By Region - Industry Analysis, Market Size, Market Share & Forecast from 2023-2030 |
||||||
|
|||||||
カスタマイズ可能
|
|||||||

| 自律型AIおよび自律型エージェント市場:コンポーネント別、技術別、展開タイプ別、用途別、国別、地域別- 産業分析、市場規模、市場シェア、2023-2030年予測 |
|
出版日: 2024年01月01日
発行: AnalystView Market Insights
ページ情報: 英文 322 Pages
納期: 2~3営業日
|

全表示
- 概要
- 図表
- 目次
レポートハイライト
自律型AIおよび自律型エージェントの市場規模は2022年に40億米ドルとなり、2023年から2030年にかけてCAGR 45.4%で拡大する見込みです。
自律型AIおよび自律型エージェント市場-市場力学
業界全体におけるAI主導型ソリューションの採用拡大とデータインフラの拡大が市場成長の原動力になる見込み
多くの産業が、効率性、生産性、意思決定プロセスを改善するためにAI技術を業務に取り入れています。この動向は、データ分析に基づいて自立的に動作し、インテリジェントな意思決定を行う自律システムの必要性を反映しています。金融サービスの統計によると、2025年までに顧客とのやりとりの95%がAI主導になるとされており、AIがこの業界の将来に大きな影響を与えることが浮き彫りになっています。人工知能の統計によると、企業の35%が現在AIを使用しており、42%が将来的な導入を検討しています。産業界がデータ・インフラを拡大し続けるにつれ、利用可能なデータを効果的に活用・分析できる自律型システムのイノベーションの機会が増えると思われます。しかし、高い導入コストが市場の成長にとって課題となる可能性があることには注意が必要です。
自律型AIおよび自律型エージェント市場-主な洞察
当社のリサーチアナリストが共有した分析によると、世界市場は予測期間(2023-2030年)に約45.4%のCAGRで毎年成長すると予測されています。
市場セグメンテーションでは、ソフトウェアが2022年に最大の市場シェアを示すと予測されています。
技術セグメント別では、機械学習が2022年の主要タイプでした。
展開タイプ別では、クラウドが2022年の主要タイプでした。
用途別では、BFSIが2022年の主要タイプでした。
地域別では、北米が2022年の主要収益源でした。
自律型AIおよび自律型エージェント市場-セグメンテーション分析:
世界の自律型AIおよび自律型エージェント市場は、コンポーネント、技術、展開タイプ、用途、地域に基づいてセグメント化されます。
市場は、コンポーネントに基づいて3つのカテゴリに分かれています:ハードウェア、ソフトウェア、サービスです。市場の大部分を占めるのはソフトウェア・セグメントです。ソフトウェアは、自律システムの動作と能力を決定する上で重要な役割を果たします。これには、自律機能を促進する包括的アーキテクチャの設計とともに、意思決定、知覚、ナビゲーションのためのアルゴリズムの作成が含まれます。
市場は技術によって2つのカテゴリーに分けられる:機械学習、NLP、コンテキスト認識、コンピュータ・ビジョンです。市場の大部分を占めるのは機械学習分野です。機械学習(ML)は、明示的なプログラミングを必要とせずにシステムのパフォーマンスを向上させる重要な技術です。自律システムの領域では、機械学習アルゴリズムは、知覚、意思決定、動的環境への適応を含む様々なタスクに頻繁に採用されています。
市場は、展開タイプに基づいて2つのカテゴリーに分けられます:オンプレミスとクラウド。クラウドセグメントが市場を独占しています。クラウドベースのソリューションは、自律システムの展開と更新において柔軟性と俊敏性を提供します。これは、システムが変化に迅速に対応する必要があるダイナミックな環境では極めて重要です。
市場は用途によって2つのカテゴリーに分けられる:小売・eコマース、BFSI、IT・通信、製造、ヘルスケア・ライフサイエンス、政府・防衛、その他です。BFSI業界は市場で大きなシェアを占めています。この分野は、業務のさまざまな側面を改善するために、AIや自律型エージェントなどの自律型技術を積極的に取り入れ、導入しています。
自律型AIおよび自律型エージェント市場-地理的洞察
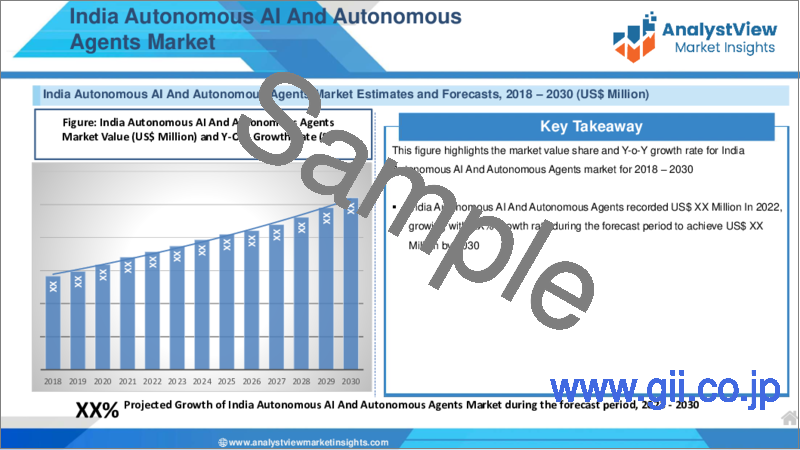
地理的に、この市場は北米、ラテンアメリカ、欧州、アジア太平洋、中東・アフリカを含む様々な地域に広がっています。これらの地域は、事業活動に関与する国に基づいてさらに分割されます。市場の成長は、主に自動化と効率化に対する需要の高まりにより、北米が支配的となることが予想されます。この動向は北米だけに限ったことではなく、自動化と効率化に対する需要は世界的に高まっています。北米の産業界は、プロセスの強化とコスト削減のためのソリューションを積極的に求めており、自律型AIとエージェントはその実現に重要な役割を果たすことができます。World of Automation Statisticsによると、米国だけでも2030年までに1兆2,000億米ドルから2兆6,000億米ドルの経済生産性が向上する可能性があります。欧州は、主にクラウド・コンピューティングの導入が拡大していることから、予測期間中、第2位の市場規模を維持しています。
自律型AIおよび自律型エージェント市場-競合情勢:
自律型AIおよび自律型エージェントは市場情勢に革命をもたらし、アプリケーションはこの変革において極めて重要な役割を果たしています。しかし、最近では自律型AIマーケティングエージェンシーの出現が大きな注目を集めています。これらのエージェンシーは、効率性と生産性を高めるために様々な分野の企業によって活用されています。この包括的な調査では、独立型AIエージェントの領域と、企業にとっての潜在的なメリットについて掘り下げています。政府、企業、ベンチャーキャピタルは自律型テクノロジーに多額の投資を行い、イノベーションと開発を促進しています。組織は、タスクを自動化し、有用な考察を生成し、ワークフローを最適化することで、競合優位性を獲得し、今日の競争の激しいマーケットで成功するための地位を確立することができます。自動運転AIエージェントの使用は、全体的な競争力だけでなく、有効性、経費節減、意思決定、柔軟性においてかなりの利益をもたらす可能性があります。このようなインテリジェント・システムの能力を活用することで、組織は新たな成長機会を引き出し、イノベーションを推進し、進化し続ける技術的展望の中で成功を収めることができます。
目次
第1章 自律型AIおよび自律型エージェント市場概要
- 調査範囲
- 市場推定年数
第2章 エグゼクティブサマリー
- 市場内訳
- 競合考察
第3章 自律型AIおよび自律型エージェントの主要な市場動向
- 市場促進要因
- 市場抑制要因
- 市場機会
- 今後の市場動向
第4章 自律型AIおよび自律型エージェントの業界調査
- PEST分析
- ポーターのファイブフォース分析
- 成長見通しのマッピング
- 規制枠組みの分析
第5章 自律型AIおよび自律型エージェント市場:COVID-19の影響分析
- 新型コロナウイルス感染症以前の影響分析
- 新型コロナウイルス感染症後の影響分析
第6章 自律型AIおよび自律型エージェントの市場情勢
- 自律型AIおよび自律型エージェントの市場シェア分析、2022年
- 主要メーカー別の内訳データ
- 既存企業の分析
- 新興企業の分析
第7章 自律型AIおよび自律型エージェント市場- コンポーネント別
- 概要
- コンポーネント別のセグメントシェア分析
- ハードウェア
- ソフトウェア
- サービス
第8章 自律型AIおよび自律型エージェント市場- 技術別
- 概要
- 技術別セグメントシェア分析
- 機械学習
- NLP
- コンテキスト認識
- コンピュータビジョン
第9章 自律型AIおよび自律型エージェント市場- 展開タイプ別
- 概要
- 展開タイプ別のセグメントシェア分析
- オンプレミス
- クラウド
第10章 自律型AIおよび自律型エージェント市場- 用途別
- 概要
- 用途別のセグメントシェア分析
- 小売とeコマース
- BFSI
- ITと通信
- 製造業
- ヘルスケアとライフサイエンス
- 政府と防衛
- その他
第11章 自律型AIおよび自律型エージェント市場- 地域別
- イントロダクション
- 北米
- 概要
- 北米の主要メーカー
- 米国
- カナダ
- 欧州
- 概要
- 欧州の主要メーカー
- ドイツ
- イタリア
- 英国
- フランス
- ロシア
- オランダ
- スウェーデン
- ポーランド
- その他
- アジア太平洋(APAC)
- 概要
- アジア太平洋地域の主要メーカー
- インド
- 中国
- 日本
- 韓国
- オーストラリア
- タイ
- インドネシア
- フィリピン
- その他
- ラテンアメリカ
- 概要
- ラテンアメリカの主要メーカー
- ブラジル
- メキシコ
- アルゼンチン
- コロンビア
- その他
- 中東とアフリカ
- 概要
- 中東およびアフリカの主要メーカー
- サウジアラビア
- アラブ首長国連邦
- イスラエル
- トルコ
- アルジェリア
- エジプト
- その他
第12章 主要ベンダー分析- 自律型AIおよび自律型エージェント業界
- 競合ダッシュボード
- 企業プロファイル
- IBM
- Microsoft
- Oracle
- Waymo LLC
- Deepmind
- OpenAI
- Salesforce
- SAP SE
- Nvidia Corporation
- その他
第13章 アナリストの全方位展望
List of Tables
- TABLE List of data sources
- TABLE Market drivers; Impact Analysis
- TABLE Market restraints; Impact Analysis
- TABLE Autonomous AI And Autonomous Agents Market: Component Snapshot (2022)
- TABLE Segment Dashboard; Definition and Scope, by Component
- TABLE Global Autonomous AI And Autonomous Agents Market, by Component 2018-2030 (USD Million)
- TABLE Autonomous AI And Autonomous Agents Market: Technology Snapshot (2022)
- TABLE Segment Dashboard; Definition and Scope, by Technology
- TABLE Global Autonomous AI And Autonomous Agents Market, by Technology 2018-2030 (USD Million)
- TABLE Autonomous AI And Autonomous Agents Market: Deployment Type Snapshot (2022)
- TABLE Segment Dashboard; Definition and Scope, by Deployment Type
- TABLE Global Autonomous AI And Autonomous Agents Market, by Deployment Type 2018-2030 (USD Million)
- TABLE Autonomous AI And Autonomous Agents Market: Application Snapshot (2022)
- TABLE Segment Dashboard; Definition and Scope, by Application
- TABLE Global Autonomous AI And Autonomous Agents Market, by Application 2018-2030 (USD Million)
- TABLE Autonomous AI And Autonomous Agents Market: Regional snapshot (2022)
- TABLE Segment Dashboard; Definition and Scope, by Region
- TABLE Global Autonomous AI And Autonomous Agents Market, by Region 2018-2030 (USD Million)
- TABLE North America Autonomous AI And Autonomous Agents Market, by Country, 2018-2030 (USD Million)
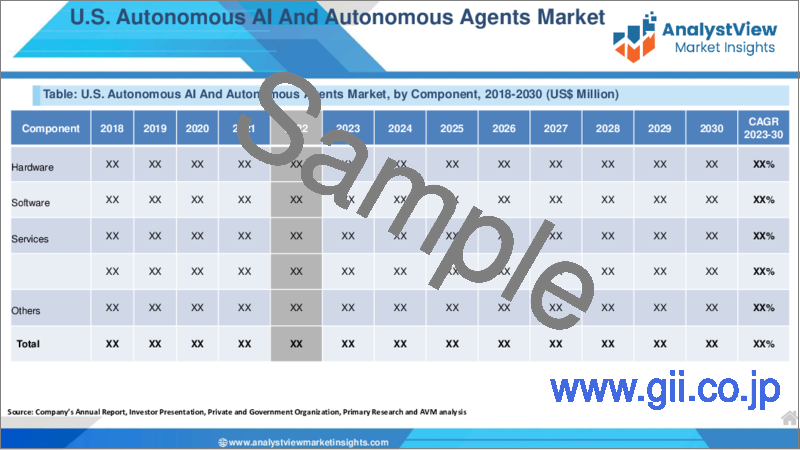
- TABLE North America Autonomous AI And Autonomous Agents Market, by Component, 2018-2030 (USD Million)
- TABLE North America Autonomous AI And Autonomous Agents Market, by Technology, 2018-2030 (USD Million)
- TABLE North America Autonomous AI And Autonomous Agents Market, by Deployment Type, 2018-2030 (USD Million)
- TABLE North America Autonomous AI And Autonomous Agents Market, by Application, 2018-2030 (USD Million)
- TABLE Europe Autonomous AI And Autonomous Agents Market, by Country, 2018-2030 (USD Million)
- TABLE Europe Autonomous AI And Autonomous Agents Market, by Component, 2018-2030 (USD Million)
- TABLE Europe Autonomous AI And Autonomous Agents Market, by Technology, 2018-2030 (USD Million)
- TABLE Europe Autonomous AI And Autonomous Agents Market, by Deployment Type, 2018-2030 (USD Million)
- TABLE Europe Autonomous AI And Autonomous Agents Market, by Application, 2018-2030 (USD Million)
- TABLE Asia Pacific Autonomous AI And Autonomous Agents Market, by Country, 2018-2030 (USD Million)
- TABLE Asia Pacific Autonomous AI And Autonomous Agents Market, by Component, 2018-2030 (USD Million)
- TABLE Asia Pacific Autonomous AI And Autonomous Agents Market, by Technology, 2018-2030 (USD Million)
- TABLE Asia Pacific Autonomous AI And Autonomous Agents Market, by Deployment Type, 2018-2030 (USD Million)
- TABLE Asia Pacific Autonomous AI And Autonomous Agents Market, by Application, 2018-2030 (USD Million)
- TABLE Latin America Autonomous AI And Autonomous Agents Market, by Country, 2018-2030 (USD Million)
- TABLE Latin America Autonomous AI And Autonomous Agents Market, by Component, 2018-2030 (USD Million)
- TABLE Latin America Autonomous AI And Autonomous Agents Market, by Technology, 2018-2030 (USD Million)
- TABLE Latin America Autonomous AI And Autonomous Agents Market, by Deployment Type, 2018-2030 (USD Million)
- TABLE Latin America Autonomous AI And Autonomous Agents Market, by Application, 2018-2030 (USD Million)
- TABLE Middle East and Africa Autonomous AI And Autonomous Agents Market, by Country, 2018-2030 (USD Million)
- TABLE Middle East and Africa Autonomous AI And Autonomous Agents Market, by Component, 2018-2030 (USD Million)
- TABLE Middle East and Africa Autonomous AI And Autonomous Agents Market, by Technology, 2018-2030 (USD Million)
- TABLE Middle East and Africa Autonomous AI And Autonomous Agents Market, by Deployment Type, 2018-2030 (USD Million)
- TABLE Middle East and Africa Autonomous AI And Autonomous Agents Market, by Application, 2018-2030 (USD Million)
REPORT HIGHLIGHT
Autonomous AI And Autonomous Agents Market size was valued at USD 4,000 Million in 2022, expanding at a CAGR of 45.4% from 2023 to 2030.
Autonomous AI And Autonomous Agents are interconnected concepts that pertain to systems capable of operating independently and making decisions without continuous human involvement. Specifically, autonomous AI refers to artificial intelligence systems that possess the ability to carry out tasks and make decisions without direct human control. These systems rely on their programming, training, and real-time data to make decisions, thereby eliminating the need for human input in every action. Autonomous AI can adapt to changing circumstances or environments, adjusting their behavior without requiring human intervention. Conversely, autonomous AI agents employ advanced algorithms and machine learning models to analyze data, gain insights, and autonomously execute tasks. Based on the desired objective and information about the environment, the agent formulates plans or strategies to achieve its goals. This process may involve planning actions, selecting appropriate tools, and anticipating potential outcomes.
Autonomous AI And Autonomous Agents Market- Market Dynamics
Growing adoption of AI-driven solutions across industries and expanding data infrastructure are expected to drive the growth of the market
Many industries are incorporating AI technologies into their operations to improve efficiency, productivity, and decision-making processes. This trend reflects the need for autonomous systems that can independently operate and make intelligent decisions based on data analysis. Financial services statistics suggest that by 2025, 95% of customer interactions will be AI-driven, highlighting the significant impact AI will have on the future of this industry. According to an artificial intelligence statistic, 35% of companies are currently using AI, while 42% are exploring its implementation in the future. As industries continue to expand their data infrastructure, there will be more opportunities for innovation in autonomous systems that can effectively harness and analyze available data. However, it is important to note that high implementation costs may pose a challenge to the market's growth.
Autonomous AI And Autonomous Agents Market- Key Insights
As per the analysis shared by our research analyst, the global market is estimated to grow annually at a CAGR of around 45.4% over the forecast period (2023-2030)
Based on Component segmentation, Software was predicted to show maximum market share in the year 2022
Based on Technology segmentation, Machine Learning was the leading type in 2022
Based on Deployment Type segmentation, Cloud was the leading type in 2022`
Based on Application segmentation, BFSI was the leading type in 2022
On the basis of region, North America was the leading revenue generator in 2022
Autonomous AI And Autonomous Agents Market- Segmentation Analysis:
The Global Autonomous AI And Autonomous Agents Market is segmented on the basis of Component, Technology, Deployment Type, Application, and Region.
The market is divided into three categories based on Component: Hardware, Software and Services. The market is largely dominated by the Software Segment. Software plays a crucial role in determining the behavior and capabilities of autonomous systems. This encompasses the creation of algorithms for decision-making, perception, and navigation, along with the design of the comprehensive architecture that facilitates autonomous functionality.
The market is divided into two categories based on Technology: Machine Learning, NLP, Context Awareness and Computer Vision. The market is largely dominated by the Machine Learning segment. Machine learning (ML) is a crucial technology that empowers systems to enhance their performance without the need for explicit programming. Within the realm of autonomous systems, machine learning algorithms are frequently employed for various tasks including perception, decision-making, and adapting to dynamic environments.
The market is divided into two categories based on Deployment type: On-premises and Cloud. Cloud Segment dominates the market. Cloud-based solutions offer flexibility and agility in deploying and updating autonomous systems. This is crucial in dynamic environments where systems need to adapt quickly to changes.
The market is divided into two categories based on Application: Retail & E-commerce, BFSI, IT & Telecommunication, Manufacturing, Healthcare & Lifesciences, Government & Defense and Others. The BFSI industry holds a significant share in the market. This sector has been actively embracing and implementing autonomous technologies, such as AI and autonomous agents, to improve different facets of their operations.
Autonomous AI And Autonomous Agents Market- Geographical Insights
Geographically, this market is spread across various regions including North America, Latin America, Europe, Asia Pacific, and the Middle East and Africa. These regions are further divided based on the countries involved in business activities. The growth of the market is expected to be dominated by North America, primarily due to the increasing demand for automation and efficiency. This trend is not limited to North America alone, as there is a global demand for automation and efficiency. Industries in North America are actively seeking solutions to enhance their processes and reduce costs, and autonomous AI and agents can play a crucial role in achieving this. According to the World of Automation Statistics, the United States alone could potentially experience an economic productivity increase ranging from USD1.2 to USD2.6 trillion by 2030, recognitions to automation. Europe holds the second-largest market during the forecast period, mainly due to the growing adoption of cloud computing.
Autonomous AI And Autonomous Agents market- Competitive Landscape:
Autonomous AI and autonomous agents have revolutionized the marketing landscape, with applications playing a pivotal role in this transformation. However, the recent emergence of autonomous AI marketing agencies has garnered significant attention. These agencies are being utilized by companies across various sectors to enhance efficiency and productivity. This comprehensive study delves into the realm of independent AI agents and their potential benefits for businesses. Governments, businesses, and venture capitalists are making substantial investments in autonomous technologies, fostering innovation and development. Organizations may acquire a competitive advantage and position themselves for success in today's highly competitive marketplace by automating tasks, generating useful insights, and optimizing workflows. The use of self-driving AI agents may result in considerable gains in effectiveness, savings in expenses, making decisions, flexibility, as well as overall competitiveness. By harnessing the capabilities of these intelligent systems, organizations can unlock new growth opportunities and drive innovation, ensuring success in an ever-evolving technological landscape.
Recent Developments:
Oracle has recently revealed intentions to introduce semantic search capabilities to Oracle Database 23c utilizing AI vectors. AI Vector Browse is an assortment of characteristics consisting of an innovative vector information type, vector indices, and vector search SQL operators. This enables the Oracle Database to store semantic information of pictures, documents, and other unorganized information as vectors and use them to execute fast similarity queries.
SCOPE OF THE REPORT
The scope of this report covers the market by its major segments, which include as follows:
GLOBAL Autonomous AI And Autonomous Agents MARKET KEY PLAYERS
- IBM
- Microsoft
- Oracle
- Waymo LLC
- Deepmind
- OpenAI
- Salesforce
- SAP SE
- Nvidia Corporation
- Others
GLOBAL Autonomous AI And Autonomous Agents MARKET, BY COMPONENT
- Hardware
- Software
- Services
GLOBAL Autonomous AI And Autonomous Agents MARKET, BY TECHNOLOGY
- Machine Learning
- NLP
- Context Awareness
- Computer Vision
GLOBAL Autonomous AI And Autonomous Agents MARKET, BY DEPLOYMENT TYPE
- On-premises
- Cloud
GLOBAL Autonomous AI And Autonomous Agents MARKET, BY APPLICATION
- Retail & E-commerce
- BFSI
- IT & Telecommunication
- Manufacturing
- Healthcare & Lifesciences
- Government & Defense
- Others
GLOBAL Autonomous AI And Autonomous Agents MARKET, BY REGION
- North America
- The U.S.
- Canada
- Europe
- Germany
- France
- Italy
- Spain
- United Kingdom
- Russia
- Netherlands
- Sweden
- Poland
- Rest of Europe
- Asia Pacific
- India
- China
- South Korea
- Japan
- Australia
- Thailand
- Indonesia
- Philippines
- Rest of APAC
- Latin America
- Brazil
- Mexico
- Argentina
- Colombia
- Rest of LATAM
- The Middle East and Africa
- Saudi Arabia
- United Arab Emirates
- Israel
- Turkey
- Algeria
- Egypt
- Rest of MEA
Table of Contents
1. Autonomous AI And Autonomous Agents Market Overview
- 1.1. Study Scope
- 1.2. Market Estimation Years
2. Executive Summary
- 2.1. Market Snippet
- 2.1.1. Autonomous AI And Autonomous Agents Market Snippet by Component
- 2.1.2. Autonomous AI And Autonomous Agents Market Snippet by Technology
- 2.1.3. Autonomous AI And Autonomous Agents Market Snippet by Deployment Type
- 2.1.4. Autonomous AI And Autonomous Agents Market Snippet by Application
- 2.1.5. Autonomous AI And Autonomous Agents Market Snippet by Country
- 2.1.6. Autonomous AI And Autonomous Agents Market Snippet by Region
- 2.2. Competitive Insights
3. Autonomous AI And Autonomous Agents Key Market Trends
- 3.1. Autonomous AI And Autonomous Agents Market Drivers
- 3.1.1. Impact Analysis of Market Drivers
- 3.2. Autonomous AI And Autonomous Agents Market Restraints
- 3.2.1. Impact Analysis of Market Restraints
- 3.3. Autonomous AI And Autonomous Agents Market Opportunities
- 3.4. Autonomous AI And Autonomous Agents Market Future Trends
4. Autonomous AI And Autonomous Agents Industry Study
- 4.1. PEST Analysis
- 4.2. Porter's Five Forces Analysis
- 4.3. Growth Prospect Mapping
- 4.4. Regulatory Framework Analysis
5. Autonomous AI And Autonomous Agents Market: COVID-19 Impact Analysis
- 5.1. Pre-COVID-19 Impact Analysis
- 5.2. Post-COVID-19 Impact Analysis
- 5.2.1. Top Performing Segments
- 5.2.2. Marginal Growth Segments
- 5.2.3. Top Looser Segments
- 5.2.4. Marginal Loss Segments
6. Autonomous AI And Autonomous Agents Market Landscape
- 6.1. Autonomous AI And Autonomous Agents Market Share Analysis, 2022
- 6.2. Breakdown Data, by Key Manufacturer
- 6.2.1. Established Players' Analysis
- 6.2.2. Emerging Players' Analysis
7. Autonomous AI And Autonomous Agents Market - By Component
- 7.1. Overview
- 7.1.1. Segment Share Analysis, By Component, 2022 & 2030 (%)
- 7.1.2. Hardware
- 7.1.3. Software
- 7.1.4. Services
8. Autonomous AI And Autonomous Agents Market - By Technology
- 8.1. Overview
- 8.1.1. Segment Share Analysis, By Technology, 2022 & 2030 (%)
- 8.1.2. Machine Learning
- 8.1.3. NLP
- 8.1.4. Context Awareness
- 8.1.5. Computer Vision
9. Autonomous AI And Autonomous Agents Market - By Deployment Type
- 9.1. Overview
- 9.1.1. Segment Share Analysis, By Deployment Type, 2022 & 2030 (%)
- 9.1.2. On-premises
- 9.1.3. Cloud
10. Autonomous AI And Autonomous Agents Market - By Application
- 10.1. Overview
- 10.1.1. Segment Share Analysis, By Application, 2022 & 2030 (%)
- 10.1.2. Retail & E-commerce
- 10.1.3. BFSI
- 10.1.4. IT & Telecommunication
- 10.1.5. Manufacturing
- 10.1.6. Healthcare & Lifesciences
- 10.1.7. Government & Defense
- 10.1.8. Others
11. Autonomous AI And Autonomous Agents Market- By Geography
- 11.1. Introduction
- 11.1.1. Segment Share Analysis, By Geography, 2022 & 2030 (%)
- 11.2. North America
- 11.2.1. Overview
- 11.2.2. Autonomous AI And Autonomous Agents Key Manufacturers in North America
- 11.2.3. North America Market Size and Forecast, By Country, 2018 - 2030 (US$ Million)
- 11.2.4. North America Market Size and Forecast, By Component, 2018 - 2030 (US$ Million)
- 11.2.5. North America Market Size and Forecast, By Technology, 2018 - 2030 (US$ Million)
- 11.2.6. North America Market Size and Forecast, By Deployment Type, 2018 - 2030 (US$ Million)
- 11.2.7. North America Market Size and Forecast, By Application, 2018 - 2030 (US$ Million)
- 11.2.8. U.S.
- 11.2.8.1. Overview
- 11.2.8.2. Market Analysis, Forecast, and Y-O-Y Growth Rate, 2018 - 2030, (US$ Million)
- 11.2.8.3. U.S. Market Size and Forecast, By Component, 2018 - 2030 (US$ Million)
- 11.2.8.4. U.S. Market Size and Forecast, By Technology, 2018 - 2030 (US$ Million)
- 11.2.8.5. U.S. Market Size and Forecast, By Deployment Type, 2018 - 2030 (US$ Million)
- 11.2.8.6. U.S. Market Size and Forecast, By Application, 2018 - 2030 (US$ Million)
- 11.2.9. Canada
- 11.2.9.1. Overview
- 11.2.9.2. Market Analysis, Forecast, and Y-O-Y Growth Rate, 2018 - 2030, (US$ Million)
- 11.2.9.3. Canada Market Size and Forecast, By Component, 2018 - 2030 (US$ Million)
- 11.2.9.4. Canada Market Size and Forecast, By Technology, 2018 - 2030 (US$ Million)
- 11.2.9.5. Canada Market Size and Forecast, By Deployment Type, 2018 - 2030 (US$ Million)
- 11.2.9.6. Canada Market Size and Forecast, By Application, 2018 - 2030 (US$ Million)
- 11.3. Europe
- 11.3.1. Overview
- 11.3.2. Autonomous AI And Autonomous Agents Key Manufacturers in Europe
- 11.3.3. Europe Market Size and Forecast, By Country, 2018 - 2030 (US$ Million)
- 11.3.4. Europe Market Size and Forecast, By Component, 2018 - 2030 (US$ Million)
- 11.3.5. Europe Market Size and Forecast, By Technology, 2018 - 2030 (US$ Million)
- 11.3.6. Europe Market Size and Forecast, By Deployment Type, 2018 - 2030 (US$ Million)
- 11.3.7. Europe Market Size and Forecast, By Application, 2018 - 2030 (US$ Million)
- 11.3.8. Germany
- 11.3.8.1. Overview
- 11.3.8.2. Market Analysis, Forecast, and Y-O-Y Growth Rate, 2018 - 2030, (US$ Million)
- 11.3.8.3. Germany Market Size and Forecast, By Component, 2018 - 2030 (US$ Million)
- 11.3.8.4. Germany Market Size and Forecast, By Technology, 2018 - 2030 (US$ Million)
- 11.3.8.5. Germany Market Size and Forecast, By Deployment Type, 2018 - 2030 (US$ Million)
- 11.3.8.6. Germany Market Size and Forecast, By Application, 2018 - 2030 (US$ Million)
- 11.3.9. Italy
- 11.3.9.1. Overview
- 11.3.9.2. Market Analysis, Forecast, and Y-O-Y Growth Rate, 2018 - 2030, (US$ Million)
- 11.3.9.3. Italy Market Size and Forecast, By Component, 2018 - 2030 (US$ Million)
- 11.3.9.4. Italy Market Size and Forecast, By Technology, 2018 - 2030 (US$ Million)
- 11.3.9.5. Italy Market Size and Forecast, By Deployment Type, 2018 - 2030 (US$ Million)
- 11.3.9.6. Italy Market Size and Forecast, By Application, 2018 - 2030 (US$ Million)
- 11.3.10. United Kingdom
- 11.3.10.1. Overview
- 11.3.10.2. Market Analysis, Forecast, and Y-O-Y Growth Rate, 2018 - 2030, (US$ Million)
- 11.3.10.3. United Kingdom Market Size and Forecast, By Component, 2018 - 2030 (US$ Million)
- 11.3.10.4. United Kingdom Market Size and Forecast, By Technology, 2018 - 2030 (US$ Million)
- 11.3.10.5. United Kingdom Market Size and Forecast, By Deployment Type, 2018 - 2030 (US$ Million)
- 11.3.10.6. United Kingdom Market Size and Forecast, By Application, 2018 - 2030 (US$ Million)
- 11.3.11. France
- 11.3.11.1. Overview
- 11.3.11.2. Market Analysis, Forecast, and Y-O-Y Growth Rate, 2018 - 2030, (US$ Million)
- 11.3.11.3. France Market Size and Forecast, By Component, 2018 - 2030 (US$ Million)
- 11.3.11.4. France Market Size and Forecast, By Technology, 2018 - 2030 (US$ Million)
- 11.3.11.5. France Market Size and Forecast, By Deployment Type, 2018 - 2030 (US$ Million)
- 11.3.11.6. France Market Size and Forecast, By Application, 2018 - 2030 (US$ Million)
- 11.3.12. Russia
- 11.3.12.1. Market Analysis, Forecast, and Y-O-Y Growth Rate, 2018 - 2030, (US$ Million)
- 11.3.12.2. Russia Market Size and Forecast, By Component, 2018 - 2030 (US$ Million)
- 11.3.12.3. Russia Market Size and Forecast, By Technology, 2018 - 2030 (US$ Million)
- 11.3.12.4. Russia Market Size and Forecast, By Deployment Type, 2018 - 2030 (US$ Million)
- 11.3.12.5. Russia Market Size and Forecast, By Application, 2018 - 2030 (US$ Million)
- 11.3.13. Netherlands
- 11.3.13.1. Market Analysis, Forecast, and Y-O-Y Growth Rate, 2018 - 2030, (US$ Million)
- 11.3.13.2. Netherlands Market Size and Forecast, By Component, 2018 - 2030 (US$ Million)
- 11.3.13.3. Netherlands Market Size and Forecast, By Technology, 2018 - 2030 (US$ Million)
- 11.3.13.4. Netherlands Market Size and Forecast, By Deployment Type, 2018 - 2030 (US$ Million)
- 11.3.13.5. Netherlands Market Size and Forecast, By Application, 2018 - 2030 (US$ Million)
- 11.3.14. Sweden
- 11.3.14.1. Market Analysis, Forecast, and Y-O-Y Growth Rate, 2018 - 2030, (US$ Million)
- 11.3.14.2. Sweden Market Size and Forecast, By Component, 2018 - 2030 (US$ Million)
- 11.3.14.3. Sweden Market Size and Forecast, By Technology, 2018 - 2030 (US$ Million)
- 11.3.14.4. Sweden Market Size and Forecast, By Deployment Type, 2018 - 2030 (US$ Million)
- 11.3.14.5. Sweden Market Size and Forecast, By Application, 2018 - 2030 (US$ Million)
- 11.3.15. Poland
- 11.3.15.1. Market Analysis, Forecast, and Y-O-Y Growth Rate, 2018 - 2030, (US$ Million)
- 11.3.15.2. Poland Market Size and Forecast, By Component, 2018 - 2030 (US$ Million)
- 11.3.15.3. Poland Market Size and Forecast, By Technology, 2018 - 2030 (US$ Million)
- 11.3.15.4. Poland Market Size and Forecast, By Deployment Type, 2018 - 2030 (US$ Million)
- 11.3.15.5. Poland Market Size and Forecast, By Application, 2018 - 2030 (US$ Million)
- 11.3.16. Rest of Europe
- 11.3.16.1. Overview
- 11.3.16.2. Market Analysis, Forecast, and Y-O-Y Growth Rate, 2018 - 2030, (US$ Million)
- 11.3.16.3. Rest of the Europe Market Size and Forecast, By Component, 2018 - 2030 (US$ Million)
- 11.3.16.4. Rest of the Europe Market Size and Forecast, By Technology, 2018 - 2030 (US$ Million)
- 11.3.16.5. Rest of the Europe Market Size and Forecast, By Deployment Type, 2018 - 2030 (US$ Million)
- 11.3.16.6. Rest of the Europe Market Size and Forecast, By Application, 2018 - 2030 (US$ Million)
- 11.4. Asia Pacific (APAC)
- 11.4.1. Overview
- 11.4.2. Autonomous AI And Autonomous Agents Key Manufacturers in Asia Pacific
- 11.4.3. Asia Pacific Market Size and Forecast, By Country, 2018 - 2030 (US$ Million)
- 11.4.4. Asia Pacific Market Size and Forecast, By Component, 2018 - 2030 (US$ Million)
- 11.4.5. Asia Pacific Market Size and Forecast, By Technology, 2018 - 2030 (US$ Million)
- 11.4.6. Asia Pacific Market Size and Forecast, By Deployment Type, 2018 - 2030 (US$ Million)
- 11.4.7. Asia Pacific Market Size and Forecast, By Application, 2018 - 2030 (US$ Million)
- 11.4.8. India
- 11.4.8.1. Overview
- 11.4.8.2. Market Analysis, Forecast, and Y-O-Y Growth Rate, 2018 - 2030, (US$ Million)
- 11.4.8.3. India Market Size and Forecast, By Component, 2018 - 2030 (US$ Million)
- 11.4.8.4. India Market Size and Forecast, By Technology, 2018 - 2030 (US$ Million)
- 11.4.8.5. India Market Size and Forecast, By Deployment Type, 2018 - 2030 (US$ Million)
- 11.4.8.6. India Market Size and Forecast, By Application, 2018 - 2030 (US$ Million)
- 11.4.9. China
- 11.4.9.1. Overview
- 11.4.9.2. Market Analysis, Forecast, and Y-O-Y Growth Rate, 2018 - 2030, (US$ Million)
- 11.4.9.3. China Market Size and Forecast, By Component, 2018 - 2030 (US$ Million)
- 11.4.9.4. China Market Size and Forecast, By Technology, 2018 - 2030 (US$ Million)
- 11.4.9.5. China Market Size and Forecast, By Deployment Type, 2018 - 2030 (US$ Million)
- 11.4.9.6. China Market Size and Forecast, By Application, 2018 - 2030 (US$ Million)
- 11.4.10. Japan
- 11.4.10.1. Overview
- 11.4.10.2. Market Analysis, Forecast, and Y-O-Y Growth Rate, 2018 - 2030, (US$ Million)
- 11.4.10.3. Japan Market Size and Forecast, By Component, 2018 - 2030 (US$ Million)
- 11.4.10.4. Japan Market Size and Forecast, By Technology, 2018 - 2030 (US$ Million)
- 11.4.10.5. Japan Market Size and Forecast, By Deployment Type, 2018 - 2030 (US$ Million)
- 11.4.10.6. Japan Market Size and Forecast, By Application, 2018 - 2030 (US$ Million)
- 11.4.11. South Korea
- 11.4.11.1. Overview
- 11.4.11.2. Market Analysis, Forecast, and Y-O-Y Growth Rate, 2018 - 2030, (US$ Million)
- 11.4.11.3. South Korea Market Size and Forecast, By Component, 2018 - 2030 (US$ Million)
- 11.4.11.4. South Korea Market Size and Forecast, By Technology, 2018 - 2030 (US$ Million)
- 11.4.11.5. South Korea Market Size and Forecast, By Deployment Type, 2018 - 2030 (US$ Million)
- 11.4.11.6. South Korea Market Size and Forecast, By Application, 2018 - 2030 (US$ Million)
- 11.4.12. Australia
- 11.4.12.1. Overview
- 11.4.12.2. Market Analysis, Forecast, and Y-O-Y Growth Rate, 2018 - 2030, (US$ Million)
- 11.4.12.3. Australia Market Size and Forecast, By Component, 2018 - 2030 (US$ Million)
- 11.4.12.4. Australia Market Size and Forecast, By Technology, 2018 - 2030 (US$ Million)
- 11.4.12.5. Australia Market Size and Forecast, By Deployment Type, 2018 - 2030 (US$ Million)
- 11.4.12.6. Australia Market Size and Forecast, By Application, 2018 - 2030 (US$ Million)
- 11.4.13. Thailand
- 11.4.13.1. Overview
- 11.4.13.2. Market Analysis, Forecast, and Y-O-Y Growth Rate, 2018 - 2030, (US$ Million)
- 11.4.13.3. Thailand Market Size and Forecast, By Component, 2018 - 2030 (US$ Million)
- 11.4.13.4. Thailand Market Size and Forecast, By Technology, 2018 - 2030 (US$ Million)
- 11.4.13.5. Thailand Market Size and Forecast, By Deployment Type, 2018 - 2030 (US$ Million)
- 11.4.13.6. Thailand Market Size and Forecast, By Application, 2018 - 2030 (US$ Million)
- 11.4.14. Indonesia
- 11.4.14.1. Overview
- 11.4.14.2. Market Analysis, Forecast, and Y-O-Y Growth Rate, 2018 - 2030, (US$ Million)
- 11.4.14.3. Indonesia Market Size and Forecast, By Component, 2018 - 2030 (US$ Million)
- 11.4.14.4. Indonesia Market Size and Forecast, By Technology, 2018 - 2030 (US$ Million)
- 11.4.14.5. Indonesia Market Size and Forecast, By Deployment Type, 2018 - 2030 (US$ Million)
- 11.4.14.6. Indonesia Market Size and Forecast, By Application, 2018 - 2030 (US$ Million)
- 11.4.15. Philippines
- 11.4.15.1. Overview
- 11.4.15.2. Market Analysis, Forecast, and Y-O-Y Growth Rate, 2018 - 2030, (US$ Million)
- 11.4.15.3. Philippines Market Size and Forecast, By Component, 2018 - 2030 (US$ Million)
- 11.4.15.4. Philippines Market Size and Forecast, By Technology, 2018 - 2030 (US$ Million)
- 11.4.15.5. Philippines Market Size and Forecast, By Deployment Type, 2018 - 2030 (US$ Million)
- 11.4.15.6. Philippines Market Size and Forecast, By Application, 2018 - 2030 (US$ Million)
- 11.4.16. Rest of APAC
- 11.4.16.1. Overview
- 11.4.16.2. Market Analysis, Forecast, and Y-O-Y Growth Rate, 2018 - 2030, (US$ Million)
- 11.4.16.3. Rest of APAC Market Size and Forecast, By Component, 2018 - 2030 (US$ Million)
- 11.4.16.4. Rest of APAC Market Size and Forecast, By Technology, 2018 - 2030 (US$ Million)
- 11.4.16.5. Rest of APAC Market Size and Forecast, By Deployment Type, 2018 - 2030 (US$ Million)
- 11.4.16.6. Rest of APAC Market Size and Forecast, By Application, 2018 - 2030 (US$ Million)
- 11.5. Latin America
- 11.5.1. Overview
- 11.5.2. Autonomous AI And Autonomous Agents Key Manufacturers in Latin America
- 11.5.3. Latin America Market Size and Forecast, By Country, 2018 - 2030 (US$ Million)
- 11.5.4. Latin America Market Size and Forecast, By Component, 2018 - 2030 (US$ Million)
- 11.5.5. Latin America Market Size and Forecast, By Technology, 2018 - 2030 (US$ Million)
- 11.5.6. Latin America Market Size and Forecast, By Deployment Type, 2018 - 2030 (US$ Million)
- 11.5.7. Latin America Market Size and Forecast, By Application, 2018 - 2030 (US$ Million)
- 11.5.8. Brazil
- 11.5.8.1. Overview
- 11.5.8.2. Market Analysis, Forecast, and Y-O-Y Growth Rate, 2018 - 2030, (US$ Million)
- 11.5.8.3. Brazil Market Size and Forecast, By Component, 2018 - 2030 (US$ Million)
- 11.5.8.4. Brazil Market Size and Forecast, By Technology, 2018 - 2030 (US$ Million)
- 11.5.8.5. Brazil Market Size and Forecast, By Deployment Type, 2018 - 2030 (US$ Million)
- 11.5.8.6. Brazil Market Size and Forecast, By Application, 2018 - 2030 (US$ Million)
- 11.5.9. Mexico
- 11.5.9.1. Overview
- 11.5.9.2. Market Analysis, Forecast, and Y-O-Y Growth Rate, 2018 - 2030, (US$ Million)
- 11.5.9.3. Mexico Market Size and Forecast, By Component, 2018 - 2030 (US$ Million)
- 11.5.9.4. Mexico Market Size and Forecast, By Technology, 2018 - 2030 (US$ Million)
- 11.5.9.5. Mexico Market Size and Forecast, By Deployment Type, 2018 - 2030 (US$ Million)
- 11.5.9.6. Mexico Market Size and Forecast, By Application, 2018 - 2030 (US$ Million)
- 11.5.10. Argentina
- 11.5.10.1. Overview
- 11.5.10.2. Market Analysis, Forecast, and Y-O-Y Growth Rate, 2018 - 2030, (US$ Million)
- 11.5.10.3. Argentina Market Size and Forecast, By Component, 2018 - 2030 (US$ Million)
- 11.5.10.4. Argentina Market Size and Forecast, By Technology, 2018 - 2030 (US$ Million)
- 11.5.10.5. Argentina Market Size and Forecast, By Deployment Type, 2018 - 2030 (US$ Million)
- 11.5.10.6. Argentina Market Size and Forecast, By Application, 2018 - 2030 (US$ Million)
- 11.5.11. Colombia
- 11.5.11.1. Overview
- 11.5.11.2. Market Analysis, Forecast, and Y-O-Y Growth Rate, 2018 - 2030, (US$ Million)
- 11.5.11.3. Colombia Market Size and Forecast, By Component, 2018 - 2030 (US$ Million)
- 11.5.11.4. Colombia Market Size and Forecast, By Technology, 2018 - 2030 (US$ Million)
- 11.5.11.5. Colombia Market Size and Forecast, By Deployment Type, 2018 - 2030 (US$ Million)
- 11.5.11.6. Colombia Market Size and Forecast, By Application, 2018 - 2030 (US$ Million)
- 11.5.12. Rest of LATAM
- 11.5.12.1. Overview
- 11.5.12.2. Market Analysis, Forecast, and Y-O-Y Growth Rate, 2018 - 2030, (US$ Million)
- 11.5.12.3. Rest of LATAM Market Size and Forecast, By Component, 2018 - 2030 (US$ Million)
- 11.5.12.4. Rest of LATAM Market Size and Forecast, By Technology, 2018 - 2030 (US$ Million)
- 11.5.12.5. Rest of LATAM Market Size and Forecast, By Deployment Type, 2018 - 2030 (US$ Million)
- 11.5.12.6. Rest of LATAM Market Size and Forecast, By Application, 2018 - 2030 (US$ Million)
- 11.6. Middle East and Africa
- 11.6.1. Overview
- 11.6.2. Autonomous AI And Autonomous Agents Key Manufacturers in Middle East and Africa
- 11.6.3. Middle East and Africa Market Size and Forecast, By Country, 2018 - 2030 (US$ Million)
- 11.6.4. Middle East and Africa Market Size and Forecast, By Component, 2018 - 2030 (US$ Million)
- 11.6.5. Middle East and Africa Market Size and Forecast, By Technology, 2018 - 2030 (US$ Million)
- 11.6.6. Middle East and Africa Market Size and Forecast, By Deployment Type, 2018 - 2030 (US$ Million)
- 11.6.7. Middle East and Africa Market Size and Forecast, By Application, 2018 - 2030 (US$ Million)
- 11.6.8. Saudi Arabia
- 11.6.8.1. Overview
- 11.6.8.2. Market Analysis, Forecast, and Y-O-Y Growth Rate, 2018 - 2030, (US$ Million)
- 11.6.8.3. Saudi Arabia Market Size and Forecast, By Component, 2018 - 2030 (US$ Million)
- 11.6.8.4. Saudi Arabia Market Size and Forecast, By Technology, 2018 - 2030 (US$ Million)
- 11.6.8.5. Saudi Arabia Market Size and Forecast, By Deployment Type, 2018 - 2030 (US$ Million)
- 11.6.8.6. Saudi Arabia Market Size and Forecast, By Application, 2018 - 2030 (US$ Million)
- 11.6.9. United Arab Emirates
- 11.6.9.1. Overview
- 11.6.9.2. Market Analysis, Forecast, and Y-O-Y Growth Rate, 2018 - 2030, (US$ Million)
- 11.6.9.3. United Arab Emirates Market Size and Forecast, By Component, 2018 - 2030 (US$ Million)
- 11.6.9.4. United Arab Emirates Market Size and Forecast, By Technology, 2018 - 2030 (US$ Million)
- 11.6.9.5. United Arab Emirates Market Size and Forecast, By Deployment Type, 2018 - 2030 (US$ Million)
- 11.6.9.6. United Arab Emirates Market Size and Forecast, By Application, 2018 - 2030 (US$ Million)
- 11.6.10. Israel
- 11.6.10.1. Overview
- 11.6.10.2. Market Analysis, Forecast, and Y-O-Y Growth Rate, 2018 - 2030, (US$ Million)
- 11.6.10.3. Israel Market Size and Forecast, By Component, 2018 - 2030 (US$ Million)
- 11.6.10.4. Israel Market Size and Forecast, By Technology, 2018 - 2030 (US$ Million)
- 11.6.10.5. Israel Market Size and Forecast, By Deployment Type, 2018 - 2030 (US$ Million)
- 11.6.10.6. Israel Market Size and Forecast, By Application, 2018 - 2030 (US$ Million)
- 11.6.11. Turkey
- 11.6.11.1. Overview
- 11.6.11.2. Market Analysis, Forecast, and Y-O-Y Growth Rate, 2018 - 2030, (US$ Million)
- 11.6.11.3. Turkey Market Size and Forecast, By Component, 2018 - 2030 (US$ Million)
- 11.6.11.4. Turkey Market Size and Forecast, By Technology, 2018 - 2030 (US$ Million)
- 11.6.11.5. Turkey Market Size and Forecast, By Deployment Type, 2018 - 2030 (US$ Million)
- 11.6.11.6. Turkey Market Size and Forecast, By Application, 2018 - 2030 (US$ Million)
- 11.6.12. Algeria
- 11.6.12.1. Overview
- 11.6.12.2. Market Analysis, Forecast, and Y-O-Y Growth Rate, 2018 - 2030, (US$ Million)
- 11.6.12.3. Algeria Market Size and Forecast, By Component, 2018 - 2030 (US$ Million)
- 11.6.12.4. Algeria Market Size and Forecast, By Technology, 2018 - 2030 (US$ Million)
- 11.6.12.5. Algeria Market Size and Forecast, By Deployment Type, 2018 - 2030 (US$ Million)
- 11.6.12.6. Algeria Market Size and Forecast, By Application, 2018 - 2030 (US$ Million)
- 11.6.13. Egypt
- 11.6.13.1. Overview
- 11.6.13.2. Market Analysis, Forecast, and Y-O-Y Growth Rate, 2018 - 2030, (US$ Million)
- 11.6.13.3. Egypt Market Size and Forecast, By Component, 2018 - 2030 (US$ Million)
- 11.6.13.4. Egypt Market Size and Forecast, By Technology, 2018 - 2030 (US$ Million)
- 11.6.13.5. Egypt Market Size and Forecast, By Deployment Type, 2018 - 2030 (US$ Million)
- 11.6.13.6. Egypt Market Size and Forecast, By Application, 2018 - 2030 (US$ Million)
- 11.6.14. Rest of MEA
- 11.6.14.1. Overview
- 11.6.14.2. Market Analysis, Forecast, and Y-O-Y Growth Rate, 2018 - 2030, (US$ Million)
- 11.6.14.3. Rest of MEA Market Size and Forecast, By Component, 2018 - 2030 (US$ Million)
- 11.6.14.4. Rest of MEA Market Size and Forecast, By Technology, 2018 - 2030 (US$ Million)
- 11.6.14.5. Rest of MEA Market Size and Forecast, By Deployment Type, 2018 - 2030 (US$ Million)
- 11.6.14.6. Rest of MEA Market Size and Forecast, By Application, 2018 - 2030 (US$ Million)
12. Key Vendor Analysis- Autonomous AI And Autonomous Agents Industry
- 12.1. Competitive Dashboard
- 12.2. Company Profiles
- 12.2.1. Google
- 12.2.2. IBM
- 12.2.3. Microsoft
- 12.2.4. Oracle
- 12.2.5. Waymo LLC
- 12.2.6. Deepmind
- 12.2.7. OpenAI
- 12.2.8. Salesforce
- 12.2.9. SAP SE
- 12.2.10. Nvidia Corporation
- 12.2.11. Others
13. 360 Degree Analyst View
14. Appendix
- 14.1. Research Methodology
- 14.2. References
- 14.3. Abbreviations
- 14.4. Disclaimer
- 14.5. Contact Us
