|
|
市場調査レポート
商品コード
1397111
空気分離装置市場:ガス別、プロセス別、最終用途別、国別、地域別 - 産業分析、市場規模、市場シェア、予測、2023年~2030年Air Separation Plant Market, By Gas, By Process, By End-use, By Country, and By Region - Industry Analysis, Market Size, Market Share & Forecast from 2023-2030 |
||||||
|
|||||||
カスタマイズ可能
|
|||||||

| 空気分離装置市場:ガス別、プロセス別、最終用途別、国別、地域別 - 産業分析、市場規模、市場シェア、予測、2023年~2030年 |
|
出版日: 2023年12月05日
発行: AnalystView Market Insights
ページ情報: 英文 295 Pages
納期: 2~3営業日
|

全表示
- 概要
- 図表
- 目次
レポートハイライト
空気分離装置の市場規模は、2022年に68億5,650万米ドルとなり、2023年から2030年にかけてCAGR 4.5%で拡大すると予測されています。
空気分離装置市場-市場力学
様々な産業からの産業ガス需要の増加が市場拡大を牽引
空気分離装置産業は、ヘルスケア、冶金、化学、食品・飲食品、石油・ガスなど、さまざまな最終用途産業における工業用ガスへのニーズの高まりが市場の主な原動力となっています。工業用ガスは、様々な化学物質の合成のための原料として、また溶接、金属製造、化学処理など多くの用途で使用されます。呼吸療法、麻酔、さまざまな病状の治療を含む医療用途では、酸素や窒素などの工業用ガスが使用されています。医療用酸素の需要はCOVID-19の大流行時に大幅に増加し、ヘルスケア産業において工業用ガスが果たす重要な役割が浮き彫りになっています。冶金産業では、窒素や酸素のような工業用ガスを使用して鉄鋼やその他の金属を製造しています。工業用ガスを利用することで、製造工程の品質と効率を向上させながら、排出ガスを削減することができます。化学産業では、工業用ガスはプラスチック、ポリマー、肥料など、さまざまな化学物質を製造するための原料として利用されています。窒素や水素のような工業ガスは、化学反応における還元剤として使用されます。全体として、さまざまな最終用途産業で産業ガスに対する要求が高まっていることが、産業ガス生産の安定した需要を生み出す空気分離装置産業の大きな力となっています。
空気分離装置市場-主要洞察
空気分離装置産業は、様々な最終用途産業における工業用ガス需要の増加により、著しい速度で成長すると予測されています。
ガスセグメント別では、窒素セグメントが予測期間中に大きな市場シェアを獲得すると見込まれています。
プロセスセグメント別では、極低温セグメントが予測期間中に市場を独占すると予測されています。
最終用途セグメンテーションに基づくと、鉄鋼セグメントが予測期間中にかなりの市場シェアを獲得する見込みです。
地域別では、アジア太平洋地域が予測期間中に市場を独占する見込みです。
空気分離装置市場-セグメンテーション分析:
世界の空気分離装置市場は、ガス、プロセス、最終用途、地域に基づいてセグメント化されます。
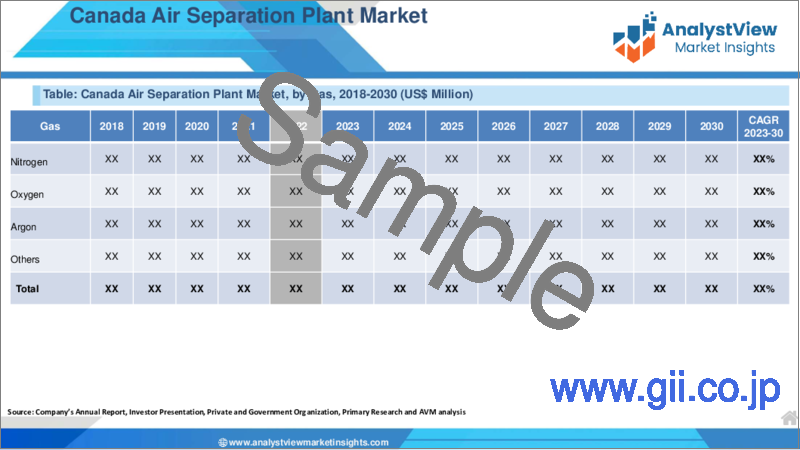
ガスに基づいて、市場は窒素、酸素、アルゴン、その他に二分されます。窒素セグメントは予測期間中に大きな市場シェアを獲得します。冶金、電子機器製造、石油化学、化学など多くの産業分野が窒素ガスに依存しています。窒素ガスのニーズは、これらのセクターの拡大が促進力となっています。さらに、新興国の急速な工業化の結果、インフラ整備や産業を支える窒素を含む工業用ガスのニーズが高まっています。
プロセスは、極低温と非極低温に区分されます。予測期間中、極低温分野が市場を独占すると見られています。極低温空気分離装置の需要は、化学、鉄鋼、ヘルスケアなどのビジネスの成長と工業化の進展によって牽引されています。また、極低温手順は、厳しい環境法や排出制限に準拠できるため、持続可能性を重視する分野でも人気の高い選択肢となっています。
最終用途に基づき、市場は鉄鋼、石油・ガス、化学、ヘルスケア、その他に二分されます。鉄鋼セグメントは、予測期間中にかなりの市場シェアを獲得すると予想されます。鉄鋼業界は、産業ガス、特に酸素の主要な消費者です。酸素は製鉄プロセスで燃焼を促進し効率を高めるために使用されます。酸素は一般的に、製鉄における重要な中間製品である銑鉄の生産を改善するために高炉に注入されます。
空気分離装置市場-地理的洞察
地理的には、この市場は北米、ラテンアメリカ、欧州、アジア太平洋、中東・アフリカの地域に広がっています。これらの地域は、ビジネスをもたらす国によってさらに分けられます。予測期間中、アジア太平洋地域が市場を独占すると予想されています。中国やインドのような国の急速な工業化と経済拡大の結果、エレクトロニクス、鉄鋼、化学などいくつかの産業で工業用ガスのニーズが高まっています。また、中国は世界の鉄鋼市場で主導的な地位を占めています。鉄鋼の生産には大量の窒素と酸素が必要であり、空気分離装置はこれらのガスを製鋼プロセスに供給するために極めて重要です。例えば、中国鉄鋼協会(CISA)によると、中国は1日平均295万4,000トンの鉄鋼を生産し、7月の平均から0.8%、前年比9.1%増加しました。したがって、前述の統計は予測期間中の市場成長を促進します。
空気分離装置市場-競合情勢:
この非常に細分化された分野では、多数の小規模から大規模の生産業者と供給業者の間で市場シェアをめぐる熾烈な競争が繰り広げられています。この細分化は、消費者に豊富な機器とカスタマイズオプションを提供しながら、一定の業界需要を満たしています。市場参入企業は、M&A、新たな生産施設の建設、地域拡大活動などの戦略を通じて企業の成長を図り、さまざまな分野からの需要の高まりに対応しています。
目次
第1章 空気分離装置市場概要
- 調査範囲
- 市場推定年数
第2章 エグゼクティブサマリー
- 市場内訳
- 競合考察
第3章 空気分離装置の主要な市場動向
- 市場促進要因
- 市場抑制要因
- 市場機会
- 今後の市場動向
第4章 空気分離装置業界の調査
- PEST分析
- ポーターのファイブフォース分析
- 成長見通しのマッピング
- 規制枠組みの分析
第5章 空気分離装置市場:COVID-19の影響分析
- COVID-19以前の影響分析
- COVID-19以後の影響分析
第6章 空気分離装置市場情勢
- 空気分離装置市場シェア分析、2022年
- 主要メーカー別の内訳データ
- 既存企業の分析
- 新興企業の分析
第7章 空気分離装置市場:ガス別
- 概要
- ガス別セグメントシェア分析
- 窒素
- 酸素
- アルゴン
- その他
第8章 空気分離装置市場:プロセス別
- 概要
- プロセス別セグメントシェア分析
- 極低温
- 非極低温
第9章 空気分離装置市場:最終用途別
- 概要
- 最終用途別のセグメントシェア分析
- 鉄鋼
- 石油ガス
- 化学薬品
- ヘルスケア
- その他
第10章 空気分離装置市場:地域別
- イントロダクション
- 北米
- 概要
- 北米の主要メーカー
- 米国
- カナダ
- 欧州
- 概要
- 欧州の主要メーカー
- ドイツ
- イタリア
- 英国
- フランス
- ロシア
- オランダ
- スウェーデン
- ポーランド
- その他
- アジア太平洋地域(APAC)
- 概要
- アジア太平洋地域の主要メーカー
- インド
- 中国
- 日本
- 韓国
- オーストラリア
- タイ
- インドネシア
- フィリピン
- その他
- ラテンアメリカ
- 概要
- ラテンアメリカの主要メーカー
- ブラジル
- メキシコ
- アルゼンチン
- コロンビア
- その他
- 中東・アフリカ
- 概要
- 中東・アフリカの主要メーカー
- サウジアラビア
- アラブ首長国連邦
- イスラエル
- トルコ
- アルジェリア
- エジプト
- その他
第11章 主要ベンダー分析- 空気分離装置業界
- 競合ダッシュボード
- 企業プロファイル
- Air Products and Chemicals, Inc.
- AMCS Corporation
- Air Liquide SA
- Air Water Inc.
- China Air Separation Equipment Co., Ltd.
- Daesung Industrial Co., Ltd.
- CRYOTEC Anlagenbau GmbH
- Enerflex Ltd.
- Gas Engineering, LLC
- Gulf Gases, Inc.
- Hangzhou Hangyang Co., Ltd.
- Linde Plc
- Messer Group GmbH
- NOVAIR MEDICAL
- Phoenix Corporation
- Praxair Technology, Inc.
第12章 アナリストの全方位展望
List of Tables
- TABLE List of data sources
- TABLE Market drivers; Impact Analysis
- TABLE Market restraints; Impact Analysis
- TABLE Air Separation Plant Market: Gas Snapshot (2022)
- TABLE Segment Dashboard; Definition and Scope, by Gas
- TABLE Global Air Separation Plant Market, by Gas 2018-2030 (USD Million)
- TABLE Air Separation Plant Market: Process Snapshot (2022)
- TABLE Segment Dashboard; Definition and Scope, by Process
- TABLE Global Air Separation Plant Market, by Process 2018-2030 (USD Million)
- TABLE Air Separation Plant Market: End-use Snapshot (2022)
- TABLE Segment Dashboard; Definition and Scope, by End-use
- TABLE Global Air Separation Plant Market, by End-use 2018-2030 (USD Million)
- TABLE Air Separation Plant Market: Regional snapshot (2022)
- TABLE Segment Dashboard; Definition and Scope, by Region
- TABLE Global Air Separation Plant Market, by Region 2018-2030 (USD Million)
- TABLE North America Air Separation Plant Market, by Country, 2018-2030 (USD Million)
- TABLE North America Air Separation Plant Market, by Gas, 2018-2030 (USD Million)
- TABLE North America Air Separation Plant Market, by Process, 2018-2030 (USD Million)
- TABLE North America Air Separation Plant Market, by End-use, 2018-2030 (USD Million)
- TABLE Europe Air Separation Plant Market, by Country, 2018-2030 (USD Million)
- TABLE Europe Air Separation Plant Market, by Gas, 2018-2030 (USD Million)
- TABLE Europe Air Separation Plant Market, by Process, 2018-2030 (USD Million)
- TABLE Europe Air Separation Plant Market, by End-use, 2018-2030 (USD Million)
- TABLE Asia Pacific Air Separation Plant Market, by Country, 2018-2030 (USD Million)
- TABLE Asia Pacific Air Separation Plant Market, by Gas, 2018-2030 (USD Million)
- TABLE Asia Pacific Air Separation Plant Market, by Process, 2018-2030 (USD Million)
- TABLE Asia Pacific Air Separation Plant Market, by End-use, 2018-2030 (USD Million)
- TABLE Latin America Air Separation Plant Market, by Country, 2018-2030 (USD Million)
- TABLE Latin America Air Separation Plant Market, by Gas, 2018-2030 (USD Million)
- TABLE Latin America Air Separation Plant Market, by Process, 2018-2030 (USD Million)
- TABLE Latin America Air Separation Plant Market, by End-use, 2018-2030 (USD Million)
- TABLE Middle East and Africa Air Separation Plant Market, by Country, 2018-2030 (USD Million)
- TABLE Middle East and Africa Air Separation Plant Market, by Gas, 2018-2030 (USD Million)
- TABLE Middle East and Africa Air Separation Plant Market, by Process, 2018-2030 (USD Million)
- TABLE Middle East and Africa Air Separation Plant Market, by End-use, 2018-2030 (USD Million)
REPORT HIGHLIGHT
Air Separation Plant Market size was valued at USD 6,856.5 Million in 2022, expanding at a CAGR of 4.5% from 2023 to 2030.
An abundance of industrial gases, including nitrogen, argon, oxygen, and other rare gases, are produced in air separation plants. facilities of all sizes, small and large, employ these separation plants to create liquid products and gasses.
Air Separation Plant Market- Market Dynamics
Rising demand for industrial gases from various industries drives market expansion
The air separation plant industry is mostly driven by the growing need for industrial gases in an array of end-use industries, including healthcare, metallurgy, chemicals, food and beverage, and oil and gas. Industrial gases are used as feedstock for the synthesis of various chemicals and in many other applications, such as welding, metal manufacturing, and chemical processing. Medical applications that include respiratory therapy, anesthesia, and the treatment of various medical conditions include the use of industrial gases like oxygen and nitrogen. Medical oxygen demand increased significantly during the COVID-19 pandemic, underscoring the critical role that industrial gases play in the healthcare industry. The metallurgy industry uses industrial gases like nitrogen and oxygen to make steel and other metals. Utilizing industrial gases reduces emissions while improving manufacturing process quality and efficiency. In the chemical industry, industrial gases are utilized as feedstocks to create a wide range of chemicals, including plastics, polymers, and fertilizers. Industrial gases like nitrogen and hydrogen are used as reducing agents in chemical reactions. Overall, the growing requirement for industrial gases across a range of end-use industries is a major force behind the air separation plant industry as it creates a steady demand for the production of industrial gases.
Air Separation Plant Market- Key Insights
- The Air Separation Plant industry is projected to grow at a significant rate due to the growing demand for industrial gases in various end-use industry
- Based on gas segmentation, the nitrogen segment captures a significant market share during the forecast period
- Based on process segmentation, the cryogenic segment is expected to dominate the market during the forecast period
- Based on end-use segmentation, the iron & steel segment is expected to capture a substantial market share over the forecast period
- Based on region, the Asia Pacific is expected to dominate the market during the forecast period
Air Separation Plant Market- Segmentation Analysis:
The Global Air Separation Plant Market is segmented based on Gas, Process, End-use, and Region.
Based on the gas, the market is bifurcated into nitrogen, oxygen, argon and others. The nitrogen segment captures a significant market share during the forecast period. Many industrial sectors, such as metallurgy, electronics manufacturing, petrochemicals, and chemicals, depend on nitrogen gas. The need for nitrogen gas is driven by the expansion of these sectors. Furthermore, the need for industrial gases-including nitrogen-to support infrastructure development and industry is growing as a result of the fast industrialization of emerging nations.
Based on the process, the industry is segmented into cryogenic and non-cryogenic. The cryogenic segment is expected to dominate the market during the forecast period. Cryogenic air separation plant demand is driven by the growth of businesses such as chemicals, steel, and healthcare, as well as by increased industrialization. Cryogenic procedures are also a popular option in sectors that value sustainability since they can comply with stringent environmental laws and emission limits.
Based on the end-use, the market is bifurcated into iron & steel, oil & gas, chemical, healthcare and others. The iron & steel segment is expected to capture a substantial market share over the forecast period. The iron and steel industry is a key consumer of industrial gases, particularly oxygen. Oxygen is used in the steelmaking process to enhance combustion and increase efficiency. It is commonly injected into blast furnaces to improve the production of pig iron, a crucial intermediate product in steel manufacturing.
Air Separation Plant Market- Geographical Insights
Geographically, this market is widespread in the regions of North America, Latin America, Europe, Asia Pacific, and the Middle East and Africa. These regions are further divided as per the nations bringing business. The Asia Pacific is expected to dominate the market during the forecast period. The need for industrial gases has grown across several industries, including electronics, steel, and chemicals, as a result of the quick industrialization and economic expansion of nations like China and India. In addition, China holds a leading position in the world steel market. Large volumes of nitrogen and oxygen are needed to produce steel, and air separation plants are crucial for providing these gases to the steelmaking process. For instance, China produced 2.954 million tons of steel on average each day, up 0.8% from July's average and 9.1% from the previous year, according to the China Iron and Steel Association (CISA). Thus, the aforementioned stats drive the market growth during the forecast period.
Air Separation Plant Market- Competitive Landscape:
There is fierce competition for market share among the many small- to large-scale producers and suppliers in this highly fragmented sector. This fragmentation meets certain industry demands while providing consumers with a large array of equipment and customization options. The market participants are seeking corporate growth through strategies including mergers and acquisitions, the construction of new production facilities, and regional expansion activities to fulfil the growing demand from a varied range of sectors.
Recent Developments:
In February 2023, Epiluvac AB was purchased by Veeco Instruments Inc. to work with Epiluvac's technological platform. Veeco's worldwide go-to-market abilities should thus demonstrate notable long-term growth.
SCOPE OF THE REPORT
The scope of this report covers the market by its major segments, which include as follows:
GLOBAL AIR SEPARATION PLANT MARKET KEY PLAYERS
- Air Products and Chemicals, Inc.
- AMCS Corporation
- Air Liquide SA
- Air Water Inc.
- China Air Separation Equipment Co., Ltd.
- Daesung Industrial Co., Ltd.
- CRYOTEC Anlagenbau GmbH
- Enerflex Ltd.
- Gas Engineering, LLC
- Gulf Gases, Inc.
- Hangzhou Hangyang Co., Ltd.
- Linde Plc
- Messer Group GmbH
- NOVAIR MEDICAL
- Phoenix Corporation
- Praxair Technology, Inc.
GLOBAL AIR SEPARATION PLANT MARKET, BY GAS
- Nitrogen
- Oxygen
- Argon
- Others
GLOBAL AIR SEPARATION PLANT MARKET, BY PROCESS
- Cryogenic
- Non-cryogenic
GLOBAL AIR SEPARATION PLANT MARKET, BY END-USE
- Iron & steel
- Oil & Gas
- Chemical
- Healthcare
- Others
GLOBAL AIR SEPARATION PLANT MARKET, BY REGION
- North America
- The U.S.
- Canada
- Europe
- Germany
- France
- Italy
- Spain
- United Kingdom
- Russia
- Netherlands
- Sweden
- Poland
- Rest of Europe
- Asia Pacific
- India
- China
- South Korea
- Japan
- Australia
- Thailand
- Indonesia
- Philippines
- Rest of APAC
- Latin America
- Brazil
- Mexico
- Argentina
- Colombia
- Rest of LATAM
- The Middle East and Africa
- Saudi Arabia
- United Arab Emirates
- Israel
- Turkey
- Algeria
- Egypt
- Rest of MEA
Table of Contents
1. Air Separation Plant Market Overview
- 1.1. Study Scope
- 1.2. Market Estimation Years
2. Executive Summary
- 2.1. Market Snippet
- 2.1.1. Air Separation Plant Market Snippet by Gas
- 2.1.2. Air Separation Plant Market Snippet by Process
- 2.1.3. Air Separation Plant Market Snippet by End-use
- 2.1.4. Air Separation Plant Market Snippet by Country
- 2.1.5. Air Separation Plant Market Snippet by Region
- 2.2. Competitive Insights
3. Air Separation Plant Key Market Trends
- 3.1. Air Separation Plant Market Drivers
- 3.1.1. Impact Analysis of Market Drivers
- 3.2. Air Separation Plant Market Restraints
- 3.2.1. Impact Analysis of Market Restraints
- 3.3. Air Separation Plant Market Opportunities
- 3.4. Air Separation Plant Market Future Trends
4. Air Separation Plant Industry Study
- 4.1. PEST Analysis
- 4.2. Porter's Five Forces Analysis
- 4.3. Growth Prospect Mapping
- 4.4. Regulatory Framework Analysis
5. Air Separation Plant Market: COVID-19 Impact Analysis
- 5.1. Pre-COVID-19 Impact Analysis
- 5.2. Post-COVID-19 Impact Analysis
- 5.2.1. Top Performing Segments
- 5.2.2. Marginal Growth Segments
- 5.2.3. Top Looser Segments
- 5.2.4. Marginal Loss Segments
6. Air Separation Plant Market Landscape
- 6.1. Air Separation Plant Market Share Analysis, 2022
- 6.2. Breakdown Data, by Key Manufacturer
- 6.2.1. Established Players' Analysis
- 6.2.2. Emerging Players' Analysis
7. Air Separation Plant Market - By Gas
- 7.1. Overview
- 7.1.1. Segment Share Analysis, By Gas, 2022 & 2030 (%)
- 7.1.2. Nitrogen
- 7.1.3. Oxygen
- 7.1.4. Argon
- 7.1.5. Others
8. Air Separation Plant Market - By Process
- 8.1. Overview
- 8.1.1. Segment Share Analysis, By Process, 2022 & 2030 (%)
- 8.1.2. Cryogenic
- 8.1.3. Non-cryogenic
9. Air Separation Plant Market - By End-use
- 9.1. Overview
- 9.1.1. Segment Share Analysis, By End-use, 2022 & 2030 (%)
- 9.1.2. Iron & steel
- 9.1.3. Oil & Gas
- 9.1.4. Chemical
- 9.1.5. Healthcare
- 9.1.6. Others
10. Air Separation Plant Market- By Geography
- 10.1. Introduction
- 10.1.1. Segment Share Analysis, By Geography, 2022 & 2030 (%)
- 10.2. North America
- 10.2.1. Overview
- 10.2.2. Air Separation Plant Key Manufacturers in North America
- 10.2.3. North America Market Size and Forecast, By Country, 2018 - 2030 (US$ Million)
- 10.2.4. North America Market Size and Forecast, By Gas, 2018 - 2030 (US$ Million)
- 10.2.5. North America Market Size and Forecast, By Process, 2018 - 2030 (US$ Million)
- 10.2.6. North America Market Size and Forecast, By End-use, 2018 - 2030 (US$ Million)
- 10.2.7. U.S.
- 10.2.7.1. Overview
- 10.2.7.2. Market Analysis, Forecast, and Y-O-Y Growth Rate, 2018 - 2030, (US$ Million)
- 10.2.7.3. U.S. Market Size and Forecast, By Gas, 2018 - 2030 (US$ Million)
- 10.2.7.4. U.S. Market Size and Forecast, By Process, 2018 - 2030 (US$ Million)
- 10.2.7.5. U.S. Market Size and Forecast, By End-use, 2018 - 2030 (US$ Million)
- 10.2.8. Canada
- 10.2.8.1. Overview
- 10.2.8.2. Market Analysis, Forecast, and Y-O-Y Growth Rate, 2018 - 2030, (US$ Million)
- 10.2.8.3. Canada Market Size and Forecast, By Gas, 2018 - 2030 (US$ Million)
- 10.2.8.4. Canada Market Size and Forecast, By Process, 2018 - 2030 (US$ Million)
- 10.2.8.5. Canada Market Size and Forecast, By End-use, 2018 - 2030 (US$ Million)
- 10.3. Europe
- 10.3.1. Overview
- 10.3.2. Air Separation Plant Key Manufacturers in Europe
- 10.3.3. Europe Market Size and Forecast, By Country, 2018 - 2030 (US$ Million)
- 10.3.4. Europe Market Size and Forecast, By Gas, 2018 - 2030 (US$ Million)
- 10.3.5. Europe Market Size and Forecast, By Process, 2018 - 2030 (US$ Million)
- 10.3.6. Europe Market Size and Forecast, By End-use, 2018 - 2030 (US$ Million)
- 10.3.7. Germany
- 10.3.7.1. Overview
- 10.3.7.2. Market Analysis, Forecast, and Y-O-Y Growth Rate, 2018 - 2030, (US$ Million)
- 10.3.7.3. Germany Market Size and Forecast, By Gas, 2018 - 2030 (US$ Million)
- 10.3.7.4. Germany Market Size and Forecast, By Process, 2018 - 2030 (US$ Million)
- 10.3.7.5. Germany Market Size and Forecast, By End-use, 2018 - 2030 (US$ Million)
- 10.3.8. Italy
- 10.3.8.1. Overview
- 10.3.8.2. Market Analysis, Forecast, and Y-O-Y Growth Rate, 2018 - 2030, (US$ Million)
- 10.3.8.3. Italy Market Size and Forecast, By Gas, 2018 - 2030 (US$ Million)
- 10.3.8.4. Italy Market Size and Forecast, By Process, 2018 - 2030 (US$ Million)
- 10.3.8.5. Italy Market Size and Forecast, By End-use, 2018 - 2030 (US$ Million)
- 10.3.9. United Kingdom
- 10.3.9.1. Overview
- 10.3.9.2. Market Analysis, Forecast, and Y-O-Y Growth Rate, 2018 - 2030, (US$ Million)
- 10.3.9.3. United Kingdom Market Size and Forecast, By Gas, 2018 - 2030 (US$ Million)
- 10.3.9.4. United Kingdom Market Size and Forecast, By Process, 2018 - 2030 (US$ Million)
- 10.3.9.5. United Kingdom Market Size and Forecast, By End-use, 2018 - 2030 (US$ Million)
- 10.3.10. France
- 10.3.10.1. Overview
- 10.3.10.2. Market Analysis, Forecast, and Y-O-Y Growth Rate, 2018 - 2030, (US$ Million)
- 10.3.10.3. France Market Size and Forecast, By Gas, 2018 - 2030 (US$ Million)
- 10.3.10.4. France Market Size and Forecast, By Process, 2018 - 2030 (US$ Million)
- 10.3.10.5. France Market Size and Forecast, By End-use, 2018 - 2030 (US$ Million)
- 10.3.11. Russia
- 10.3.11.1. Market Analysis, Forecast, and Y-O-Y Growth Rate, 2018 - 2030, (US$ Million)
- 10.3.11.2. Russia Market Size and Forecast, By Gas, 2018 - 2030 (US$ Million)
- 10.3.11.3. Russia Market Size and Forecast, By Process, 2018 - 2030 (US$ Million)
- 10.3.11.4. Russia Market Size and Forecast, By End-use, 2018 - 2030 (US$ Million)
- 10.3.12. Netherlands
- 10.3.12.1. Market Analysis, Forecast, and Y-O-Y Growth Rate, 2018 - 2030, (US$ Million)
- 10.3.12.2. Netherlands Market Size and Forecast, By Gas, 2018 - 2030 (US$ Million)
- 10.3.12.3. Netherlands Market Size and Forecast, By Process, 2018 - 2030 (US$ Million)
- 10.3.12.4. Netherlands Market Size and Forecast, By End-use, 2018 - 2030 (US$ Million)
- 10.3.13. Sweden
- 10.3.13.1. Market Analysis, Forecast, and Y-O-Y Growth Rate, 2018 - 2030, (US$ Million)
- 10.3.13.2. Sweden Market Size and Forecast, By Gas, 2018 - 2030 (US$ Million)
- 10.3.13.3. Sweden Market Size and Forecast, By Process, 2018 - 2030 (US$ Million)
- 10.3.13.4. Sweden Market Size and Forecast, By End-use, 2018 - 2030 (US$ Million)
- 10.3.14. Poland
- 10.3.14.1. Market Analysis, Forecast, and Y-O-Y Growth Rate, 2018 - 2030, (US$ Million)
- 10.3.14.2. Poland Market Size and Forecast, By Gas, 2018 - 2030 (US$ Million)
- 10.3.14.3. Poland Market Size and Forecast, By Process, 2018 - 2030 (US$ Million)
- 10.3.14.4. Poland Market Size and Forecast, By End-use, 2018 - 2030 (US$ Million)
- 10.3.15. Rest of Europe
- 10.3.15.1. Overview
- 10.3.15.2. Market Analysis, Forecast, and Y-O-Y Growth Rate, 2018 - 2030, (US$ Million)
- 10.3.15.3. Rest of the Europe Market Size and Forecast, By Gas, 2018 - 2030 (US$ Million)
- 10.3.15.4. Rest of the Europe Market Size and Forecast, By Process, 2018 - 2030 (US$ Million)
- 10.3.15.5. Rest of the Europe Market Size and Forecast, By End-use, 2018 - 2030 (US$ Million)
- 10.4. Asia Pacific (APAC)
- 10.4.1. Overview
- 10.4.2. Air Separation Plant Key Manufacturers in Asia Pacific
- 10.4.3. Asia Pacific Market Size and Forecast, By Country, 2018 - 2030 (US$ Million)
- 10.4.4. Asia Pacific Market Size and Forecast, By Gas, 2018 - 2030 (US$ Million)
- 10.4.5. Asia Pacific Market Size and Forecast, By Process, 2018 - 2030 (US$ Million)
- 10.4.6. Asia Pacific Market Size and Forecast, By End-use, 2018 - 2030 (US$ Million)
- 10.4.7. India
- 10.4.7.1. Overview
- 10.4.7.2. Market Analysis, Forecast, and Y-O-Y Growth Rate, 2018 - 2030, (US$ Million)
- 10.4.7.3. India Market Size and Forecast, By Gas, 2018 - 2030 (US$ Million)
- 10.4.7.4. India Market Size and Forecast, By Process, 2018 - 2030 (US$ Million)
- 10.4.7.5. India Market Size and Forecast, By End-use, 2018 - 2030 (US$ Million)
- 10.4.8. China
- 10.4.8.1. Overview
- 10.4.8.2. Market Analysis, Forecast, and Y-O-Y Growth Rate, 2018 - 2030, (US$ Million)
- 10.4.8.3. China Market Size and Forecast, By Gas, 2018 - 2030 (US$ Million)
- 10.4.8.4. China Market Size and Forecast, By Process, 2018 - 2030 (US$ Million)
- 10.4.8.5. China Market Size and Forecast, By End-use, 2018 - 2030 (US$ Million)
- 10.4.9. Japan
- 10.4.9.1. Overview
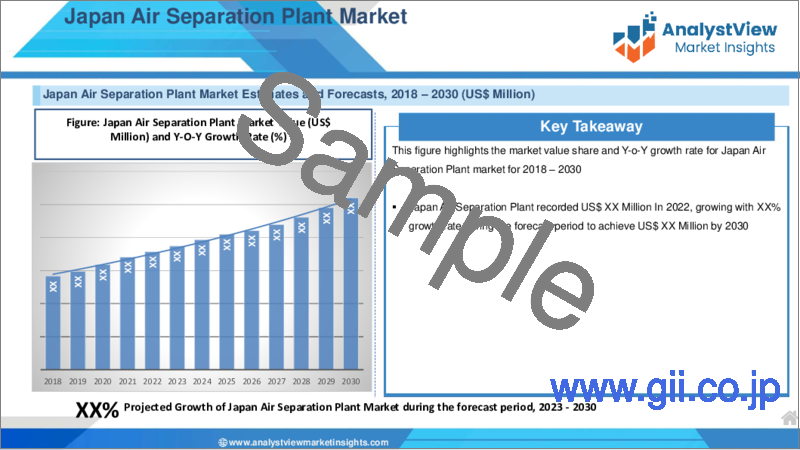
- 10.4.9.2. Market Analysis, Forecast, and Y-O-Y Growth Rate, 2018 - 2030, (US$ Million)
- 10.4.9.3. Japan Market Size and Forecast, By Gas, 2018 - 2030 (US$ Million)
- 10.4.9.4. Japan Market Size and Forecast, By Process, 2018 - 2030 (US$ Million)
- 10.4.9.5. Japan Market Size and Forecast, By End-use, 2018 - 2030 (US$ Million)
- 10.4.10. South Korea
- 10.4.10.1. Overview
- 10.4.10.2. Market Analysis, Forecast, and Y-O-Y Growth Rate, 2018 - 2030, (US$ Million)
- 10.4.10.3. South Korea Market Size and Forecast, By Gas, 2018 - 2030 (US$ Million)
- 10.4.10.4. South Korea Market Size and Forecast, By Process, 2018 - 2030 (US$ Million)
- 10.4.10.5. South Korea Market Size and Forecast, By End-use, 2018 - 2030 (US$ Million)
- 10.4.11. Australia
- 10.4.11.1. Overview
- 10.4.11.2. Market Analysis, Forecast, and Y-O-Y Growth Rate, 2018 - 2030, (US$ Million)
- 10.4.11.3. Australia Market Size and Forecast, By Gas, 2018 - 2030 (US$ Million)
- 10.4.11.4. Australia Market Size and Forecast, By Process, 2018 - 2030 (US$ Million)
- 10.4.11.5. Australia Market Size and Forecast, By End-use, 2018 - 2030 (US$ Million)
- 10.4.12. Thailand
- 10.4.12.1. Overview
- 10.4.12.2. Market Analysis, Forecast, and Y-O-Y Growth Rate, 2018 - 2030, (US$ Million)
- 10.4.12.3. Thailand Market Size and Forecast, By Gas, 2018 - 2030 (US$ Million)
- 10.4.12.4. Thailand Market Size and Forecast, By Process, 2018 - 2030 (US$ Million)
- 10.4.12.5. Thailand Market Size and Forecast, By End-use, 2018 - 2030 (US$ Million)
- 10.4.13. Indonesia
- 10.4.13.1. Overview
- 10.4.13.2. Market Analysis, Forecast, and Y-O-Y Growth Rate, 2018 - 2030, (US$ Million)
- 10.4.13.3. Indonesia Market Size and Forecast, By Gas, 2018 - 2030 (US$ Million)
- 10.4.13.4. Indonesia Market Size and Forecast, By Process, 2018 - 2030 (US$ Million)
- 10.4.13.5. Indonesia Market Size and Forecast, By End-use, 2018 - 2030 (US$ Million)
- 10.4.14. Philippines
- 10.4.14.1. Overview
- 10.4.14.2. Market Analysis, Forecast, and Y-O-Y Growth Rate, 2018 - 2030, (US$ Million)
- 10.4.14.3. Philippines Market Size and Forecast, By Gas, 2018 - 2030 (US$ Million)
- 10.4.14.4. Philippines Market Size and Forecast, By Process, 2018 - 2030 (US$ Million)
- 10.4.14.5. Philippines Market Size and Forecast, By End-use, 2018 - 2030 (US$ Million)
- 10.4.15. Rest of APAC
- 10.4.15.1. Overview
- 10.4.15.2. Market Analysis, Forecast, and Y-O-Y Growth Rate, 2018 - 2030, (US$ Million)
- 10.4.15.3. Rest of APAC Market Size and Forecast, By Gas, 2018 - 2030 (US$ Million)
- 10.4.15.4. Rest of APAC Market Size and Forecast, By Process, 2018 - 2030 (US$ Million)
- 10.4.15.5. Rest of APAC Market Size and Forecast, By End-use, 2018 - 2030 (US$ Million)
- 10.5. Latin America
- 10.5.1. Overview
- 10.5.2. Air Separation Plant Key Manufacturers in Latin America
- 10.5.3. Latin America Market Size and Forecast, By Country, 2018 - 2030 (US$ Million)
- 10.5.4. Latin America Market Size and Forecast, By Gas, 2018 - 2030 (US$ Million)
- 10.5.5. Latin America Market Size and Forecast, By Process, 2018 - 2030 (US$ Million)
- 10.5.6. Latin America Market Size and Forecast, By End-use, 2018 - 2030 (US$ Million)
- 10.5.7. Brazil
- 10.5.7.1. Overview
- 10.5.7.2. Market Analysis, Forecast, and Y-O-Y Growth Rate, 2018 - 2030, (US$ Million)
- 10.5.7.3. Brazil Market Size and Forecast, By Gas, 2018 - 2030 (US$ Million)
- 10.5.7.4. Brazil Market Size and Forecast, By Process, 2018 - 2030 (US$ Million)
- 10.5.7.5. Brazil Market Size and Forecast, By End-use, 2018 - 2030 (US$ Million)
- 10.5.8. Mexico
- 10.5.8.1. Overview
- 10.5.8.2. Market Analysis, Forecast, and Y-O-Y Growth Rate, 2018 - 2030, (US$ Million)
- 10.5.8.3. Mexico Market Size and Forecast, By Gas, 2018 - 2030 (US$ Million)
- 10.5.8.4. Mexico Market Size and Forecast, By Process, 2018 - 2030 (US$ Million)
- 10.5.8.5. Mexico Market Size and Forecast, By End-use, 2018 - 2030 (US$ Million)
- 10.5.9. Argentina
- 10.5.9.1. Overview
- 10.5.9.2. Market Analysis, Forecast, and Y-O-Y Growth Rate, 2018 - 2030, (US$ Million)
- 10.5.9.3. Argentina Market Size and Forecast, By Gas, 2018 - 2030 (US$ Million)
- 10.5.9.4. Argentina Market Size and Forecast, By Process, 2018 - 2030 (US$ Million)
- 10.5.9.5. Argentina Market Size and Forecast, By End-use, 2018 - 2030 (US$ Million)
- 10.5.10. Colombia
- 10.5.10.1. Overview
- 10.5.10.2. Market Analysis, Forecast, and Y-O-Y Growth Rate, 2018 - 2030, (US$ Million)
- 10.5.10.3. Colombia Market Size and Forecast, By Gas, 2018 - 2030 (US$ Million)
- 10.5.10.4. Colombia Market Size and Forecast, By Process, 2018 - 2030 (US$ Million)
- 10.5.10.5. Colombia Market Size and Forecast, By End-use, 2018 - 2030 (US$ Million)
- 10.5.11. Rest of LATAM
- 10.5.11.1. Overview
- 10.5.11.2. Market Analysis, Forecast, and Y-O-Y Growth Rate, 2018 - 2030, (US$ Million)
- 10.5.11.3. Rest of LATAM Market Size and Forecast, By Gas, 2018 - 2030 (US$ Million)
- 10.5.11.4. Rest of LATAM Market Size and Forecast, By Process, 2018 - 2030 (US$ Million)
- 10.5.11.5. Rest of LATAM Market Size and Forecast, By End-use, 2018 - 2030 (US$ Million)
- 10.6. Middle East and Africa
- 10.6.1. Overview
- 10.6.2. Air Separation Plant Key Manufacturers in Middle East and Africa
- 10.6.3. Middle East and Africa Market Size and Forecast, By Country, 2018 - 2030 (US$ Million)
- 10.6.4. Middle East and Africa Market Size and Forecast, By Gas, 2018 - 2030 (US$ Million)
- 10.6.5. Middle East and Africa Market Size and Forecast, By Process, 2018 - 2030 (US$ Million)
- 10.6.6. Middle East and Africa Market Size and Forecast, By End-use, 2018 - 2030 (US$ Million)
- 10.6.7. Saudi Arabia
- 10.6.7.1. Overview
- 10.6.7.2. Market Analysis, Forecast, and Y-O-Y Growth Rate, 2018 - 2030, (US$ Million)
- 10.6.7.3. Saudi Arabia Market Size and Forecast, By Gas, 2018 - 2030 (US$ Million)
- 10.6.7.4. Saudi Arabia Market Size and Forecast, By Process, 2018 - 2030 (US$ Million)
- 10.6.7.5. Saudi Arabia Market Size and Forecast, By End-use, 2018 - 2030 (US$ Million)
- 10.6.8. United Arab Emirates
- 10.6.8.1. Overview
- 10.6.8.2. Market Analysis, Forecast, and Y-O-Y Growth Rate, 2018 - 2030, (US$ Million)
- 10.6.8.3. United Arab Emirates Market Size and Forecast, By Gas, 2018 - 2030 (US$ Million)
- 10.6.8.4. United Arab Emirates Market Size and Forecast, By Process, 2018 - 2030 (US$ Million)
- 10.6.8.5. United Arab Emirates Market Size and Forecast, By End-use, 2018 - 2030 (US$ Million)
- 10.6.9. Israel
- 10.6.9.1. Overview
- 10.6.9.2. Market Analysis, Forecast, and Y-O-Y Growth Rate, 2018 - 2030, (US$ Million)
- 10.6.9.3. Israel Market Size and Forecast, By Gas, 2018 - 2030 (US$ Million)
- 10.6.9.4. Israel Market Size and Forecast, By Process, 2018 - 2030 (US$ Million)
- 10.6.9.5. Israel Market Size and Forecast, By End-use, 2018 - 2030 (US$ Million)
- 10.6.10. Turkey
- 10.6.10.1. Overview
- 10.6.10.2. Market Analysis, Forecast, and Y-O-Y Growth Rate, 2018 - 2030, (US$ Million)
- 10.6.10.3. Turkey Market Size and Forecast, By Gas, 2018 - 2030 (US$ Million)
- 10.6.10.4. Turkey Market Size and Forecast, By Process, 2018 - 2030 (US$ Million)
- 10.6.10.5. Turkey Market Size and Forecast, By End-use, 2018 - 2030 (US$ Million)
- 10.6.11. Algeria
- 10.6.11.1. Overview
- 10.6.11.2. Market Analysis, Forecast, and Y-O-Y Growth Rate, 2018 - 2030, (US$ Million)
- 10.6.11.3. Algeria Market Size and Forecast, By Gas, 2018 - 2030 (US$ Million)
- 10.6.11.4. Algeria Market Size and Forecast, By Process, 2018 - 2030 (US$ Million)
- 10.6.11.5. Algeria Market Size and Forecast, By End-use, 2018 - 2030 (US$ Million)
- 10.6.12. Egypt
- 10.6.12.1. Overview
- 10.6.12.2. Market Analysis, Forecast, and Y-O-Y Growth Rate, 2018 - 2030, (US$ Million)
- 10.6.12.3. Egypt Market Size and Forecast, By Gas, 2018 - 2030 (US$ Million)
- 10.6.12.4. Egypt Market Size and Forecast, By Process, 2018 - 2030 (US$ Million)
- 10.6.12.5. Egypt Market Size and Forecast, By End-use, 2018 - 2030 (US$ Million)
- 10.6.13. Rest of MEA
- 10.6.13.1. Overview
- 10.6.13.2. Market Analysis, Forecast, and Y-O-Y Growth Rate, 2018 - 2030, (US$ Million)
- 10.6.13.3. Rest of MEA Market Size and Forecast, By Gas, 2018 - 2030 (US$ Million)
- 10.6.13.4. Rest of MEA Market Size and Forecast, By Process, 2018 - 2030 (US$ Million)
- 10.6.13.5. Rest of MEA Market Size and Forecast, By End-use, 2018 - 2030 (US$ Million)
11. Key Vendor Analysis- Air Separation Plant Industry
- 11.1. Competitive Dashboard
- 11.2. Company Profiles
- 11.2.1. Air Products and Chemicals, Inc.
- 11.2.2. AMCS Corporation
- 11.2.3. Air Liquide SA
- 11.2.4. Air Water Inc.
- 11.2.5. China Air Separation Equipment Co., Ltd.
- 11.2.6. Daesung Industrial Co., Ltd.
- 11.2.7. CRYOTEC Anlagenbau GmbH
- 11.2.8. Enerflex Ltd.
- 11.2.9. Gas Engineering, LLC
- 11.2.10. Gulf Gases, Inc.
- 11.2.11. Hangzhou Hangyang Co., Ltd.
- 11.2.12. Linde Plc
- 11.2.13. Messer Group GmbH
- 11.2.14. NOVAIR MEDICAL
- 11.2.15. Phoenix Corporation
- 11.2.16. Praxair Technology, Inc.
12. 360 Degree Analyst View
13. Appendix
- 13.1. Research Methodology
- 13.2. References
- 13.3. Abbreviations
- 13.4. Disclaimer
- 13.5. Contact Us

