|
|
市場調査レポート
商品コード
1358243
電子・半導体用X線検査システム市場:部品別、画像技術別、用途別、国別、地域別- 産業分析、市場規模、市場シェア、2023-2030年予測X-ray Inspection Systems for Electronics & Semiconductors Market, By Component, By Imaging Technique, By Application, By Country, and By Region - Industry Analysis, Market Size, Market Share & Forecast from 2023-2030 |
||||||
|
|
|||||||
カスタマイズ可能
|
|||||||


| 電子・半導体用X線検査システム市場:部品別、画像技術別、用途別、国別、地域別- 産業分析、市場規模、市場シェア、2023-2030年予測 |
|
出版日: 2023年10月01日
発行: AnalystView Market Insights
ページ情報: 英文 303 Pages
納期: 2~3営業日
|

- 全表示
- 概要
- 図表
- 目次
レポートハイライト
電子機器・半導体向けX線検査システムの市場規模は2022年に4億8,510万米ドル、2023年から2030年にかけてCAGR 8.1%で拡大
電子・半導体向けX線検査システム市場- 市場力学:
- 資産の安全性確保を目的とした厳しい政府規制、品質基準に関する消費者意識の高まりが市場需要を促進
- 電子・半導体用X線検査システムは、資産の安全性確保を目的とした厳しい政府規制、品質基準に関する消費者意識の高まり、電子機器のデジタル化・自動化・小型化の普及が市場の成長を牽引しています。デジタルX線検査システムの自動化が進み、より効率的な検査が可能になったこと、X線検査システムが小型化され機動性が高まったことなどが、同市場のビジネスチャンスとなっています。
- さらに、ハードウェアの継続的な技術進歩により、X線検査システムの使い勝手が向上していることも、市場のメリットとなっています。また、いくつかの注目すべき動向も市場の成長に寄与しています。これには、X線検査システムにおける人工知能(AI)の応用拡大や、生産ラインでのCT(コンピュータ断層撮影)検査の採用増加などが含まれます。しかし、代替技術の利用可能性や、装置やメンテナンスにかかるコストの高さなど、市場拡大の妨げとなる要因もあります。さらに、有資格者の不足がこの市場の成長にとって大きな課題となっています。
電子・半導体用X線検査システム市場-セグメンテーション分析:
- 電子・半導体用X線検査システムの世界市場は、コンポーネント、イメージング技術、アプリケーション、地域によって区分されます。
- 市場はコンポーネントに基づいて3つのカテゴリーに分けられる:ハードウェア、ソフトウェア、消耗品、サービス。この成長は、ワークフロー管理や画像・信号処理など、さまざまな用途でX線検査ソフトウェアの利用が増加していることに起因しています。
- X線検査市場は、イメージング技術によって2つのカテゴリーに分けられる:フィルムベースイメージングとデジタルイメージングです。デジタルイメージング分野は大きな成長が見込まれ、予測期間中に最も高いCAGRを記録します。この成長の背景には、X線プロセスに伴う化学的危険性の低減、画像生成に必要な放射線の低減、画質の向上、処理時間の短縮、画像の共有と保存の容易さ、運用・保守コストの削減など、デジタルイメージングのいくつかの利点があります。
電子・半導体用X線検査システム市場- 地域別インサイト:
地理的には、北米、ラテンアメリカ、欧州、アジア太平洋、中東アフリカの各地域に広がっています。これらの地域は、ビジネスをもたらす国によってさらに分けられます。
電子・半導体用X線検査システム市場-競合情勢:
電子・半導体用X線検査システム市場では、各社が需要の拡大や技術の進歩に対応するため、さまざまな取り組みに積極的に取り組んでいます。大手企業は、X線検査システムの性能と機能を強化するため、研究開発に多額の投資を行っています。電子部品や半導体の欠陥を検出する効率と精度を高めるため、自動化機能の改善に注力しています。さらに、各社はX線検査システムの小型化に取り組み、可搬性と汎用性を高めることで、さまざまな生産工程に簡単に組み込むことができるようにしています。また、システムの操作や検査結果の解釈を簡素化することで、ユーザーの利便性を高めることも重要な課題となっています。
目次
第1章 電子・半導体向けX線検査装置市場概要
- 調査範囲
- 市場推定年数
第2章 エグゼクティブサマリー
- 市場内訳
- 競合考察
第3章 エレクトロニクスおよび半導体向けX線検査システムの主要な市場動向
- 市場促進要因
- 市場抑制要因
- 市場機会
- 今後の市場動向
第4章 エレクトロニクスおよび半導体産業向けのX線検査システムの研究
- PEST分析
- ポーターのファイブフォース分析
- 成長見通しのマッピング
- 規制枠組みの分析
第5章 エレクトロニクスおよび半導体市場向けX線検査システム:COVID-19感染症の影響分析
- 新型コロナウイルス感染症以前の影響分析
- 新型コロナウイルス感染症後の影響分析
第6章 エレクトロニクスおよび半導体向けX線検査システムの市場情勢
- エレクトロニクスおよび半導体向けX線検査システム市場シェア分析、2022年
- 主要メーカー別の内訳データ
- 既存企業の分析
- 新興企業の分析
第7章 エレクトロニクスおよび半導体市場向けX線検査システム- コンポーネント別
- 概要
- コンポーネント別のセグメントシェア分析
- ハードウェア
- ソフトウェア
- 消耗品
- サービス
第8章 エレクトロニクスおよび半導体市場向けX線検査システム- イメージング技術別
- 概要
- イメージング手法別のセグメントシェア分析
- フィルムベースのイメージング
- デジタルイメージング
第9章 エレクトロニクスおよび半導体市場向けX線検査システム- アプリケーション別
- 概要
- アプリケーション別のセグメントシェア分析
- 電子
- 半導体
第10章 エレクトロニクスおよび半導体市場向けX線検査システム-地域
- イントロダクション
- 北米
- 概要
- 北米の主要メーカー
- 米国
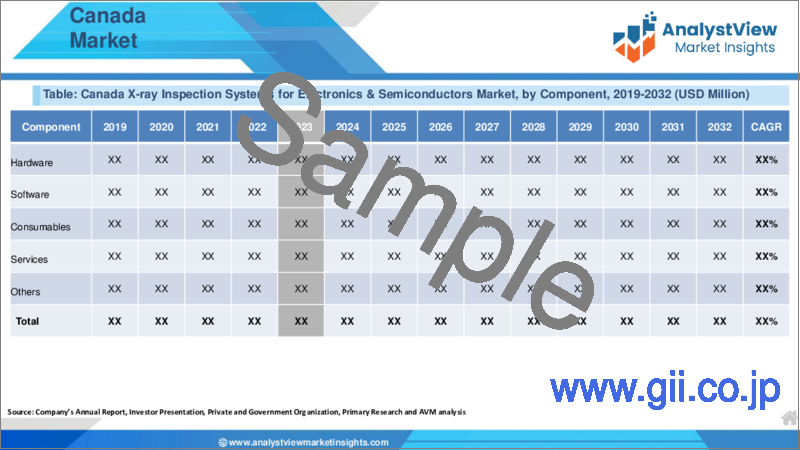
- カナダ
- 欧州
- 概要
- 欧州の主要メーカー
- ドイツ
- イタリア
- 英国
- フランス
- ロシア
- オランダ
- スウェーデン
- ポーランド
- その他
- アジア太平洋(APAC)
- 概要
- アジア太平洋地域の主要メーカー
- インド
- 中国
- 日本
- 韓国
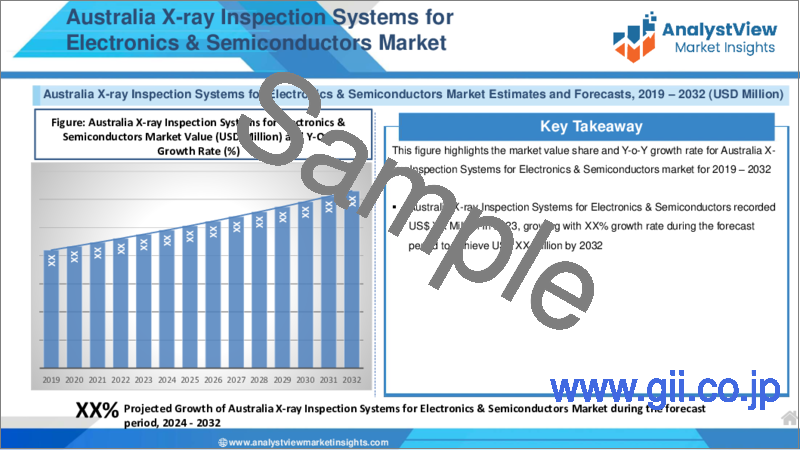
- オーストラリア
- タイ
- インドネシア
- フィリピン
- その他
- ラテンアメリカ
- 概要
- ラテンアメリカの主要メーカー
- ブラジル
- メキシコ
- アルゼンチン
- コロンビア
- その他
- 中東とアフリカ
- 概要
- 中東およびアフリカの主要メーカー
- サウジアラビア
- アラブ首長国連邦
- イスラエル
- トルコ
- アルジェリア
- エジプト
- その他
第11章 主要ベンダー分析- 電子および半導体業界向けのX線検査システム
- 競合ダッシュボード
- 企業プロファイル
- North Star Imaging Inc.
- Nikon Metrology, Inc.
- Nordson Corporation
- YXLON International GmbH
- VJ Group, Inc.
- Mettler Toledo International Inc.
- Ametek, Inc
- Viscom AG
- ViTrox Corporation Berhad
第12章 アナリストの全方位展望
List of Tables
- TABLE List of data sources
- TABLE Market drivers; Impact Analysis
- TABLE Market restraints; Impact Analysis
- TABLE X-ray Inspection Systems for Electronics & Semiconductors Market: Component Snapshot (2022)
- TABLE Segment Dashboard; Definition and Scope, by Component
- TABLE Global X-ray Inspection Systems for Electronics & Semiconductors Market, by Component 2018-2030 (USD Million)
- TABLE X-ray Inspection Systems for Electronics & Semiconductors Market: Imaging Technique Snapshot (2022)
- TABLE Segment Dashboard; Definition and Scope, by Imaging Technique
- TABLE Global X-ray Inspection Systems for Electronics & Semiconductors Market, by Imaging Technique 2018-2030 (USD Million)
- TABLE X-ray Inspection Systems for Electronics & Semiconductors Market: Applications Snapshot (2022)
- TABLE Segment Dashboard; Definition and Scope, by Applications
- TABLE Global X-ray Inspection Systems for Electronics & Semiconductors Market, by Applications 2018-2030 (USD Million)
- TABLE X-ray Inspection Systems for Electronics & Semiconductors Market: Regional snapshot (2022)
- TABLE Segment Dashboard; Definition and Scope, by Region
- TABLE Global X-ray Inspection Systems for Electronics & Semiconductors Market, by Region 2018-2030 (USD Million)
- TABLE North America X-ray Inspection Systems for Electronics & Semiconductors Market, by Country, 2018-2030 (USD Million)
- TABLE North America X-ray Inspection Systems for Electronics & Semiconductors Market, by Component, 2018-2030 (USD Million)
- TABLE North America X-ray Inspection Systems for Electronics & Semiconductors Market, by Imaging Technique, 2018-2030 (USD Million)
- TABLE North America X-ray Inspection Systems for Electronics & Semiconductors Market, by Applications, 2018-2030 (USD Million)
- TABLE Europe X-ray Inspection Systems for Electronics & Semiconductors Market, by Country, 2018-2030 (USD Million)
- TABLE Europe X-ray Inspection Systems for Electronics & Semiconductors Market, by Component, 2018-2030 (USD Million)
- TABLE Europe X-ray Inspection Systems for Electronics & Semiconductors Market, by Imaging Technique, 2018-2030 (USD Million)
- TABLE Europe X-ray Inspection Systems for Electronics & Semiconductors Market, by Applications, 2018-2030 (USD Million)
- TABLE Asia Pacific X-ray Inspection Systems for Electronics & Semiconductors Market, by Country, 2018-2030 (USD Million)
- TABLE Asia Pacific X-ray Inspection Systems for Electronics & Semiconductors Market, by Component, 2018-2030 (USD Million)
- TABLE Asia Pacific X-ray Inspection Systems for Electronics & Semiconductors Market, by Imaging Technique, 2018-2030 (USD Million)
- TABLE Asia Pacific X-ray Inspection Systems for Electronics & Semiconductors Market, by Applications, 2018-2030 (USD Million)
- TABLE Latin America X-ray Inspection Systems for Electronics & Semiconductors Market, by Country, 2018-2030 (USD Million)
- TABLE Latin America X-ray Inspection Systems for Electronics & Semiconductors Market, by Component, 2018-2030 (USD Million)
- TABLE Latin America X-ray Inspection Systems for Electronics & Semiconductors Market, by Imaging Technique, 2018-2030 (USD Million)
- TABLE Latin America X-ray Inspection Systems for Electronics & Semiconductors Market, by Applications, 2018-2030 (USD Million)
- TABLE Middle East and Africa X-ray Inspection Systems for Electronics & Semiconductors Market, by Country, 2018-2030 (USD Million)
- TABLE Middle East and Africa X-ray Inspection Systems for Electronics & Semiconductors Market, by Component, 2018-2030 (USD Million)
- TABLE Middle East and Africa X-ray Inspection Systems for Electronics & Semiconductors Market, by Imaging Technique, 2018-2030 (USD Million)
- TABLE Middle East and Africa X-ray Inspection Systems for Electronics & Semiconductors Market, by Applications, 2018-2030 (USD Million)
REPORT HIGHLIGHT
X-ray Inspection Systems for Electronics & Semiconductors Market size was valued at USD 485.1 Million in 2022, expanding at a CAGR of 8.1% from 2023 to 2030
X-ray Inspection Systems for Electronics & Semiconductors, also known as hydroelectric power plants, are facilities that generate electricity by harnessing the kinetic energy of flowing or falling water. They utilize the potential energy stored in water at a higher elevation to drive turbines, which then convert the water's energy into mechanical energy. This mechanical energy is further transformed into electrical energy with generators. X-ray Inspection Systems for Electronics & Semiconductors can vary in size and complexity, from small-scale installations in rivers and streams to large dams and reservoirs that can generate significant amounts of electricity
X-ray Inspection Systems for Electronics & Semiconductors Market - Market Dynamics:
- Strict government regulations aimed at ensuring asset safety, rising consumer awareness regarding quality standards to propel market demand
- The X-ray inspection systems for Electronics & semiconductors is witnessing growth driven by strict government regulations aimed at ensuring asset safety, rising consumer awareness regarding quality standards, and the widespread digitalization, automation, and miniaturization of electronic devices. Opportunities in the market arise from the increasing automation of digital X-ray inspection systems, making them more efficient, as well as the miniaturization of X-ray inspection systems for enhanced mobility.
- Moreover, the market benefits from the user-friendly nature of X-ray inspection systems due to continuous technological advancements in hardware. Several notable trends also contribute to the market's growth. These include the growing application of Artificial Intelligence (AI) in X-ray inspection systems and the increasing adoption of CT (Computed Tomography) inspection for production line applications. However, certain factors may hinder market expansion, such as the availability of substitute technologies and the high costs associated with equipment and maintenance. Additionally, the lack of qualified personnel poses a significant challenge for the growth of this market.
X-ray Inspection Systems for Electronics & Semiconductors Market - Key Insights:
- As per the analysis shared by our research analyst, the global X-ray Inspection Systems for Electronics & Semiconductors market is estimated to grow annually at a CAGR of around 8.1% over the forecast period (2023-2030)
- The X-ray Inspection Systems for Electronics & Semiconductors industry is projected to grow at a significant rate due to strict government regulations aimed at ensuring asset safety, rising consumer awareness regarding quality standards
- Based on component type segmentation, software segment is expect to record the fastest growth during the forecast period
- Based on Imaging Technique segmentation, digital imaging segment is expected to experience significant growth
- On the basis of region, North America was the leading revenue generator in 2022
X-ray Inspection Systems for Electronics & Semiconductors Market- Segmentation Analysis:
- The Global X-ray Inspection Systems for Electronics & Semiconductors Market is segmented on the basis of Component, Imaging Technique, application, and Region.
- The market is divided into three categories based on Component: Hardware, Software, Consumables and Services. In 2022 software segment is expect to record the fastest growth during the forecast period This growth can be attributed to the increasing utilization of X-ray inspection software in various applications, including workflow management and image & signal processing.
- The market is divided into two categories based on Imaging Technique: Film-based Imaging, Digital Imaging. The digital imaging segment is expected to experience significant growth, registering the highest CAGR during the forecast period. This growth is driven by several advantages of digital imaging, such as the reduction of chemical hazards associated with X-ray processes, lower radiation requirements for image production, improved image quality, faster processing time, easy image sharing & storage, and reduced operation & maintenance costs.
X-ray Inspection Systems for Electronics & Semiconductors Market - Geographical Insights:
Geographically, this market is widespread into the regions of North America, Latin America, Europe, Asia Pacific, and the Middle East and Africa. These regions are further divided as per the nations bringing business.
X-ray Inspection Systems for Electronics & Semiconductors Market- Competitive Landscape:
In the X-ray inspection systems for Electronics & semiconductors, companies are actively engaged in various initiatives to capitalize on the growing demand and technological advancements. Leading players are investing heavily in research and development to enhance the performance and capabilities of their X-ray inspection systems. They focus on improving automation features to increase efficiency and accuracy in detecting defects in electronic components and semiconductors. Moreover, companies are working on miniaturizing X-ray inspection systems to enhance their portability and versatility, allowing for easy integration into different production processes. User-friendliness remains a key area of focus, with efforts to simplify system operation and interpretation of inspection results
Recent Developments:
In June 2023, Minebea Intec introduced Dypipe, an advanced X-ray inspection system designed specifically for manufacturers of pumped goods. Dypipe is capable of efficiently detecting foreign bodies made of various materials such as metal, stone, plastic, bone, and glass. It ensures the detection and removal of defective or contaminated products, thereby guaranteeing safety and product integrity for viscous and liquid substances. With this innovative X-ray inspection technology, producers can significantly enhance their quality control measures and safeguard the purity and safety of their pumped goods.
SCOPE OF THE REPORT
The scope of this report covers the market by its major segments, which include as follows:
GLOBAL X-RAY INSPECTION SYSTEMS FOR ELECTRONICS & SEMICONDUCTORS MARKET KEY PLAYERS
- North Star Imaging Inc.
- Nikon Metrology, Inc.
- Nordson Corporation
- YXLON International GmbH
- VJ Group, Inc.
- Mettler Toledo International Inc.
- Ametek, Inc
- Viscom AG
- ViTrox Corporation Berhad
GLOBAL X-RAY INSPECTION SYSTEMS FOR ELECTRONICS & SEMICONDUCTORS MARKET, BY COMPONENT
- Hardware
- Software
- Consumables
- Services
GLOBAL X-RAY INSPECTION SYSTEMS FOR ELECTRONICS & SEMICONDUCTORS MARKET, BY IMAGING TECHNIQUE
- Film-based Imaging
- Digital Imaging
GLOBAL X-RAY INSPECTION SYSTEMS FOR ELECTRONICS & SEMICONDUCTORS MARKET, BY APPLICATION
- Electronic
- Semiconductor
GLOBAL X-RAY INSPECTION SYSTEMS FOR ELECTRONICS & SEMICONDUCTORS MARKET, BY REGION
- North America
- The U.S.
- Canada
- Europe
- Germany
- France
- Italy
- Spain
- United Kingdom
- Russia
- Netherlands
- Sweden
- Poland
- Rest of Europe
- Asia Pacific
- India
- China
- South Korea
- Japan
- Australia
- Thailand
- Indonesia
- Philippines
- Rest of APAC
- Latin America
- Brazil
- Mexico
- Argentina
- Colombia
- Rest of LATAM
- The Middle East and Africa
- Saudi Arabia
- United Arab Emirates
- Israel
- Turkey
- Algeria
- Egypt
- Rest of MEA
Table of Contents
1. X-ray Inspection Systems for Electronics & Semiconductors Market Overview
- 1.1. Study Scope
- 1.2. Market Estimation Years
2. Executive Summary
- 2.1. Market Snippet
- 2.1.1. X-ray Inspection Systems for Electronics & Semiconductors Market Snippet by Component
- 2.1.2. X-ray Inspection Systems for Electronics & Semiconductors Market Snippet by Imaging Technique
- 2.1.3. X-ray Inspection Systems for Electronics & Semiconductors Market Snippet by Applications
- 2.1.4. X-ray Inspection Systems for Electronics & Semiconductors Market Snippet by Country
- 2.1.5. X-ray Inspection Systems for Electronics & Semiconductors Market Snippet by Region
- 2.2. Competitive Insights
3. X-ray Inspection Systems for Electronics & Semiconductors Key Market Trends
- 3.1. X-ray Inspection Systems for Electronics & Semiconductors Market Drivers
- 3.1.1. Impact Analysis of Market Drivers
- 3.2. X-ray Inspection Systems for Electronics & Semiconductors Market Restraints
- 3.2.1. Impact Analysis of Market Restraints
- 3.3. X-ray Inspection Systems for Electronics & Semiconductors Market Opportunities
- 3.4. X-ray Inspection Systems for Electronics & Semiconductors Market Future Trends
4. X-ray Inspection Systems for Electronics & Semiconductors Industry Study
- 4.1. PEST Analysis
- 4.2. Porter's Five Forces Analysis
- 4.3. Growth Prospect Mapping
- 4.4. Regulatory Framework Analysis
5. X-ray Inspection Systems for Electronics & Semiconductors Market: COVID-19 Impact Analysis
- 5.1. Pre-COVID-19 Impact Analysis
- 5.2. Post-COVID-19 Impact Analysis
- 5.2.1. Top Performing Segments
- 5.2.2. Marginal Growth Segments
- 5.2.3. Top Looser Segments
- 5.2.4. Marginal Loss Segments
6. X-ray Inspection Systems for Electronics & Semiconductors Market Landscape
- 6.1. X-ray Inspection Systems for Electronics & Semiconductors Market Share Analysis, 2022
- 6.2. Breakdown Data, by Key Manufacturer
- 6.2.1. Established Players' Analysis
- 6.2.2. Emerging Players' Analysis
7. X-ray Inspection Systems for Electronics & Semiconductors Market - By Component
- 7.1. Overview
- 7.1.1. Segment Share Analysis, By Component, 2022 & 2030 (%)
- 7.1.2. Hardware
- 7.1.3. Software
- 7.1.4. Consumables
- 7.1.5. Services
8. X-ray Inspection Systems for Electronics & Semiconductors Market - By Imaging Technique
- 8.1. Overview
- 8.1.1. Segment Share Analysis, By Imaging Technique, 2022 & 2030 (%)
- 8.1.2. Film-based Imaging
- 8.1.3. Digital Imaging
9. X-ray Inspection Systems for Electronics & Semiconductors Market - By Applications
- 9.1. Overview
- 9.1.1. Segment Share Analysis, By Applications, 2022 & 2030 (%)
- 9.1.2. Electronic
- 9.1.3. Semiconductor
10. X-ray Inspection Systems for Electronics & Semiconductors Market- By Geography
- 10.1. Introduction
- 10.1.1. Segment Share Analysis, By Geography, 2022 & 2030 (%)
- 10.2. North America
- 10.2.1. Overview
- 10.2.2. X-ray Inspection Systems for Electronics & Semiconductors Key Manufacturers in North America
- 10.2.3. North America Market Size and Forecast, By Country, 2018 - 2030 (US$ Million)
- 10.2.4. North America Market Size and Forecast, By Component, 2018 - 2030 (US$ Million)
- 10.2.5. North America Market Size and Forecast, By Imaging Technique, 2018 - 2030 (US$ Million)
- 10.2.6. North America Market Size and Forecast, By Applications, 2018 - 2030 (US$ Million)
- 10.2.7. U.S.
- 10.2.7.1. Overview
- 10.2.7.2. Market Analysis, Forecast, and Y-O-Y Growth Rate, 2018 - 2030, (US$ Million)
- 10.2.7.3. U.S. Market Size and Forecast, By Component, 2018 - 2030 (US$ Million)
- 10.2.7.4. U.S. Market Size and Forecast, By Imaging Technique, 2018 - 2030 (US$ Million)
- 10.2.7.5. U.S. Market Size and Forecast, By Applications, 2018 - 2030 (US$ Million)
- 10.2.8. Canada
- 10.2.8.1. Overview
- 10.2.8.2. Market Analysis, Forecast, and Y-O-Y Growth Rate, 2018 - 2030, (US$ Million)
- 10.2.8.3. Canada Market Size and Forecast, By Component, 2018 - 2030 (US$ Million)
- 10.2.8.4. Canada Market Size and Forecast, By Imaging Technique, 2018 - 2030 (US$ Million)
- 10.2.8.5. Canada Market Size and Forecast, By Applications, 2018 - 2030 (US$ Million)
- 10.3. Europe
- 10.3.1. Overview
- 10.3.2. X-ray Inspection Systems for Electronics & Semiconductors Key Manufacturers in Europe
- 10.3.3. Europe Market Size and Forecast, By Country, 2018 - 2030 (US$ Million)
- 10.3.4. Europe Market Size and Forecast, By Component, 2018 - 2030 (US$ Million)
- 10.3.5. Europe Market Size and Forecast, By Imaging Technique, 2018 - 2030 (US$ Million)
- 10.3.6. Europe Market Size and Forecast, By Applications, 2018 - 2030 (US$ Million)
- 10.3.7. Germany
- 10.3.7.1. Overview
- 10.3.7.2. Market Analysis, Forecast, and Y-O-Y Growth Rate, 2018 - 2030, (US$ Million)
- 10.3.7.3. Germany Market Size and Forecast, By Component, 2018 - 2030 (US$ Million)
- 10.3.7.4. Germany Market Size and Forecast, By Imaging Technique, 2018 - 2030 (US$ Million)
- 10.3.7.5. Germany Market Size and Forecast, By Applications, 2018 - 2030 (US$ Million)
- 10.3.8. Italy
- 10.3.8.1. Overview
- 10.3.8.2. Market Analysis, Forecast, and Y-O-Y Growth Rate, 2018 - 2030, (US$ Million)
- 10.3.8.3. Italy Market Size and Forecast, By Component, 2018 - 2030 (US$ Million)
- 10.3.8.4. Italy Market Size and Forecast, By Imaging Technique, 2018 - 2030 (US$ Million)
- 10.3.8.5. Italy Market Size and Forecast, By Applications, 2018 - 2030 (US$ Million)
- 10.3.9. United Kingdom
- 10.3.9.1. Overview
- 10.3.9.2. Market Analysis, Forecast, and Y-O-Y Growth Rate, 2018 - 2030, (US$ Million)
- 10.3.9.3. United Kingdom Market Size and Forecast, By Component, 2018 - 2030 (US$ Million)
- 10.3.9.4. United Kingdom Market Size and Forecast, By Imaging Technique, 2018 - 2030 (US$ Million)
- 10.3.9.5. United Kingdom Market Size and Forecast, By Applications, 2018 - 2030 (US$ Million)
- 10.3.10. France
- 10.3.10.1. Overview
- 10.3.10.2. Market Analysis, Forecast, and Y-O-Y Growth Rate, 2018 - 2030, (US$ Million)
- 10.3.10.3. France Market Size and Forecast, By Component, 2018 - 2030 (US$ Million)
- 10.3.10.4. France Market Size and Forecast, By Imaging Technique, 2018 - 2030 (US$ Million)
- 10.3.10.5. France Market Size and Forecast, By Applications, 2018 - 2030 (US$ Million)
- 10.3.11. Russia
- 10.3.11.1. Market Analysis, Forecast, and Y-O-Y Growth Rate, 2018 - 2030, (US$ Million)
- 10.3.11.2. Russia Market Size and Forecast, By Component, 2018 - 2030 (US$ Million)
- 10.3.11.3. Russia Market Size and Forecast, By Imaging Technique, 2018 - 2030 (US$ Million)
- 10.3.11.4. Russia Market Size and Forecast, By Applications, 2018 - 2030 (US$ Million)
- 10.3.12. Netherlands
- 10.3.12.1. Market Analysis, Forecast, and Y-O-Y Growth Rate, 2018 - 2030, (US$ Million)
- 10.3.12.2. Netherlands Market Size and Forecast, By Component, 2018 - 2030 (US$ Million)
- 10.3.12.3. Netherlands Market Size and Forecast, By Imaging Technique, 2018 - 2030 (US$ Million)
- 10.3.12.4. Netherlands Market Size and Forecast, By Applications, 2018 - 2030 (US$ Million)
- 10.3.13. Sweden
- 10.3.13.1. Market Analysis, Forecast, and Y-O-Y Growth Rate, 2018 - 2030, (US$ Million)
- 10.3.13.2. Sweden Market Size and Forecast, By Component, 2018 - 2030 (US$ Million)
- 10.3.13.3. Sweden Market Size and Forecast, By Imaging Technique, 2018 - 2030 (US$ Million)
- 10.3.13.4. Sweden Market Size and Forecast, By Applications, 2018 - 2030 (US$ Million)
- 10.3.14. Poland
- 10.3.14.1. Market Analysis, Forecast, and Y-O-Y Growth Rate, 2018 - 2030, (US$ Million)
- 10.3.14.2. Poland Market Size and Forecast, By Component, 2018 - 2030 (US$ Million)
- 10.3.14.3. Poland Market Size and Forecast, By Imaging Technique, 2018 - 2030 (US$ Million)
- 10.3.14.4. Poland Market Size and Forecast, By Applications, 2018 - 2030 (US$ Million)
- 10.3.15. Rest of Europe
- 10.3.15.1. Overview
- 10.3.15.2. Market Analysis, Forecast, and Y-O-Y Growth Rate, 2018 - 2030, (US$ Million)
- 10.3.15.3. Rest of the Europe Market Size and Forecast, By Component, 2018 - 2030 (US$ Million)
- 10.3.15.4. Rest of the Europe Market Size and Forecast, By Imaging Technique, 2018 - 2030 (US$ Million)
- 10.3.15.5. Rest of the Europe Market Size and Forecast, By Applications, 2018 - 2030 (US$ Million)
- 10.4. Asia Pacific (APAC)
- 10.4.1. Overview
- 10.4.2. X-ray Inspection Systems for Electronics & Semiconductors Key Manufacturers in Asia Pacific
- 10.4.3. Asia Pacific Market Size and Forecast, By Country, 2018 - 2030 (US$ Million)
- 10.4.4. Asia Pacific Market Size and Forecast, By Component, 2018 - 2030 (US$ Million)
- 10.4.5. Asia Pacific Market Size and Forecast, By Imaging Technique, 2018 - 2030 (US$ Million)
- 10.4.6. Asia Pacific Market Size and Forecast, By Applications, 2018 - 2030 (US$ Million)
- 10.4.7. India
- 10.4.7.1. Overview
- 10.4.7.2. Market Analysis, Forecast, and Y-O-Y Growth Rate, 2018 - 2030, (US$ Million)
- 10.4.7.3. India Market Size and Forecast, By Component, 2018 - 2030 (US$ Million)
- 10.4.7.4. India Market Size and Forecast, By Imaging Technique, 2018 - 2030 (US$ Million)
- 10.4.7.5. India Market Size and Forecast, By Applications, 2018 - 2030 (US$ Million)
- 10.4.8. China
- 10.4.8.1. Overview
- 10.4.8.2. Market Analysis, Forecast, and Y-O-Y Growth Rate, 2018 - 2030, (US$ Million)
- 10.4.8.3. China Market Size and Forecast, By Component, 2018 - 2030 (US$ Million)
- 10.4.8.4. China Market Size and Forecast, By Imaging Technique, 2018 - 2030 (US$ Million)
- 10.4.8.5. China Market Size and Forecast, By Applications, 2018 - 2030 (US$ Million)
- 10.4.9. Japan
- 10.4.9.1. Overview
- 10.4.9.2. Market Analysis, Forecast, and Y-O-Y Growth Rate, 2018 - 2030, (US$ Million)
- 10.4.9.3. Japan Market Size and Forecast, By Component, 2018 - 2030 (US$ Million)
- 10.4.9.4. Japan Market Size and Forecast, By Imaging Technique, 2018 - 2030 (US$ Million)
- 10.4.9.5. Japan Market Size and Forecast, By Applications, 2018 - 2030 (US$ Million)
- 10.4.10. South Korea
- 10.4.10.1. Overview
- 10.4.10.2. Market Analysis, Forecast, and Y-O-Y Growth Rate, 2018 - 2030, (US$ Million)
- 10.4.10.3. South Korea Market Size and Forecast, By Component, 2018 - 2030 (US$ Million)
- 10.4.10.4. South Korea Market Size and Forecast, By Imaging Technique, 2018 - 2030 (US$ Million)
- 10.4.10.5. South Korea Market Size and Forecast, By Applications, 2018 - 2030 (US$ Million)
- 10.4.11. Australia
- 10.4.11.1. Overview
- 10.4.11.2. Market Analysis, Forecast, and Y-O-Y Growth Rate, 2018 - 2030, (US$ Million)
- 10.4.11.3. Australia Market Size and Forecast, By Component, 2018 - 2030 (US$ Million)
- 10.4.11.4. Australia Market Size and Forecast, By Imaging Technique, 2018 - 2030 (US$ Million)
- 10.4.11.5. Australia Market Size and Forecast, By Applications, 2018 - 2030 (US$ Million)
- 10.4.12. Thailand
- 10.4.12.1. Overview
- 10.4.12.2. Market Analysis, Forecast, and Y-O-Y Growth Rate, 2018 - 2030, (US$ Million)
- 10.4.12.3. Thailand Market Size and Forecast, By Component, 2018 - 2030 (US$ Million)
- 10.4.12.4. Thailand Market Size and Forecast, By Imaging Technique, 2018 - 2030 (US$ Million)
- 10.4.12.5. Thailand Market Size and Forecast, By Applications, 2018 - 2030 (US$ Million)
- 10.4.13. Indonesia
- 10.4.13.1. Overview
- 10.4.13.2. Market Analysis, Forecast, and Y-O-Y Growth Rate, 2018 - 2030, (US$ Million)
- 10.4.13.3. Indonesia Market Size and Forecast, By Component, 2018 - 2030 (US$ Million)
- 10.4.13.4. Indonesia Market Size and Forecast, By Imaging Technique, 2018 - 2030 (US$ Million)
- 10.4.13.5. Indonesia Market Size and Forecast, By Applications, 2018 - 2030 (US$ Million)
- 10.4.14. Philippines
- 10.4.14.1. Overview
- 10.4.14.2. Market Analysis, Forecast, and Y-O-Y Growth Rate, 2018 - 2030, (US$ Million)
- 10.4.14.3. Philippines Market Size and Forecast, By Component, 2018 - 2030 (US$ Million)
- 10.4.14.4. Philippines Market Size and Forecast, By Imaging Technique, 2018 - 2030 (US$ Million)
- 10.4.14.5. Philippines Market Size and Forecast, By Applications, 2018 - 2030 (US$ Million)
- 10.4.15. Rest of APAC
- 10.4.15.1. Overview
- 10.4.15.2. Market Analysis, Forecast, and Y-O-Y Growth Rate, 2018 - 2030, (US$ Million)
- 10.4.15.3. Rest of APAC Market Size and Forecast, By Component, 2018 - 2030 (US$ Million)
- 10.4.15.4. Rest of APAC Market Size and Forecast, By Imaging Technique, 2018 - 2030 (US$ Million)
- 10.4.15.5. Rest of APAC Market Size and Forecast, By Applications, 2018 - 2030 (US$ Million)
- 10.5. Latin America
- 10.5.1. Overview
- 10.5.2. X-ray Inspection Systems for Electronics & Semiconductors Key Manufacturers in Latin America
- 10.5.3. Latin America Market Size and Forecast, By Country, 2018 - 2030 (US$ Million)
- 10.5.4. Latin America Market Size and Forecast, By Component, 2018 - 2030 (US$ Million)
- 10.5.5. Latin America Market Size and Forecast, By Imaging Technique, 2018 - 2030 (US$ Million)
- 10.5.6. Latin America Market Size and Forecast, By Applications, 2018 - 2030 (US$ Million)
- 10.5.7. Brazil
- 10.5.7.1. Overview
- 10.5.7.2. Market Analysis, Forecast, and Y-O-Y Growth Rate, 2018 - 2030, (US$ Million)
- 10.5.7.3. Brazil Market Size and Forecast, By Component, 2018 - 2030 (US$ Million)
- 10.5.7.4. Brazil Market Size and Forecast, By Imaging Technique, 2018 - 2030 (US$ Million)
- 10.5.7.5. Brazil Market Size and Forecast, By Applications, 2018 - 2030 (US$ Million)
- 10.5.8. Mexico
- 10.5.8.1. Overview
- 10.5.8.2. Market Analysis, Forecast, and Y-O-Y Growth Rate, 2018 - 2030, (US$ Million)
- 10.5.8.3. Mexico Market Size and Forecast, By Component, 2018 - 2030 (US$ Million)
- 10.5.8.4. Mexico Market Size and Forecast, By Imaging Technique, 2018 - 2030 (US$ Million)
- 10.5.8.5. Mexico Market Size and Forecast, By Applications, 2018 - 2030 (US$ Million)
- 10.5.9. Argentina
- 10.5.9.1. Overview
- 10.5.9.2. Market Analysis, Forecast, and Y-O-Y Growth Rate, 2018 - 2030, (US$ Million)
- 10.5.9.3. Argentina Market Size and Forecast, By Component, 2018 - 2030 (US$ Million)
- 10.5.9.4. Argentina Market Size and Forecast, By Imaging Technique, 2018 - 2030 (US$ Million)
- 10.5.9.5. Argentina Market Size and Forecast, By Applications, 2018 - 2030 (US$ Million)
- 10.5.10. Colombia
- 10.5.10.1. Overview
- 10.5.10.2. Market Analysis, Forecast, and Y-O-Y Growth Rate, 2018 - 2030, (US$ Million)
- 10.5.10.3. Colombia Market Size and Forecast, By Component, 2018 - 2030 (US$ Million)
- 10.5.10.4. Colombia Market Size and Forecast, By Imaging Technique, 2018 - 2030 (US$ Million)
- 10.5.10.5. Colombia Market Size and Forecast, By Applications, 2018 - 2030 (US$ Million)
- 10.5.11. Rest of LATAM
- 10.5.11.1. Overview
- 10.5.11.2. Market Analysis, Forecast, and Y-O-Y Growth Rate, 2018 - 2030, (US$ Million)
- 10.5.11.3. Rest of LATAM Market Size and Forecast, By Component, 2018 - 2030 (US$ Million)
- 10.5.11.4. Rest of LATAM Market Size and Forecast, By Imaging Technique, 2018 - 2030 (US$ Million)
- 10.5.11.5. Rest of LATAM Market Size and Forecast, By Applications, 2018 - 2030 (US$ Million)
- 10.6. Middle East and Africa
- 10.6.1. Overview
- 10.6.2. X-ray Inspection Systems for Electronics & Semiconductors Key Manufacturers in Middle East and Africa
- 10.6.3. Middle East and Africa Market Size and Forecast, By Country, 2018 - 2030 (US$ Million)
- 10.6.4. Middle East and Africa Market Size and Forecast, By Component, 2018 - 2030 (US$ Million)
- 10.6.5. Middle East and Africa Market Size and Forecast, By Imaging Technique, 2018 - 2030 (US$ Million)
- 10.6.6. Middle East and Africa Market Size and Forecast, By Applications, 2018 - 2030 (US$ Million)
- 10.6.7. Saudi Arabia
- 10.6.7.1. Overview
- 10.6.7.2. Market Analysis, Forecast, and Y-O-Y Growth Rate, 2018 - 2030, (US$ Million)
- 10.6.7.3. Saudi Arabia Market Size and Forecast, By Component, 2018 - 2030 (US$ Million)
- 10.6.7.4. Saudi Arabia Market Size and Forecast, By Imaging Technique, 2018 - 2030 (US$ Million)
- 10.6.7.5. Saudi Arabia Market Size and Forecast, By Applications, 2018 - 2030 (US$ Million)
- 10.6.8. United Arab Emirates
- 10.6.8.1. Overview
- 10.6.8.2. Market Analysis, Forecast, and Y-O-Y Growth Rate, 2018 - 2030, (US$ Million)
- 10.6.8.3. United Arab Emirates Market Size and Forecast, By Component, 2018 - 2030 (US$ Million)
- 10.6.8.4. United Arab Emirates Market Size and Forecast, By Imaging Technique, 2018 - 2030 (US$ Million)
- 10.6.8.5. United Arab Emirates Market Size and Forecast, By Applications, 2018 - 2030 (US$ Million)
- 10.6.9. Israel
- 10.6.9.1. Overview
- 10.6.9.2. Market Analysis, Forecast, and Y-O-Y Growth Rate, 2018 - 2030, (US$ Million)
- 10.6.9.3. Israel Market Size and Forecast, By Component, 2018 - 2030 (US$ Million)
- 10.6.9.4. Israel Market Size and Forecast, By Imaging Technique, 2018 - 2030 (US$ Million)
- 10.6.9.5. Israel Market Size and Forecast, By Applications, 2018 - 2030 (US$ Million)
- 10.6.10. Turkey
- 10.6.10.1. Overview
- 10.6.10.2. Market Analysis, Forecast, and Y-O-Y Growth Rate, 2018 - 2030, (US$ Million)
- 10.6.10.3. Turkey Market Size and Forecast, By Component, 2018 - 2030 (US$ Million)
- 10.6.10.4. Turkey Market Size and Forecast, By Imaging Technique, 2018 - 2030 (US$ Million)
- 10.6.10.5. Turkey Market Size and Forecast, By Applications, 2018 - 2030 (US$ Million)
- 10.6.11. Algeria
- 10.6.11.1. Overview
- 10.6.11.2. Market Analysis, Forecast, and Y-O-Y Growth Rate, 2018 - 2030, (US$ Million)
- 10.6.11.3. Algeria Market Size and Forecast, By Component, 2018 - 2030 (US$ Million)
- 10.6.11.4. Algeria Market Size and Forecast, By Imaging Technique, 2018 - 2030 (US$ Million)
- 10.6.11.5. Algeria Market Size and Forecast, By Applications, 2018 - 2030 (US$ Million)
- 10.6.12. Egypt
- 10.6.12.1. Overview
- 10.6.12.2. Market Analysis, Forecast, and Y-O-Y Growth Rate, 2018 - 2030, (US$ Million)
- 10.6.12.3. Egypt Market Size and Forecast, By Component, 2018 - 2030 (US$ Million)
- 10.6.12.4. Egypt Market Size and Forecast, By Imaging Technique, 2018 - 2030 (US$ Million)
- 10.6.12.5. Egypt Market Size and Forecast, By Applications, 2018 - 2030 (US$ Million)
- 10.6.13. Rest of MEA
- 10.6.13.1. Overview
- 10.6.13.2. Market Analysis, Forecast, and Y-O-Y Growth Rate, 2018 - 2030, (US$ Million)
- 10.6.13.3. Rest of MEA Market Size and Forecast, By Component, 2018 - 2030 (US$ Million)
- 10.6.13.4. Rest of MEA Market Size and Forecast, By Imaging Technique, 2018 - 2030 (US$ Million)
- 10.6.13.5. Rest of MEA Market Size and Forecast, By Applications, 2018 - 2030 (US$ Million)
11. Key Vendor Analysis- X-ray Inspection Systems for Electronics & Semiconductors Industry
- 11.1. Competitive Dashboard
- 11.2. Company Profiles
- 11.2.1. North Star Imaging Inc.
- 11.2.2. Nikon Metrology, Inc.
- 11.2.3. Nordson Corporation
- 11.2.4. YXLON International GmbH
- 11.2.5. VJ Group, Inc.
- 11.2.6. Mettler Toledo International Inc.
- 11.2.7. Ametek, Inc
- 11.2.8. Viscom AG
- 11.2.9. ViTrox Corporation Berhad
12. 360 Degree Analyst View
13. Appendix
- 13.1. Research Methodology
- 13.2. References
- 13.3. Abbreviations
- 13.4. Disclaimer
- 13.5. Contact Us
