|
|
市場調査レポート
商品コード
1351416
点滴液市場:タイプ別、栄養素別、国別、地域別- 産業分析、市場規模、市場シェア、2023-2030年予測Intravenous Solutions Market, By Type, By Nutrients, By Country, and By Region - Industry Analysis, Market Size, Market Share & Forecast from 2023-2030 |
||||||
|
|
|||||||
カスタマイズ可能
|
|||||||


| 点滴液市場:タイプ別、栄養素別、国別、地域別- 産業分析、市場規模、市場シェア、2023-2030年予測 |
|
出版日: 2023年09月01日
発行: AnalystView Market Insights
ページ情報: 英文 307 Pages
納期: 2~3営業日
|

- 全表示
- 概要
- 図表
- 目次
レポートハイライト
輸液市場規模は2022年に119億1,011万米ドルと評価され、2023年から2030年にかけてCAGR 8.11%で拡大しました。
ヘルスケアの領域において、点滴は病院、診療所、救急治療室など様々な医療現場で極めて重要な役割を果たしています。その意義は、適切な体液バランスを維持・調整し、重要な生理学的プロセスをサポートし、治療用化合物や栄養素を効率的に投与する能力にあります。
点滴市場- 市場力学:
- 神経疾患、消化器疾患、がんなどの疾患発生率の増加
- 点滴ソリューション市場の堅調な拡大は、胃腸障害、神経疾患、がんなど、さまざまな病状が急増していることに起因しています。これらの疾患では、効果的な薬剤投与や水分補給のために点滴療法が必要になることが多いです。その結果、患者にとって重要なライフラインとなる静脈注射液の需要が顕著に高まっています。このような需要の高まりは、患者のケアを向上させるだけでなく、医療従事者が幅広い病状を管理するためにこれらのソリューションへの依存度を高めているため、市場の成長にも拍車をかけています。
- 世界の健康データに即して、世界保健機関(WHO)は、2018年の世界のがん罹患数が1,810万件を超えたと報告しており、この数字は2034年までに2,200万件に急増すると予測されています。さらに、WHOの統計によると、消化器疾患は米国で推定6,000万人から7,000万人に影響を及ぼしています。この蔓延は、患者のヘルスケア要件に対処するために、グルコース、リン脂質、グルタミン、アミノ酸を含む非経口栄養溶液の必要性が高まっていることを強調しています。
静脈内ソリューション市場-セグメンテーション分析:
世界の点滴ソリューション市場は、3つの主要な次元でセグメンテーションを示します:タイプ、栄養素、地域です。
タイプ分類では、市場は全身非経口栄養と末梢非経口栄養に分類されます。総合非経口栄養剤は、消化器系をバイパスして血流に栄養補給液を直接供給します。これらの溶液の投与は通常、個人の体重、年齢、身長、特定の病状などの要因に基づいてカスタマイズされます。これらのソリューションは、胃腸障害の管理、火傷の治療、腸症候群への対応、化学療法中の患者のサポート、手術後の回復の促進などに幅広く使用されています。
静脈内ソリューション市場-競合情勢:
企業は、企業ウェブサイト、eコマース・プラットフォーム、小売パートナー、ディストリビューター、消費者への直接アプローチなど、複数のチャネルを活用して製品を市場に投入するため、多様な戦略を採用しています。製品メーカー間の競合は、価格、性能、製造工程、技術の進歩、ブランドの評判、製品の入手可能性など、さまざまな要因が中心となっています。市場での存在感を高め、シェアを拡大するために、企業はさまざまな戦術を用います。これには、新製品のイントロダクション、流通網の拡大、研究開発への多額の投資、M&Aなどが含まれます。
例えば、2022年2月、B.ブラウン・メディカルは米国食品医薬品局から、フロリダ州デイトナビーチに新設した輸液用生理食塩水製造施設の操業開始許可を取得しました。また、2021年9月には、B.ブラウン・メディカル社は、オプションのエアストップコンポーネントを搭載したカレサフェ点滴静注用セットを発表し、製品ポートフォリオを強化しました。
目次
第1章 静脈内ソリューション市場概要
- 調査範囲
- 市場推定年数
第2章 エグゼクティブサマリー
- 市場内訳
- 競合考察
第3章 静脈内ソリューションの主要な市場動向
- 市場促進要因
- 市場抑制要因
- 市場機会
- 今後の市場動向
第4章 静脈内ソリューション業界の調査
- PEST分析
- ポーターのファイブフォース分析
- 成長見通しのマッピング
- 規制枠組みの分析
第5章 静脈内ソリューション市場:COVID-19症の影響分析
- 新型コロナウイルス感染症以前の影響分析
- 新型コロナウイルス感染症後の影響分析
第6章 静脈内ソリューション市場情勢
- 静脈内ソリューション市場シェア分析、2022年
- 主要メーカー別の内訳データ
- 既存企業の分析
- 新興企業の分析
第7章 静脈内ソリューション市場- タイプ別
- 概要
- タイプ別セグメントシェア分析
- 完全非経口栄養学
- 末梢非経口栄養法
第8章 静脈内溶液市場- 栄養素別
- 概要
- 栄養素別セグメントシェア分析
- 単回投与アミノ酸溶液
- 炭水化物
- 非経口脂質エマルジョン
- ビタミンとミネラル
- その他
第9章 静脈内ソリューション市場-地域別
- イントロダクション
- 北米
- 概要
- 北米の主要メーカー
- 米国
- カナダ
- 欧州
- 概要
- 欧州の主要メーカー
- ドイツ
- イタリア
- 英国
- フランス
- ロシア
- オランダ
- スウェーデン
- ポーランド
- その他
- アジア太平洋(APAC)
- 概要
- アジア太平洋地域の主要メーカー
- インド
- 中国
- 日本
- 韓国
- オーストラリア
- タイ
- インドネシア
- フィリピン
- その他
- ラテンアメリカ
- 概要
- ラテンアメリカの主要メーカー
- ブラジル
- メキシコ
- アルゼンチン
- コロンビア
- その他
- 中東とアフリカ
- 概要
- 中東およびアフリカの主要メーカー
- サウジアラビア
- アラブ首長国連邦
- イスラエル
- トルコ
- アルジェリア
- エジプト
- その他
第10章 主要ベンダー分析- 静脈内ソリューション業界
- 競合ダッシュボード
- 企業プロファイル
- Vifor Pharma Group
- Vetter Pharma-Fertigung GmbH &Co. KG
- Terumo Corporation
- Smiths Medical(a division of Smiths Group plc)
- Sippex Pharmaceuticals Pvt. Ltd.
- Sichuan Kelun Pharmaceutical Co., Ltd.
- Otsuka Pharmaceutical Co., Ltd.
- JW Pharmaceutical Corporation
- ICU Medical, Inc.
- Hospira(now part of Pfizer Inc.)
- Grifols SA
- Fresenius SE &Co. KGaA
- Baxter International Inc.
- B. Braun Melsungen AG
- Amanta Healthcare Ltd.
第11章 アナリストの全方位展望
List of Tables
- TABLE List of data sources
- TABLE Market drivers; Impact Analysis
- TABLE Market restraints; Impact Analysis
- TABLE Intravenous Solutions Market: Type Snapshot (2022)
- TABLE Segment Dashboard; Definition and Scope, by Type
- TABLE Global Intravenous Solutions Market, by Type 2018-2030 (USD Million)
- TABLE Intravenous Solutions Market: Nutrient Snapshot (2022)
- TABLE Segment Dashboard; Definition and Scope, by Nutrient
- TABLE Global Intravenous Solutions Market, by Nutrient 2018-2030 (USD Million)
- TABLE Intravenous Solutions Market: Regional snapshot (2022)
- TABLE Segment Dashboard; Definition and Scope, by Region
- TABLE Global Intravenous Solutions Market, by Region 2018-2030 (USD Million)
- TABLE North America Intravenous Solutions Market, by Country, 2018-2030 (USD Million)
- TABLE North America Intravenous Solutions Market, by Type, 2018-2030 (USD Million)
- TABLE North America Intravenous Solutions Market, by Nutrient, 2018-2030 (USD Million)
- TABLE Europe Intravenous Solutions Market, by Country, 2018-2030 (USD Million)
- TABLE Europe Intravenous Solutions Market, by Type, 2018-2030 (USD Million)
- TABLE Europe Intravenous Solutions Market, by Nutrient, 2018-2030 (USD Million)
- TABLE Asia Pacific Intravenous Solutions Market, by Country, 2018-2030 (USD Million)
- TABLE Asia Pacific Intravenous Solutions Market, by Type, 2018-2030 (USD Million)
- TABLE Asia Pacific Intravenous Solutions Market, by Nutrient, 2018-2030 (USD Million)
- TABLE Latin America Intravenous Solutions Market, by Country, 2018-2030 (USD Million)
- TABLE Latin America Intravenous Solutions Market, by Type, 2018-2030 (USD Million)
- TABLE Latin America Intravenous Solutions Market, by Nutrient, 2018-2030 (USD Million)
- TABLE Middle East and Africa Intravenous Solutions Market, by Country, 2018-2030 (USD Million)
- TABLE Middle East and Africa Intravenous Solutions Market, by Type, 2018-2030 (USD Million)
- TABLE Middle East and Africa Intravenous Solutions Market, by Nutrient, 2018-2030 (USD Million)
REPORT HIGHLIGHT
Intravenous Solutions Market size was valued at USD 11,910.11 Million in 2022, expanding at a CAGR of 8.11% from 2023 to 2030.
Intravenous infusion solutions, commonly referred to as IV infusions, are sterile liquid formulations administered directly into a patient's bloodstream through a needle or catheter. These specialized solutions are meticulously crafted to provide essential hydration, replenish vital electrolytes, and facilitate the delivery of medications or essential nutrients when a patient cannot ingest them orally.
Within the realm of healthcare, IV infusions play a pivotal role across various medical settings, encompassing hospitals, medical clinics, and emergency care units. Their significance lies in their ability to uphold and regulate proper fluid balance, support crucial physiological processes, and ensure the efficient dispensation of therapeutic compounds and nutrients.
Intravenous Solutions Market - Market Dynamics:
- Increasing incidence of diseases like neurological conditions, gastrointestinal disorders, and cancer
- The robust expansion of the Intravenous Solutions market can be attributed to the surging prevalence of various medical conditions, including gastrointestinal disorders, neurological ailments, and cancer. These conditions often necessitate the use of intravenous therapy for effective medication administration and hydration. Consequently, there has been a notable escalation in the demand for intravenous solutions, which serve as a crucial lifeline for patients. This heightened demand not only improves patient care but also fuels market growth, as healthcare professionals increasingly rely on these solutions to manage a wide spectrum of medical conditions.
- In line with global health data, the World Health Organization (WHO) reported that the global incidence of cancer exceeded 18.1 million cases in 2018, and this figure is projected to surge to 22.0 million by 2034. Furthermore, WHO statistics indicate that gastrointestinal diseases affect an estimated 60 to 70 million individuals in the United States. This prevalence underscores the growing need for parenteral nutritional solutions, encompassing glucose, phospholipids, glutamine, and amino acids, to address the healthcare requirements of patients.
Intravenous Solutions Market - Key Insights:
- According to insights provided by our research analysts, the global Intravenous Solutions market is anticipated to experience robust annual growth, with a projected Compound Annual Growth Rate (CAGR) of approximately 7.9% during the forecast period spanning from 2023 to 2030.
- This industry's growth trajectory is underpinned by significant factors, primarily the escalating prevalence of various medical conditions such as neurological disorders, gastrointestinal ailments, and cancer.
- In terms of product categorization, the segment dedicated to total parenteral nutrition emerged as the leading contributor to market share for the year 2022.
- Furthermore, when considering nutrient segmentation, the single-dose amino acid category demonstrated its prominence in 2022.
- Geographically, North America emerged as the primary revenue-generating region for the market in the year 2022.
Intravenous Solutions Market- Segmentation Analysis:
- The worldwide Intravenous Solutions Market exhibits segmentation across three key dimensions: Type, Nutrient, and Geographic Region.
- In terms of Type classification, the market can be categorized into Total Parenteral Nutrition and Peripheral Parenteral Nutrition. Total Parenteral Nutrition involves the direct delivery of nourishing fluids into the bloodstream, bypassing the digestive system. The administration of these solutions is typically customized based on factors such as an individual's weight, age, height, and specific medical condition. These solutions find extensive use in the management of gastrointestinal disorders, treatment of burn injuries, addressing bowel syndromes, supporting patients undergoing chemotherapy, and facilitating post-surgical recovery.
Intravenous Solutions Market- Competitive Landscape:
Businesses employ a diverse array of strategies to bring their products to market, leveraging multiple channels like corporate websites, e-commerce platforms, retail partners, distributors, and direct-to-consumer approaches. Competition among product manufacturers centers on various factors encompassing pricing, performance, manufacturing processes, technological advancements, brand reputation, and product availability. To fortify their market presence and broaden their share, companies employ a range of tactics. These include the introduction of new products, the expansion of distribution networks, significant investments in research and development, and engaging in mergers and acquisitions.
For example, in February 2022, B. Braun Medical secured approval from the US Food and Drug Administration to initiate operations at their newly established IV saline solution production facility in Daytona Beach, Florida. In a separate instance from September 2021, B. Braun Medical Inc. unveiled CARESAFE IV Administration Sets, featuring an optional AirStop component, enhancing their product portfolio.
SCOPE OF THE REPORT
The scope of this report covers the market by its major segments, which include as follows:
GLOBAL INTRAVENOUS SOLUTIONS MARKET KEY PLAYERS
- Vifor Pharma Group
- Vetter Pharma-Fertigung GmbH & Co. KG
- Terumo Corporation
- Smiths Medical (a division of Smiths Group plc)
- Sippex Pharmaceuticals Pvt. Ltd.
- Sichuan Kelun Pharmaceutical Co., Ltd.
- Otsuka Pharmaceutical Co., Ltd.
- JW Pharmaceutical Corporation
- ICU Medical, Inc.
- Hospira (now part of Pfizer Inc.)
- Grifols S.A.
- Fresenius SE & Co. KGaA
- Baxter International Inc.
- B. Braun Melsungen AG
- Amanta Healthcare Ltd.
GLOBAL INTRAVENOUS SOLUTIONS MARKET, BY TYPE
- Total Parenteral Nutrition
- Peripheral Parenteral Nutrition
GLOBAL INTRAVENOUS SOLUTIONS MARKET, BY NUTRIENT
- Single-Dose Amino Acid Solutions
- Carbohydrates
- Parenteral Lipid Emulsion
- Vitamins & Minerals
- Others
GLOBAL INTRAVENOUS SOLUTIONS MARKET, BY REGION
- North America
- The U.S.
- Canada
- Europe
- Germany
- France
- Italy
- Spain
- United Kingdom
- Russia
- Netherlands
- Sweden
- Poland
- Rest of Europe
- Asia Pacific
- India
- China
- South Korea
- Japan
- Australia
- Thailand
- Indonesia
- Philippines
- Rest of APAC
- Latin America
- Brazil
- Mexico
- Argentina
- Colombia
- Rest of LATAM
- The Middle East and Africa
- Saudi Arabia
- United Arab Emirates
- Israel
- Turkey
- Algeria
- Egypt
- Rest of MEA
Table of Contents
1. Intravenous Solutions Market Overview
- 1.1. Study Scope
- 1.2. Market Estimation Years
2. Executive Summary
- 2.1. Market Snippet
- 2.1.1. Intravenous Solutions Market Snippet by Type
- 2.1.2. Intravenous Solutions Market Snippet by Nutrient
- 2.1.3. Intravenous Solutions Market Snippet by Country
- 2.1.4. Intravenous Solutions Market Snippet by Region
- 2.2. Competitive Insights
3. Intravenous Solutions Key Market Trends
- 3.1. Intravenous Solutions Market Drivers
- 3.1.1. Impact Analysis of Market Drivers
- 3.2. Intravenous Solutions Market Restraints
- 3.2.1. Impact Analysis of Market Restraints
- 3.3. Intravenous Solutions Market Opportunities
- 3.4. Intravenous Solutions Market Future Trends
4. Intravenous Solutions Industry Study
- 4.1. PEST Analysis
- 4.2. Porter's Five Forces Analysis
- 4.3. Growth Prospect Mapping
- 4.4. Regulatory Framework Analysis
5. Intravenous Solutions Market: COVID-19 Impact Analysis
- 5.1. Pre-COVID-19 Impact Analysis
- 5.2. Post-COVID-19 Impact Analysis
- 5.2.1. Top Performing Segments
- 5.2.2. Marginal Growth Segments
- 5.2.3. Top Looser Segments
- 5.2.4. Marginal Loss Segments
6. Intravenous Solutions Market Landscape
- 6.1. Intravenous Solutions Market Share Analysis, 2022
- 6.2. Breakdown Data, by Key Manufacturer
- 6.2.1. Established Players' Analysis
- 6.2.2. Emerging Players' Analysis
7. Intravenous Solutions Market - By Type
- 7.1. Overview
- 7.1.1. Segment Share Analysis, By Type, 2022 & 2030 (%)
- 7.1.2. Total Parenteral Nutrition
- 7.1.3. Peripheral Parenteral Nutrition
8. Intravenous Solutions Market - By Nutrient
- 8.1. Overview
- 8.1.1. Segment Share Analysis, By Nutrient, 2022 & 2030 (%)
- 8.1.2. Single-Dose Amino Acid Solutions
- 8.1.3. Carbohydrates
- 8.1.4. Parenteral Lipid Emulsion
- 8.1.5. Vitamins & Minerals
- 8.1.6. Others
9. Intravenous Solutions Market- By Geography
- 9.1. Introduction
- 9.1.1. Segment Share Analysis, By Geography, 2022 & 2030 (%)
- 9.2. North America
- 9.2.1. Overview
- 9.2.2. Intravenous Solutions Key Manufacturers in North America
- 9.2.3. North America Market Size and Forecast, By Country, 2018 - 2030 (US$ Million)
- 9.2.4. North America Market Size and Forecast, By Type, 2018 - 2030 (US$ Million)
- 9.2.5. North America Market Size and Forecast, By Nutrient, 2018 - 2030 (US$ Million)
- 9.2.6. U.S.
- 9.2.6.1. Overview
- 9.2.6.2. Market Analysis, Forecast, and Y-O-Y Growth Rate, 2018 - 2030, (US$ Million)
- 9.2.6.3. U.S. Market Size and Forecast, By Type, 2018 - 2030 (US$ Million)
- 9.2.6.4. U.S. Market Size and Forecast, By Nutrient, 2018 - 2030 (US$ Million)
- 9.2.7. Canada
- 9.2.7.1. Overview
- 9.2.7.2. Market Analysis, Forecast, and Y-O-Y Growth Rate, 2018 - 2030, (US$ Million)
- 9.2.7.3. Canada Market Size and Forecast, By Type, 2018 - 2030 (US$ Million)
- 9.2.7.4. Canada Market Size and Forecast, By Nutrient, 2018 - 2030 (US$ Million)
- 9.3. Europe
- 9.3.1. Overview
- 9.3.2. Intravenous Solutions Key Manufacturers in Europe
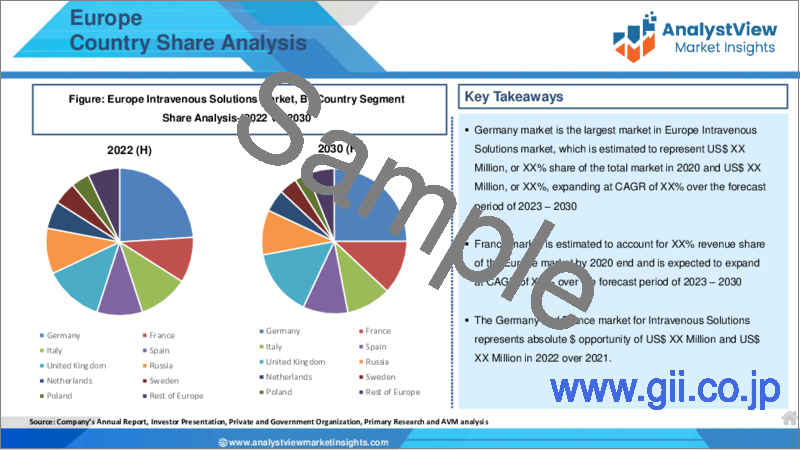
- 9.3.3. Europe Market Size and Forecast, By Country, 2018 - 2030 (US$ Million)
- 9.3.4. Europe Market Size and Forecast, By Type, 2018 - 2030 (US$ Million)
- 9.3.5. Europe Market Size and Forecast, By Nutrient, 2018 - 2030 (US$ Million)
- 9.3.6. Germany
- 9.3.6.1. Overview
- 9.3.6.2. Market Analysis, Forecast, and Y-O-Y Growth Rate, 2018 - 2030, (US$ Million)
- 9.3.6.3. Germany Market Size and Forecast, By Type, 2018 - 2030 (US$ Million)
- 9.3.6.4. Germany Market Size and Forecast, By Nutrient, 2018 - 2030 (US$ Million)
- 9.3.7. Italy
- 9.3.7.1. Overview
- 9.3.7.2. Market Analysis, Forecast, and Y-O-Y Growth Rate, 2018 - 2030, (US$ Million)
- 9.3.7.3. Italy Market Size and Forecast, By Type, 2018 - 2030 (US$ Million)
- 9.3.7.4. Italy Market Size and Forecast, By Nutrient, 2018 - 2030 (US$ Million)
- 9.3.8. United Kingdom
- 9.3.8.1. Overview
- 9.3.8.2. Market Analysis, Forecast, and Y-O-Y Growth Rate, 2018 - 2030, (US$ Million)
- 9.3.8.3. United Kingdom Market Size and Forecast, By Type, 2018 - 2030 (US$ Million)
- 9.3.8.4. United Kingdom Market Size and Forecast, By Nutrient, 2018 - 2030 (US$ Million)
- 9.3.9. France
- 9.3.9.1. Overview
- 9.3.9.2. Market Analysis, Forecast, and Y-O-Y Growth Rate, 2018 - 2030, (US$ Million)
- 9.3.9.3. France Market Size and Forecast, By Type, 2018 - 2030 (US$ Million)
- 9.3.9.4. France Market Size and Forecast, By Nutrient, 2018 - 2030 (US$ Million)
- 9.3.10. Russia
- 9.3.10.1. Market Analysis, Forecast, and Y-O-Y Growth Rate, 2018 - 2030, (US$ Million)
- 9.3.10.2. Russia Market Size and Forecast, By Type, 2018 - 2030 (US$ Million)
- 9.3.10.3. Russia Market Size and Forecast, By Nutrient, 2018 - 2030 (US$ Million)
- 9.3.11. Netherlands
- 9.3.11.1. Market Analysis, Forecast, and Y-O-Y Growth Rate, 2018 - 2030, (US$ Million)
- 9.3.11.2. Netherlands Market Size and Forecast, By Type, 2018 - 2030 (US$ Million)
- 9.3.11.3. Netherlands Market Size and Forecast, By Nutrient, 2018 - 2030 (US$ Million)
- 9.3.12. Sweden
- 9.3.12.1. Market Analysis, Forecast, and Y-O-Y Growth Rate, 2018 - 2030, (US$ Million)
- 9.3.12.2. Sweden Market Size and Forecast, By Type, 2018 - 2030 (US$ Million)
- 9.3.12.3. Sweden Market Size and Forecast, By Nutrient, 2018 - 2030 (US$ Million)
- 9.3.13. Poland
- 9.3.13.1. Market Analysis, Forecast, and Y-O-Y Growth Rate, 2018 - 2030, (US$ Million)
- 9.3.13.2. Poland Market Size and Forecast, By Type, 2018 - 2030 (US$ Million)
- 9.3.13.3. Poland Market Size and Forecast, By Nutrient, 2018 - 2030 (US$ Million)
- 9.3.14. Rest of Europe
- 9.3.14.1. Overview
- 9.3.14.2. Market Analysis, Forecast, and Y-O-Y Growth Rate, 2018 - 2030, (US$ Million)
- 9.3.14.3. Rest of the Europe Market Size and Forecast, By Type, 2018 - 2030 (US$ Million)
- 9.3.14.4. Rest of the Europe Market Size and Forecast, By Nutrient, 2018 - 2030 (US$ Million)
- 9.4. Asia Pacific (APAC)
- 9.4.1. Overview
- 9.4.2. Intravenous Solutions Key Manufacturers in Asia Pacific
- 9.4.3. Asia Pacific Market Size and Forecast, By Country, 2018 - 2030 (US$ Million)
- 9.4.4. Asia Pacific Market Size and Forecast, By Type, 2018 - 2030 (US$ Million)
- 9.4.5. Asia Pacific Market Size and Forecast, By Nutrient, 2018 - 2030 (US$ Million)
- 9.4.6. India
- 9.4.6.1. Overview
- 9.4.6.2. Market Analysis, Forecast, and Y-O-Y Growth Rate, 2018 - 2030, (US$ Million)
- 9.4.6.3. India Market Size and Forecast, By Type, 2018 - 2030 (US$ Million)
- 9.4.6.4. India Market Size and Forecast, By Nutrient, 2018 - 2030 (US$ Million)
- 9.4.7. China
- 9.4.7.1. Overview
- 9.4.7.2. Market Analysis, Forecast, and Y-O-Y Growth Rate, 2018 - 2030, (US$ Million)
- 9.4.7.3. China Market Size and Forecast, By Type, 2018 - 2030 (US$ Million)
- 9.4.7.4. China Market Size and Forecast, By Nutrient, 2018 - 2030 (US$ Million)
- 9.4.8. Japan
- 9.4.8.1. Overview
- 9.4.8.2. Market Analysis, Forecast, and Y-O-Y Growth Rate, 2018 - 2030, (US$ Million)
- 9.4.8.3. Japan Market Size and Forecast, By Type, 2018 - 2030 (US$ Million)
- 9.4.8.4. Japan Market Size and Forecast, By Nutrient, 2018 - 2030 (US$ Million)
- 9.4.9. South Korea
- 9.4.9.1. Overview
- 9.4.9.2. Market Analysis, Forecast, and Y-O-Y Growth Rate, 2018 - 2030, (US$ Million)
- 9.4.9.3. South Korea Market Size and Forecast, By Type, 2018 - 2030 (US$ Million)
- 9.4.9.4. South Korea Market Size and Forecast, By Nutrient, 2018 - 2030 (US$ Million)
- 9.4.10. Australia
- 9.4.10.1. Overview
- 9.4.10.2. Market Analysis, Forecast, and Y-O-Y Growth Rate, 2018 - 2030, (US$ Million)
- 9.4.10.3. Australia Market Size and Forecast, By Type, 2018 - 2030 (US$ Million)
- 9.4.10.4. Australia Market Size and Forecast, By Nutrient, 2018 - 2030 (US$ Million)
- 9.4.11. Thailand
- 9.4.11.1. Overview
- 9.4.11.2. Market Analysis, Forecast, and Y-O-Y Growth Rate, 2018 - 2030, (US$ Million)
- 9.4.11.3. Thailand Market Size and Forecast, By Type, 2018 - 2030 (US$ Million)
- 9.4.11.4. Thailand Market Size and Forecast, By Nutrient, 2018 - 2030 (US$ Million)
- 9.4.12. Indonesia
- 9.4.12.1. Overview
- 9.4.12.2. Market Analysis, Forecast, and Y-O-Y Growth Rate, 2018 - 2030, (US$ Million)
- 9.4.12.3. Indonesia Market Size and Forecast, By Type, 2018 - 2030 (US$ Million)
- 9.4.12.4. Indonesia Market Size and Forecast, By Nutrient, 2018 - 2030 (US$ Million)
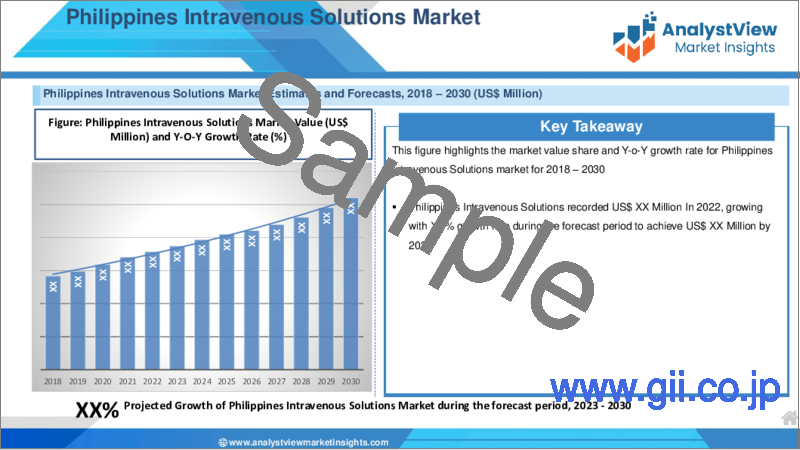
- 9.4.13. Philippines
- 9.4.13.1. Overview
- 9.4.13.2. Market Analysis, Forecast, and Y-O-Y Growth Rate, 2018 - 2030, (US$ Million)
- 9.4.13.3. Philippines Market Size and Forecast, By Type, 2018 - 2030 (US$ Million)
- 9.4.13.4. Philippines Market Size and Forecast, By Nutrient, 2018 - 2030 (US$ Million)
- 9.4.14. Rest of APAC
- 9.4.14.1. Overview
- 9.4.14.2. Market Analysis, Forecast, and Y-O-Y Growth Rate, 2018 - 2030, (US$ Million)
- 9.4.14.3. Rest of APAC Market Size and Forecast, By Type, 2018 - 2030 (US$ Million)
- 9.4.14.4. Rest of APAC Market Size and Forecast, By Nutrient, 2018 - 2030 (US$ Million)
- 9.5. Latin America
- 9.5.1. Overview
- 9.5.2. Intravenous Solutions Key Manufacturers in Latin America
- 9.5.3. Latin America Market Size and Forecast, By Country, 2018 - 2030 (US$ Million)
- 9.5.4. Latin America Market Size and Forecast, By Type, 2018 - 2030 (US$ Million)
- 9.5.5. Latin America Market Size and Forecast, By Nutrient, 2018 - 2030 (US$ Million)
- 9.5.6. Brazil
- 9.5.6.1. Overview
- 9.5.6.2. Market Analysis, Forecast, and Y-O-Y Growth Rate, 2018 - 2030, (US$ Million)
- 9.5.6.3. Brazil Market Size and Forecast, By Type, 2018 - 2030 (US$ Million)
- 9.5.6.4. Brazil Market Size and Forecast, By Nutrient, 2018 - 2030 (US$ Million)
- 9.5.7. Mexico
- 9.5.7.1. Overview
- 9.5.7.2. Market Analysis, Forecast, and Y-O-Y Growth Rate, 2018 - 2030, (US$ Million)
- 9.5.7.3. Mexico Market Size and Forecast, By Type, 2018 - 2030 (US$ Million)
- 9.5.7.4. Mexico Market Size and Forecast, By Nutrient, 2018 - 2030 (US$ Million)
- 9.5.8. Argentina
- 9.5.8.1. Overview
- 9.5.8.2. Market Analysis, Forecast, and Y-O-Y Growth Rate, 2018 - 2030, (US$ Million)
- 9.5.8.3. Argentina Market Size and Forecast, By Type, 2018 - 2030 (US$ Million)
- 9.5.8.4. Argentina Market Size and Forecast, By Nutrient, 2018 - 2030 (US$ Million)
- 9.5.9. Colombia
- 9.5.9.1. Overview
- 9.5.9.2. Market Analysis, Forecast, and Y-O-Y Growth Rate, 2018 - 2030, (US$ Million)
- 9.5.9.3. Colombia Market Size and Forecast, By Type, 2018 - 2030 (US$ Million)
- 9.5.9.4. Colombia Market Size and Forecast, By Nutrient, 2018 - 2030 (US$ Million)
- 9.5.10. Rest of LATAM
- 9.5.10.1. Overview
- 9.5.10.2. Market Analysis, Forecast, and Y-O-Y Growth Rate, 2018 - 2030, (US$ Million)
- 9.5.10.3. Rest of LATAM Market Size and Forecast, By Type, 2018 - 2030 (US$ Million)
- 9.5.10.4. Rest of LATAM Market Size and Forecast, By Nutrient, 2018 - 2030 (US$ Million)
- 9.6. Middle East and Africa
- 9.6.1. Overview
- 9.6.2. Intravenous Solutions Key Manufacturers in Middle East and Africa
- 9.6.3. Middle East and Africa Market Size and Forecast, By Country, 2018 - 2030 (US$ Million)
- 9.6.4. Middle East and Africa Market Size and Forecast, By Type, 2018 - 2030 (US$ Million)
- 9.6.5. Middle East and Africa Market Size and Forecast, By Nutrient, 2018 - 2030 (US$ Million)
- 9.6.6. Saudi Arabia
- 9.6.6.1. Overview
- 9.6.6.2. Market Analysis, Forecast, and Y-O-Y Growth Rate, 2018 - 2030, (US$ Million)
- 9.6.6.3. Saudi Arabia Market Size and Forecast, By Type, 2018 - 2030 (US$ Million)
- 9.6.6.4. Saudi Arabia Market Size and Forecast, By Nutrient, 2018 - 2030 (US$ Million)
- 9.6.7. United Arab Emirates
- 9.6.7.1. Overview
- 9.6.7.2. Market Analysis, Forecast, and Y-O-Y Growth Rate, 2018 - 2030, (US$ Million)
- 9.6.7.3. United Arab Emirates Market Size and Forecast, By Type, 2018 - 2030 (US$ Million)
- 9.6.7.4. United Arab Emirates Market Size and Forecast, By Nutrient, 2018 - 2030 (US$ Million)
- 9.6.8. Israel
- 9.6.8.1. Overview
- 9.6.8.2. Market Analysis, Forecast, and Y-O-Y Growth Rate, 2018 - 2030, (US$ Million)
- 9.6.8.3. Israel Market Size and Forecast, By Type, 2018 - 2030 (US$ Million)
- 9.6.8.4. Israel Market Size and Forecast, By Nutrient, 2018 - 2030 (US$ Million)
- 9.6.9. Turkey
- 9.6.9.1. Overview
- 9.6.9.2. Market Analysis, Forecast, and Y-O-Y Growth Rate, 2018 - 2030, (US$ Million)
- 9.6.9.3. Turkey Market Size and Forecast, By Type, 2018 - 2030 (US$ Million)
- 9.6.9.4. Turkey Market Size and Forecast, By Nutrient, 2018 - 2030 (US$ Million)
- 9.6.10. Algeria
- 9.6.10.1. Overview
- 9.6.10.2. Market Analysis, Forecast, and Y-O-Y Growth Rate, 2018 - 2030, (US$ Million)
- 9.6.10.3. Algeria Market Size and Forecast, By Type, 2018 - 2030 (US$ Million)
- 9.6.10.4. Algeria Market Size and Forecast, By Nutrient, 2018 - 2030 (US$ Million)
- 9.6.11. Egypt
- 9.6.11.1. Overview
- 9.6.11.2. Market Analysis, Forecast, and Y-O-Y Growth Rate, 2018 - 2030, (US$ Million)
- 9.6.11.3. Egypt Market Size and Forecast, By Type, 2018 - 2030 (US$ Million)
- 9.6.11.4. Egypt Market Size and Forecast, By Nutrient, 2018 - 2030 (US$ Million)
- 9.6.12. Rest of MEA
- 9.6.12.1. Overview
- 9.6.12.2. Market Analysis, Forecast, and Y-O-Y Growth Rate, 2018 - 2030, (US$ Million)
- 9.6.12.3. Rest of MEA Market Size and Forecast, By Type, 2018 - 2030 (US$ Million)
- 9.6.12.4. Rest of MEA Market Size and Forecast, By Nutrient, 2018 - 2030 (US$ Million)
10. Key Vendor Analysis- Intravenous Solutions Industry
- 10.1. Competitive Dashboard
- 10.2. Company Profiles
- 10.2.1. Vifor Pharma Group
- 10.2.2. Vetter Pharma-Fertigung GmbH & Co. KG
- 10.2.3. Terumo Corporation
- 10.2.4. Smiths Medical (a division of Smiths Group plc)
- 10.2.5. Sippex Pharmaceuticals Pvt. Ltd.
- 10.2.6. Sichuan Kelun Pharmaceutical Co., Ltd.
- 10.2.7. Otsuka Pharmaceutical Co., Ltd.
- 10.2.8. JW Pharmaceutical Corporation
- 10.2.9. ICU Medical, Inc.
- 10.2.10. Hospira (now part of Pfizer Inc.)
- 10.2.11. Grifols S.A.
- 10.2.12. Fresenius SE & Co. KGaA
- 10.2.13. Baxter International Inc.
- 10.2.14. B. Braun Melsungen AG
- 10.2.15. Amanta Healthcare Ltd.
11. 360 Degree Analyst View
12. Appendix
- 12.1. Research Methodology
- 12.2. References
- 12.3. Abbreviations
- 12.4. Disclaimer
- 12.5. Contact Us
