|
|
市場調査レポート
商品コード
1404711
静脈内溶液の市場規模、シェア、動向分析レポート:製品別、栄養素別、地域別、セグメント予測、2024年~2030年Intravenous Solutions Market Size, Share & Trends Analysis Report By Product (TPN, PPN), By Nutrients (Carbohydrates, Vitamins & Minerals, Single-dose Amino Acids) By Region (Asia Pacific, North America), And Segment Forecasts, 2024 - 2030 |
||||||
|
|
|||||||
カスタマイズ可能
|
|||||||


| 静脈内溶液の市場規模、シェア、動向分析レポート:製品別、栄養素別、地域別、セグメント予測、2024年~2030年 |
|
出版日: 2023年11月21日
発行: Grand View Research
ページ情報: 英文 114 Pages
納期: 2~10営業日
|

全表示
- 概要
- 図表
- 目次
静脈内溶液市場の成長と動向:
Grand View Research, Inc.の最新レポートによると、世界の静脈内溶液市場規模は2030年までに220億米ドルに達し、予測期間中のCAGRは8%を記録する見込みです。
特にインドや中国などの新興国では早産が多く、予測期間中の市場成長の原動力になると見られています。WHOによると、10人に1人が早産児であり、これは世界の懸念事項です。そのため、新興国における早産の発生率の高さ、ヘルスケアインフラの改善、医療費と患者の意識の高まりが、予測期間中の市場促進要因として大きな影響を与えると予想されます。
非経口脂質エマルションの使用は、早産による死亡率を抑えるために様々な当局が幅広く注力していることが背景にあります。2021年現在、米国の早産率は約10.5%です。さらに、早産による社会的、経済的コストは年間252億米ドルと推定されています。したがって、出産後の補助栄養を必要とする新生児が多く存在することが、予測期間中の市場需要を押し上げると予想されます。
さらに、パンデミックの間に増加した栄養不良の問題に苦しむ患者に対する非経口栄養剤の使用を正当化する研究もいくつかあり、市場の成長につながっています。例えば、Journal of the Academy of Nutrition and Dieteticsに掲載された論文によると、COVID-19治療のためにICUに入院した患者の多くが急性栄養失調に苦しんでいます。したがって、パンデミック期間中、非経口栄養製品の使用量が市場で増加すると予想されます。
COVID-19陽性患者では、特定の微量栄養素やビタミンの欠乏が多く、有害であることが報告されています。そのため、このような患者では推奨される食事摂取量を満たすために静脈内投与が推奨されています。医師および栄養専門家は、COVID-19患者では経腸栄養よりも非経口栄養を好みました。なぜなら、経腸栄養では特に経鼻胃管の設置が必要であり、COVID-19患者に提供される非侵襲的換気の妨げになるからです。COVID-19の入院患者では栄養溶液の誤嚥や栄養不足のリスクが高まるため、非経口栄養の採用が増加しています。
静脈内溶液市場レポートハイライト
- 2023年には、総合非経口栄養(TPN)分野が66.3%と圧倒的な市場シェアを占め、予測期間中に最も高い成長率(CAGR 8.2%)を示すと予測されています。TPNは、静脈内(IV)技術を通じて包括的な栄養セットを投与することを含みます。
- 2023年には、単回投与アミノ酸溶液セグメントが市場を牽引し、31.6%の大きなシェアを占めています。単回投与アミノ酸は、完全なタンパク質源を提供し、他の非経口製剤とのカスタマイズが容易で、投与が簡単であることが研究で示されています。
- Assure Infusions, Inc.は、フロリダ州バートウに高度製造施設を建設するために2,000万米ドルを投資することを発表し、米国における輸液の需給ギャップに対処しています。
目次
第1章 調査手法と範囲
第2章 エグゼクティブサマリー
第3章 静脈内溶液市場の変数と動向
- 静脈内溶液市場の系統展望
- 付随市場の見通し
- 市場力学
- 市場促進要因の影響分析
- 市場抑制要因分析
- 規制の枠組み
- 規格と準拠
- 償還シナリオ
- COVID-19パンデミックの影響
- 業界分析ツール
- ポーターの分析
- マクロ経済分析
第4章 静脈内溶液市場:製品分析
- 製品の変動分析と市場シェア、2023年と2030年
- 製品別
- 完全静脈栄養
- 完全静脈栄養市場、2018年~2030年
- 末梢静脈栄養
- 末梢静脈栄養市場、2018年~2030年
第5章 静脈内溶液市場:栄養素分析
- 栄養素の変動分析と市場シェア、2023年と2030年
- 栄養素別
- 炭水化物
- 炭水化物市場、2018年~2030年
- 単回投与アミノ酸溶液
- 単回投与アミノ酸溶液市場、2018年~2030年
- ビタミンとミネラル
- ビタミンとミネラル、2018年~2030年
- 非経口脂質エマルション
- 非経口脂質エマルション、2018年~2030年
- その他
- その他市場、2018年~2030年
第6章 静脈内溶液市場:地域推定・動向分析
- 静脈内溶液市場:地域別の見通し
- 北米
- 北米の静脈内溶液市場推計・予測、2018年~2030年
- 米国
- カナダ
- 欧州
- 欧州の静脈内溶液市場推計・予測、2018年~2030年
- 英国
- ドイツ
- フランス
- イタリア
- スペイン
- デンマーク
- スウェーデン
- ノルウェー
- アジア太平洋地域
- アジア太平洋地域の静脈内溶液市場推計・予測、2018年~2030年
- 日本
- 中国
- インド
- オーストラリア
- 韓国
- タイ
- ラテンアメリカ
- ラテンアメリカの静脈内溶液市場推計・予測、2018年~2030年
- メキシコ
- ブラジル
- アルゼンチン
- 中東・アフリカ(MEA)
- 中東・アフリカの静脈内溶液市場推計・予測、2018年~2030年
- 南アフリカ
- サウジアラビア
- アラブ首長国連邦
- クウェート
第7章 競合分析
- 企業の分類
- Fresenius Kabi AG
- Pfizer Inc.
- Otsuka Pharmaceutical Co. Ltd.
- Baxter, B. Braun Melsungen AG
- Vifor Pharma Management Ltd.
- JW Life Science
- Participants'Overview
- 財務実績
- 製品のベンチマーク
- 市場参入企業の分類
- ヒートマップ分析
- 企業の市場シェア分析、2022年
- 戦略マッピング
- 合併と買収
- 製品の発売
- パートナーシップとコラボレーション
- 製品の承認
- 拡大
- その他
第8章 アナリストの視点
List of Tables
- Table 1 List of Secondary Sources
- Table 2 List of Abbreviations
List of Figures
- Fig. 1 Intravenous solutions market segmentation
- Fig. 2 Market research process
- Fig. 3 Information procurement
- Fig. 4 Primary research pattern
- Fig. 5 Market research approaches
- Fig. 6 Value chain based sizing & forecasting
- Fig. 7 QFD modelling for market share assessment
- Fig. 8 Market formulation & validation
- Fig. 9 Market snapshot
- Fig. 10 Segment snapshot
- Fig. 11 Competitive landscape
- Fig. 12 Intravenous solutions market dynamics
- Fig. 13 Preterm birth rates in the U.S., 2011 to 2030
- Fig. 14 Number of undernourished people in the world, 2015 - 2020 (Million and Percentage)
- Fig. 15 Intravenous solutions market: PORTER's analysis
- Fig. 16 Intravenous solutions market: PESTEL analysis
- Fig. 17 Intravenous solutions market: by product: key takeaways
- Fig. 18 Intravenous solutions market, by product: market share, 2023 & 2030
- Fig. 19 Total parenteral nutrition market, 2018 - 2030 (USD Million)
- Fig. 20 Peripheral parenteral nutrition market, 2018 - 2030 (USD Million)
- Fig. 21 Intravenous solutions market, by end-use: key takeaways
- Fig. 22 Intravenous solutions market, by nutrients: market share, 2023 & 2030
- Fig. 23 Carbohydrates market, 2018 - 2030 (USD Million)
- Fig. 24 Single dose amino acid solution market, 2018 - 2030 (USD Million)
- Fig. 25 Vitamins and minerals, 2018 - 2030 (USD Million)
- Fig. 26 Parenteral lipid emulsion, 2018 - 2030 (USD Million)
- Fig. 27 Others market, 2018 - 2030 (USD Million)
- Fig. 28 Intravenous solutions market revenue, by region, 2023 & 2030 (USD Million)
- Fig. 29 Regional marketplace: key takeaways
- Fig. 30 Regional marketplace: key takeaways
- Fig. 31 North America intravenous solutions market, 2018 - 2030 (USD Million)
- Fig. 32 Key country dynamics
- Fig. 33 U.S. intravenous solutions market, 2018 - 2030 (USD Million)
- Fig. 34 Key country dynamics
- Fig. 35 Canada intravenous solutions market, 2018 - 2030 (USD Million)
- Fig. 36 Europe intravenous solutions market, 2018 - 2030 (USD Million)
- Fig. 37 Key country dynamics
- Fig. 38 UK intravenous solutions market, 2018 - 2030 (USD Million)
- Fig. 39 Key country dynamics
- Fig. 40 Germany intravenous solutions market, 2018 - 2030 (USD Million)
- Fig. 41 Key country dynamics
- Fig. 42 France intravenous solutions market, 2018 - 2030 (USD Million)
- Fig. 43 Key country dynamics
- Fig. 44 Italy intravenous solutions market, 2018 - 2030 (USD Million)
- Fig. 45 Key country dynamics
- Fig. 46 Spain intravenous solutions market, 2018 - 2030 (USD Million)
- Fig. 47 Key country dynamics
- Fig. 48 Denmark intravenous solutions market, 2018 - 2030 (USD Million)
- Fig. 49 Key country dynamics
- Fig. 50 Sweden intravenous solutions market, 2018 - 2030 (USD Million)
- Fig. 51 Key country dynamics
- Fig. 52 Norway intravenous solutions market, 2018 - 2030 (USD Million)
- Fig. 53 Asia Pacific intravenous solutions market, 2018 - 2030 (USD Million)
- Fig. 54 Key country dynamics
- Fig. 55 Japan intravenous solutions market, 2018 - 2030 (USD Million)
- Fig. 56 Key country dynamics
- Fig. 57 China intravenous solutions market, 2018 - 2030 (USD Million)
- Fig. 58 Key country dynamics
- Fig. 59 India intravenous solutions market, 2018 - 2030 (USD Million)
- Fig. 60 Key country dynamics
- Fig. 61 Australia intravenous solutions market, 2018 - 2030 (USD Million)
- Fig. 62 Key country dynamics
- Fig. 63 South Korea intravenous solutions market, 2018 - 2030 (USD Million)
- Fig. 64 Key country dynamics
- Fig. 65 Thailand intravenous solutions market, 2018 - 2030 (USD Million)
- Fig. 66 Latin America intravenous solutions market, 2018 - 2030 (USD Million)
- Fig. 67 Key country dynamics
- Fig. 68 Mexico intravenous solutions market, 2018 - 2030 (USD Million)
- Fig. 69 Key country dynamics
- Fig. 70 Brazil intravenous solutions market, 2018 - 2030 (USD Million)
- Fig. 71 Key country dynamics
- Fig. 72 Argentina intravenous solutions market, 2018 - 2030 (USD Million)
- Fig. 73 MEA intravenous solutions market, 2018 - 2030 (USD Million)
- Fig. 74 Key country dynamics
- Fig. 75 South Africa intravenous solutions market, 2018 - 2030 (USD Million)
- Fig. 76 Key country dynamics
- Fig. 77 Saudi Arabia intravenous solutions market, 2018 - 2030 (USD Million)
- Fig. 78 Key country dynamics
- Fig. 79 UAE intravenous solutions market, 2018 - 2030 (USD Million)
- Fig. 80 Key country dynamics
- Fig. 81 Kuwait intravenous solutions market, 2018 - 2030 (USD Million)
- Fig. 82 Key company categorization
- Fig. 83 Heat map analysis
- Fig. 84 Company market share analysis, 2023
- Fig. 85 Strategy mapping
Intravenous Solutions Market Growth & Trends:
The global intravenous solutions market size is expected to reach USD 22.0 billion by 2030, registering a CAGR of 8% during the forecast period, according to a new report by Grand View Research, Inc. The high prevalence of preterm births, especially in emerging economies such as India and China, is expected to drive market growth during the forecast period. According to WHO, 1 in 10 babies are born preterm, and this is a global concern. Thus, the high incidence of preterm births in emerging economies, improved healthcare infrastructure, and growing healthcare expenditure & patient awareness are expected to be high impact rendering drivers of the market during the forecast period.
The use of parenteral lipid emulsions is driven by the extensive focus of various authorities to limit preterm birth mortality. As of 2021, the preterm birth rate in the U.S. was about 10.5%. Moreover, the annual societal, and economic cost was estimated at USD 25.2 billion for preterm births. Hence, the presence of many neonates requiring supplementary postbirth nutrition is expected to boost the market demand over the forecast period.
In addition, several studies justify the use of parenteral nutrition for patients suffering from malnutrition problems, which increased during the pandemic, leading to market growth. For instance, according to an article published in the Journal of the Academy of Nutrition and Dietetics, many patients admitted to the ICU for COVID-19 treatment suffer from acute malnourishment. Hence, the usage of parenteral nutrition products is expected to increase in the market during the pandemic.
In COVID-19-positive patients, high deficiency of specific micronutrients and vitamins has been reported to be detrimental. Thus, intravenous administration is recommended in such patients to meet the recommended dietary intake. Physicians and nutrition specialists preferred parenteral nutrition over enteral nutrition in COVID-19 patients since enteral nutrition specifically requires the setup of nasogastric tubes, which hampers the noninvasive ventilation provided to COVID-19 patients. The increased risk of nutritional solution aspiration and underfeeding in hospitalized patients for COVID-19 has led to increased adoption of parenteral nutrition.
Intravenous Solutions Market Report Highlights:
- In 2023, the Total Parenteral Nutrition (TPN) segment held a dominant market share of 66.3% and is projected to experience the highest growth rate (CAGR of 8.2%) during the forecast period. TPN involves administering a comprehensive set of nutrients through an intravenous (IV) technique
- In 2023, the market was led by the single-dose amino acid solution segment, holding a significant share of 31.6%. Studies have shown that single-dose amino acids offer a complete protein source, are easily customizable with other parenteral formulations, and are straightforward to administer
- In 2023, North America held a dominant market share of 41%, credited to key players, favorable regulations, and strong reimbursement in countries like the U.S. Assure Infusions, Inc. announced a USD 20 million investment to build an advanced manufacturing facility in Bartow, Florida, addressing the IV solutions demand-supply gap in the U.S.
Table of Contents
Chapter 1 Methodology and Scope
- 1.1 Market Segmentation
- 1.1.1 Segment Definitions
- 1.1.1.1 Product Segment
- 1.1.1.2 Nutrient Segment
- 1.1.1 Segment Definitions
- 1.2 Regional Scope
- 1.3 Estimates And Forecast Timeline
- 1.4 Objectives
- 1.4.1 Objective - 1
- 1.4.2 Objective - 2
- 1.4.3 Objective - 3
- 1.5 Research Methodology
- 1.6 Information Procurement
- 1.6.1 Purchased Database
- 1.6.2 GVR's Internal Database
- 1.6.3 Secondary Sources
- 1.6.4 Primary Research
- 1.7 Information Or Data Analysis
- 1.7.1 Data Analysis Models
- 1.8 Market Formulation & Validation
- 1.9 Model Details
- 1.9.1 Commodity Flow Analysis
- 1.9.1.1 Research Scope And Assumptions
- 1.9.1 Commodity Flow Analysis
- 1.10 List Of Secondary Sources
- 1.11 List Of Primary Sources
- 1.12 List Of Abbreviations
Chapter 2 Executive Summary
- 2.1 Market Snapshot
- 2.2 Segment Snapshot
- 2.3 Competitive Landscape
Chapter 3 Intravenous Solutions Market Variables And Trends
- 3.1 Intravenous Solutions Market Lineage Outlook
- 3.1.1 Ancillary Market Outlook
- 3.2 Market Dynamics
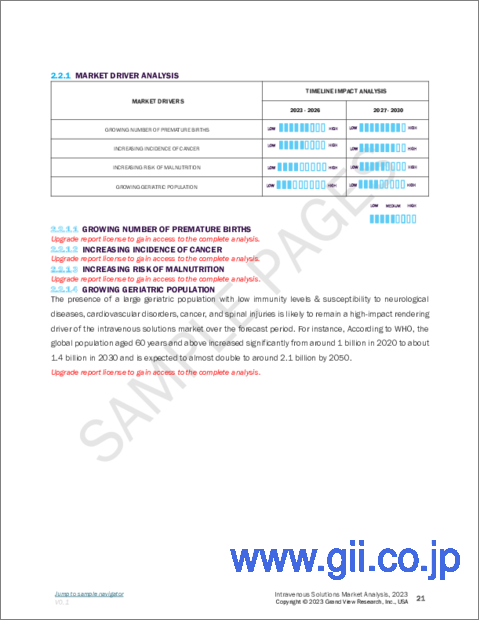
- 3.2.1 Market Driver Impact Analysis
- 3.2.1.1 Growing Number Of Premature Births
- 3.2.1.2 Increasing Incidence Of Cancer
- 3.2.1.3 Increasing Risk Of Malnutrition
- 3.2.1.4 Growing Geriatric Population
- 3.2.2 Market Restraint Analysis
- 3.2.2.1 Shortage Of Parenteral Nutrition Products
- 3.2.2.2 Increased Use Of Enteral Nutrition
- 3.2.2.3 High Risk Of Infections
- 3.2.1 Market Driver Impact Analysis
- 3.3 Regulatory Framework
- 3.3.1 Standards And Compliances
- 3.3.1.1 North America
- 3.3.1.2 Europe
- 3.3.1.3 Apac
- 3.3.1.4 Latin America
- 3.3.1.5 Mea
- 3.3.2 Reimbursement Scenario
- 3.3.2.1 U.S.
- 3.3.2.2 Canada
- 3.3.2.3 Germany
- 3.3.2.4 UK
- 3.3.2.5 Japan
- 3.3.2.6 Australia
- 3.3.2.7 China
- 3.3.1 Standards And Compliances
- 3.4 Impact Of Covid-19 Pandemic
- 3.5 Industry Analysis Tools
- 3.5.1 Porter's Analysis
- 3.5.2 Macroeconomic Analysis
Chapter 4 Intravenous Solutions Market: Product Analysis
- 4.1 Product Movement Analysis & Market Share, 2023 & 2030
- 4.2 Intravenous Solutions Market Estimates & Forecast, By Product (Revenue In USD Million And Volume In Thousand Units)
- 4.3 Total Parenteral Nutrition
- 4.3.1 Total Parenteral Nutrition Market, 2018 - 2030 (Revenue In USD Million And Volume In Thousand Units)
- 4.4 Peripheral Parenteral Nutrition
- 4.4.1 Peripheral Parenteral Nutrition Market, 2018 - 2030 (Revenue In USD Million And Volume In Thousand Units)
Chapter 5 Intravenous Solutions Market: Nutrients Analysis
- 5.1 Nutrients Movement Analysis & Market Share, 2023 & 2030
- 5.2 Intravenous Solutions Market Estimates & Forecast, By Nutrients (Revenue In USD Million And Volume In Thousand Units)
- 5.3 Carbohydrates
- 5.3.1 Carbohydrates Market, 2018 - 2030 (Revenue In USD Million And Volume In Thousand Units)
- 5.4 Single-dose Amino Acid Solution
- 5.4.1 Single-dose Amino Acid Solution Market, 2018 - 2030 (Revenue In USD Million And Volume In Thousand Units)
- 5.5 Vitamins & Minerals
- 5.5.1 Vitamins & Minerals, 2018 - 2030 (Revenue In USD Million And Volume In Thousand Units)
- 5.6 Parenteral Lipid Emulsion
- 5.6.1 Parenteral Lipid Emulsion, 2018 - 2030 (Revenue In USD Million And Volume In Thousand Units)
- 5.7 Others
- 5.7.1 Others Market, 2018 - 2030 (Revenue In USD Million And Volume In Thousand Units)
Chapter 6 Intravenous Solutions Market: Regional Estimates & Trend Analysis
- 6.1 Intravenous Solutions Market: Regional Outlook
- 6.2 North America
- 6.2.1 North America Intravenous Solutions Market Estimates And Forecasts, 2018 - 2030 (Revenue In USD Million And Volume In Thousand Units)
- 6.2.2 U.S.
- 6.2.2.1 Key Country Dynamics
- 6.2.2.2 U.S. Intravenous Solutions Market Estimates And Forecasts, 2018 - 2030 (Revenue In USD Million And Volume In Thousand Units)
- 6.2.3 Canada
- 6.2.3.1 Key Country Dynamics
- 6.2.3.2 Canada Intravenous Solutions Market Estimates And Forecasts, 2018 - 2030 (Revenue In USD Million And Volume In Thousand Units)
- 6.3 Europe
- 6.3.1 Europe Intravenous Solutions Market Estimates And Forecasts, 2018 - 2030 (Revenue In USD Million And Volume In Thousand Units)
- 6.3.2 UK
- 6.3.2.1 Key Country Dynamics
- 6.3.2.2 UK Intravenous Solutions Market Estimates And Forecasts, 2018 - 2030 (Revenue In USD Million And Volume In Thousand Units)
- 6.3.3 Germany
- 6.3.3.1 Key Country Dynamics
- 6.3.3.2 Germany Intravenous Solutions Market Estimates And Forecasts, 2018 - 2030 (Revenue In USD Million And Volume In Thousand Units)
- 6.3.4 France
- 6.3.4.1 Key Country Dynamics
- 6.3.4.2 France Intravenous Solutions Market Estimates And Forecasts, 2018 - 2030 (Revenue In USD Million And Volume In Thousand Units)
- 6.3.5 Italy
- 6.3.5.1 Key Country Dynamics
- 6.3.5.2 Italy Intravenous Solutions Market Estimates And Forecasts, 2018 - 2030 (Revenue In USD Million And Volume In Thousand Units)
- 6.3.6 Spain
- 6.3.6.1 Key Country Dynamics
- 6.3.6.2 Spain Intravenous Solutions Market Estimates And Forecasts, 2018 - 2030 (Revenue In USD Million And Volume In Thousand Units)
- 6.3.7 Denmark
- 6.3.7.1 Key Country Dynamics
- 6.3.7.2 Denmark Intravenous Solutions Market Estimates And Forecasts, 2018 - 2030 (Revenue In USD Million And Volume In Thousand Units)
- 6.3.8 Sweden
- 6.3.8.1 Key Country Dynamics
- 6.3.8.2 Sweden Intravenous Solutions Market Estimates And Forecasts, 2018 - 2030 (Revenue In USD Million And Volume In Thousand Units)
- 6.3.9 Norway
- 6.3.9.1 Key Country Dynamics
- 6.3.9.2 Norway Intravenous Solutions Market Estimates And Forecasts, 2018 - 2030 (Revenue In USD Million And Volume In Thousand Units)
- 6.4 Asia Pacific
- 6.4.1 Asia Pacific Intravenous Solutions Market Estimates And Forecasts, 2018 - 2030 (Revenue In USD Million And Volume In Thousand Units)
- 6.4.2 Japan
- 6.4.2.1 Key Country Dynamics
- 6.4.2.2 Japan Intravenous Solutions Market Estimates And Forecasts, 2018 - 2030 (Revenue In USD Million And Volume In Thousand Units)
- 6.4.3 China
- 6.4.3.1 Key Country Dynamics
- 6.4.3.2 China Intravenous Solutions Market Estimates And Forecasts, 2018 - 2030 (Revenue In USD Million And Volume In Thousand Units)
- 6.4.4 India
- 6.4.4.1 Key Country Dynamics
- 6.4.4.2 India Intravenous Solutions Market Estimates And Forecasts, 2018 - 2030 (Revenue In USD Million And Volume In Thousand Units)
- 6.4.5 Australia
- 6.4.5.1 Key Country Dynamics
- 6.4.5.2 Australia Intravenous Solutions Market Estimates And Forecasts, 2018 - 2030 (Revenue In USD Million And Volume In Thousand Units)
- 6.4.6 South Korea
- 6.4.6.1 Key Country Dynamics
- 6.4.6.2 South Korea Intravenous Solutions Market Estimates And Forecasts, 2018 - 2030 (Revenue In USD Million And Volume In Thousand Units)
- 6.4.7 Thailand
- 6.4.7.1 Key Country Dynamics
- 6.4.7.2 Thailand Intravenous Solutions Market Estimates And Forecasts, 2018 - 2030 (Revenue In USD Million And Volume In Thousand Units)
- 6.5 Latin America
- 6.5.1 Latin America Intravenous Solutions Market Estimates And Forecasts, 2018 - 2030 (Revenue In USD Million And Volume In Thousand Units)
- 6.5.2 Mexico
- 6.5.2.1 Key Country Dynamics
- 6.5.2.2 Mexico Intravenous Solutions Market Estimates And Forecasts, 2018 - 2030 (Revenue In USD Million And Volume In Thousand Units)
- 6.5.3 Brazil
- 6.5.3.1 Key Country Dynamics
- 6.5.3.2 Brazil Intravenous Solutions Market Estimates And Forecasts, 2018 - 2030 (Revenue In USD Million And Volume In Thousand Units)
- 6.5.4 Argentina
- 6.5.4.1 Key Country Dynamics
- 6.5.4.2 Argentina Intravenous Solutions Market Estimates And Forecasts, 2018 - 2030 (Revenue In USD Million And Volume In Thousand Units)
- 6.6 Middle East & Africa (Mea)
- 6.6.1 Mea Intravenous Solutions Market Estimates And Forecasts, 2018 - 2030 (Revenue In USD Million And Volume In Thousand Units)
- 6.6.3 South Africa
- 6.6.3.1 Key Country Dynamics
- 6.6.3.2 South Africa Intravenous Solutions Market Estimates And Forecasts, 2018 - 2030 (Revenue In USD Million And Volume In Thousand Units)
- 6.6.4 Saudi Arabia
- 6.6.4.1 Key Country Dynamics
- 6.6.4.2 Saudi Arabia Intravenous Solutions Market Estimates And Forecasts, 2018 - 2030 (Revenue In USD Million And Volume In Thousand Units)
- 6.6.5 UAE
- 6.6.5.1 Key Country Dynamics
- 6.6.5.2 UAE Intravenous Solutions Market Estimates And Forecasts, 2018 - 2030 (Revenue In USD Million And Volume In Thousand Units)
- 6.6.6 Kuwait
- 6.6.6.1 Key Country Dynamics
- 6.6.6.2 Kuwait Intravenous Solutions Market Estimates And Forecasts, 2018 - 2030 (Revenue In USD Million And Volume In Thousand Units)
Chapter 7 Competitive Analysis
- 7.1 Company Categorization
- 7.1.1 Fresenius Kabi AG
- 7.1.2 Pfizer Inc.
- 7.1.3 Otsuka Pharmaceutical Co. Ltd.
- 7.1.4 Baxter, B. Braun Melsungen AG
- 7.1.5 Vifor Pharma Management Ltd.
- 7.1.6 JW Life Science
- 7.2 Participants' Overview
- 7.3 Financial Performance
- 7.4 Product Benchmarking
- 7.5 Market Participant Categorization
- 7.5.1 Heat Map Analysis
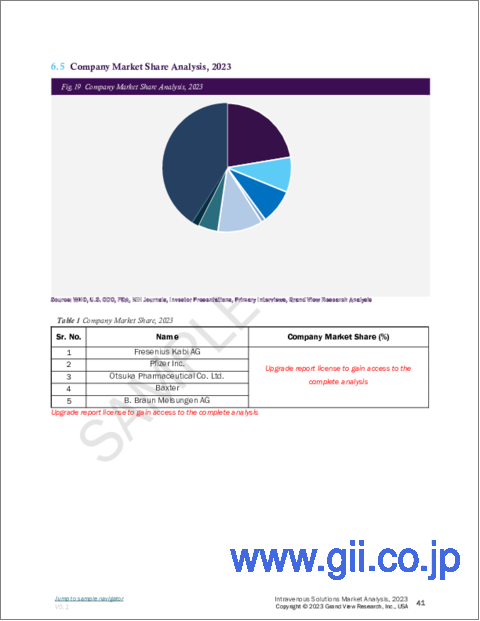
- 7.6 Company Market Share Analysis, 2022
- 7.7 Strategy Mapping
- 7.7.1 Mergers & Acquisitions
- 7.7.2 Product Launch
- 7.7.3 Partnerships & Collaborations
- 7.7.4 Product Approvals
- 7.7.5 Expansion
- 7.7.6 Others

