|
|
市場調査レポート
商品コード
1351412
OTC健康食品市場:製品タイプ別、用途別、形態別、国別、地域別- 産業分析、市場規模、市場シェア、2023-2030年予測OTC Health Products Market, By Product Type, By Application, By Form, By Country, and By Region - Industry Analysis, Market Size, Market Share & Forecast from 2023-2030 |
||||||
|
|
|||||||
|
● お客様のご希望に応じて、既存データの加工や未掲載情報(例:国別セグメント)の追加などの対応が可能です。 詳細はお問い合わせください。 |
|||||||


| OTC健康食品市場:製品タイプ別、用途別、形態別、国別、地域別- 産業分析、市場規模、市場シェア、2023-2030年予測 |
|
出版日: 2023年09月01日
発行: AnalystView Market Insights
ページ情報: 英文 230 Pages
納期: 2~3営業日
|
- 全表示
- 概要
- 図表
- 目次
レポートハイライト
OTC健康製品市場規模は2022年に464億4,393万米ドルとなり、2023年から2030年にかけてCAGR 6.12%で拡大
OTC健康食品市場- 市場力学:
- 消費者のセルフケア志向の高まりと一般的な健康問題の管理能力向上が市場需要を促進
- 医師の診察を必要としない、簡単で便利な治療薬に対する需要の高まりは、時間的制約、ヘルスケアコスト、即効性のある治療薬への要望といった要因によるものです。OTC医薬品は、疼痛管理、風邪やアレルギーの症状緩和、総合的な健康増進など、多様なソリューションを提供しています。このような自己管理型ヘルスケアへのシフトは、規制当局の承認や幅広いOTC製品の入手可能性と相まって、健康志向の人々の進化する嗜好に対応し、市場拡大を後押ししています。
OTC健康食品市場-セグメンテーション分析:
- OTC健康食品の世界市場は4つの主要セグメントで構成されている:製品タイプ、用途、形態、地域です。
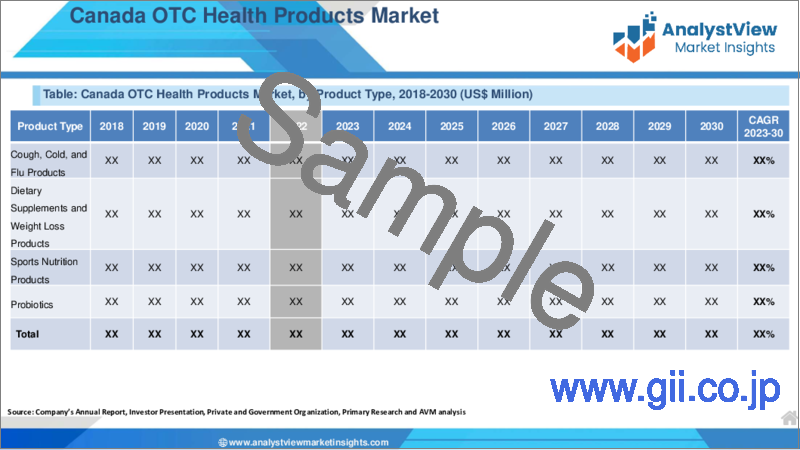
- 製品タイプ別では、咳・風邪・インフルエンザ製品、栄養補助食品・減量製品、スポーツ栄養製品、プロバイオティクス、CBD栄養補助食品など、多様な製品が提供されています。なかでも、咳・風邪・インフルエンザ関連製品は、市場を独占する存在として際立っています。これらの製品は、特に寒い季節に旺盛な需要を享受し続けています。消費者は、咳、鼻づまり、のどの痛みといった一般的な症状を緩和するために、市販薬を利用します。OTC医薬品の魅力は、その利便性と親しみやすさにあり、不快感を和らげ、軽度の呼吸器疾患を管理するための身近で効果的な選択肢を個人に提供しています。
OTC健康食品市場-競合情勢:
OTC医薬品業界は、大手製薬会社と消費者向けヘルスケア・ブランドが市場シェアをめぐって激しい競争を繰り広げています。バイエル、ジョンソン・エンド・ジョンソン、プロクター・アンド・ギャンブルなど、豊富な製品ポートフォリオと定評あるブランドで知られる名だたる企業が圧倒的な地位を占めています。一方、中小企業やプライベートブランドは、特化した処方や独自のソリューションを提供することで競争しています。eコマース・プラットフォームの出現は流通チャネルを拡大し、競争をさらに激化させています。
このダイナミックな情勢の中で成功するために、各社はイノベーションを通じて製品を差別化し、天然成分を取り入れ、革新的なパッケージデザインを採用することに注力しています。消費者の信頼を築き、ブランド・ロイヤルティを育むことは依然として極めて重要であり、企業は広告、調査、品質保証に投資しています。この競合環境は、継続的な技術革新を促進するだけでなく、多様なOTC健康ソリューションを提供することで消費者にも利益をもたらしています。
目次
第1章 OTC健康製品市場概要
- 調査範囲
- 市場推定年数
第2章 エグゼクティブサマリー
- 市場内訳
- 競合考察
第3章 OTC健康製品の主要な市場動向
- 市場促進要因
- 市場抑制要因
- 市場機会
- 今後の市場動向
第4章 OTC健康製品業界の調査
- PEST分析
- ポーターのファイブフォース分析
- 成長見通しのマッピング
- 規制枠組みの分析
第5章 OTC健康製品市場:COVID-19症の影響分析
- 新型コロナウイルス感染症以前の影響分析
- 新型コロナウイルス感染症後の影響分析
第6章 OTC健康製品市場情勢
- OTC健康製品市場シェア分析、2022年
- 主要メーカー別の内訳データ
- 既存企業の分析
- 新興企業の分析
第7章 OTC健康製品市場-製品タイプ別
- 概要
- 製品タイプ別セグメントシェア分析
- 咳、風邪、インフルエンザ関連製品
- 栄養補助食品と減量製品
- スポーツ栄養製品
- プロバイオティクス
- CBD栄養補助食品
第8章 OTC健康製品市場- 用途別
- 概要
- アプリケーション別のセグメントシェア分析
- 消化器の健康
- 女性と男性の健康
- ウェイト・コントロール
- 関節の健康
- 免疫防御
- スポーツフォーミュレーション
- その他
第9章 OTC健康製品市場- 形態別
- 概要
- セグメントシェア分析(フォーム別)
- 液体
- カプセル/錠剤
- グミ
- その他
第10章 OTC健康製品市場-地域別
- イントロダクション
- 北米
- 概要
- 北米の主要メーカー
- 米国
- カナダ
- 欧州
- 概要
- 欧州の主要メーカー
- ドイツ
- イタリア
- 英国
- フランス
- ロシア
- オランダ
- スウェーデン
- ポーランド
- その他
- アジア太平洋(APAC)
- 概要
- アジア太平洋地域の主要メーカー
- インド
- 中国
- 日本
- 韓国
- オーストラリア
- タイ
- インドネシア
- フィリピン
- その他
- ラテンアメリカ
- 概要
- ラテンアメリカの主要メーカー
- ブラジル
- メキシコ
- アルゼンチン
- コロンビア
- その他
- 中東とアフリカ
- 概要
- 中東およびアフリカの主要メーカー
- サウジアラビア
- アラブ首長国連邦
- イスラエル
- トルコ
- アルジェリア
- エジプト
- その他
第11章 主要ベンダー分析-OTC健康製品業界
- 競合ダッシュボード
- 企業プロファイル
- Johnson &Johnson
- Procter &Gamble
- Bayer
- GlaxoSmithKline
- Reckitt Benckiser
- Pfizer
- Sanofi
- Novartis
- Church &Dwight
- Perrigo Company
- GNC Holdings
- Nature's Bounty Co.
- Boiron
- Sundown Naturals
- Now Foods
第12章 アナリストの全方位展望
List of Tables
- TABLE List of data sources
- TABLE Market drivers; Impact Analysis
- TABLE Market restraints; Impact Analysis
- TABLE OTC Health Products Market: Product Type Snapshot (2022)
- TABLE Segment Dashboard; Definition and Scope, by Product Type
- TABLE Global OTC Health Products Market, by Product Type 2018-2030 (USD Million)
- TABLE OTC Health Products Market: Application Snapshot (2022)
- TABLE Segment Dashboard; Definition and Scope, by Application
- TABLE Global OTC Health Products Market, by Application 2018-2030 (USD Million)
- TABLE OTC Health Products Market: Form Snapshot (2022)
- TABLE Segment Dashboard; Definition and Scope, by Form
- TABLE Global OTC Health Products Market, by Form 2018-2030 (USD Million)
- TABLE OTC Health Products Market: Regional snapshot (2022)
- TABLE Segment Dashboard; Definition and Scope, by Region
- TABLE Global OTC Health Products Market, by Region 2018-2030 (USD Million)
- TABLE North America OTC Health Products Market, by Country, 2018-2030 (USD Million)
- TABLE North America OTC Health Products Market, by Product Type, 2018-2030 (USD Million)
- TABLE North America OTC Health Products Market, by Application, 2018-2030 (USD Million)
- TABLE North America OTC Health Products Market, by Form, 2018-2030 (USD Million)
- TABLE Europe OTC Health Products Market, by Country, 2018-2030 (USD Million)
- TABLE Europe OTC Health Products Market, by Product Type, 2018-2030 (USD Million)
- TABLE Europe OTC Health Products Market, by Application, 2018-2030 (USD Million)
- TABLE Europe OTC Health Products Market, by Form, 2018-2030 (USD Million)
- TABLE Asia Pacific OTC Health Products Market, by Country, 2018-2030 (USD Million)
- TABLE Asia Pacific OTC Health Products Market, by Product Type, 2018-2030 (USD Million)
- TABLE Asia Pacific OTC Health Products Market, by Application, 2018-2030 (USD Million)
- TABLE Asia Pacific OTC Health Products Market, by Form, 2018-2030 (USD Million)
- TABLE Latin America OTC Health Products Market, by Country, 2018-2030 (USD Million)
- TABLE Latin America OTC Health Products Market, by Product Type, 2018-2030 (USD Million)
- TABLE Latin America OTC Health Products Market, by Application, 2018-2030 (USD Million)
- TABLE Latin America OTC Health Products Market, by Form, 2018-2030 (USD Million)
- TABLE Middle East and Africa OTC Health Products Market, by Country, 2018-2030 (USD Million)
- TABLE Middle East and Africa OTC Health Products Market, by Product Type, 2018-2030 (USD Million)
- TABLE Middle East and Africa OTC Health Products Market, by Application, 2018-2030 (USD Million)
- TABLE Middle East and Africa OTC Health Products Market, by Form, 2018-2030 (USD Million)
List of Figures
- FIGURE OTC Health Products Market Segmentation
- FIGURE Market research methodology
- FIGURE Value chain analysis
- FIGURE Porter's Five Forces Analysis
- FIGURE Market Attractiveness Analysis
- FIGURE COVID-19 Impact Analysis
- FIGURE Pre & Post COVID-19 Impact Comparision Study
- FIGURE Competitive Landscape; Key company market share analysis, 2022
- FIGURE Product Type segment market share analysis, 2022 & 2030
- FIGURE Product Type segment market size forecast and trend analysis, 2018 to 2030 (USD Million)
- FIGURE Application segment market share analysis, 2022 & 2030
- FIGURE Application segment market size forecast and trend analysis, 2018 to 2030 (USD Million)
- FIGURE Form segment market share analysis, 2022 & 2030
- FIGURE Form segment market size forecast and trend analysis, 2018 to 2030 (USD Million)
- FIGURE Regional segment market share analysis, 2022 & 2030
- FIGURE Regional segment market size forecast and trend analysis, 2018 to 2030 (USD Million)
- FIGURE North America OTC Health Products Market share and leading players, 2022
- FIGURE Europe OTC Health Products Market share and leading players, 2022
- FIGURE Asia Pacific OTC Health Products Market share and leading players, 2022
- FIGURE Latin America OTC Health Products Market share and leading players, 2022
- FIGURE Middle East and Africa OTC Health Products Market share and leading players, 2022
- FIGURE North America market share analysis by country, 2022
- FIGURE U.S. OTC Health Products Market size, forecast and trend analysis, 2018 to 2030 (USD Million)
- FIGURE Canada OTC Health Products Market size, forecast and trend analysis, 2018 to 2030 (USD Million)
- FIGURE Europe OTC Health Products Market share analysis by country, 2022
- FIGURE Germany OTC Health Products Market size, forecast and trend analysis, 2018 to 2030 (USD Million)
- FIGURE Spain OTC Health Products Market size, forecast and trend analysis, 2018 to 2030 (USD Million)
- FIGURE Italy OTC Health Products Market size, forecast and trend analysis, 2018 to 2030 (USD Million)
- FIGURE France OTC Health Products Market size, forecast and trend analysis, 2018 to 2030 (USD Million)
- FIGURE UK OTC Health Products Market size, forecast and trend analysis, 2018 to 2030 (USD Million)
- FIGURE Russia OTC Health Products Market size, forecast and trend analysis, 2018 to 2030 (USD Million)
- FIGURE Netherlands OTC Health Products Market size, forecast and trend analysis, 2018 to 2030 (USD Million)
- FIGURE Sweden OTC Health Products Market size, forecast and trend analysis, 2018 to 2030 (USD Million)
- FIGURE Poland OTC Health Products Market size, forecast and trend analysis, 2018 to 2030 (USD Million)
- FIGURE Rest of the Europe OTC Health Products Market size, forecast and trend analysis, 2018 to 2030 (USD Million)
- FIGURE Asia Pacific OTC Health Products Market share analysis by country, 2022
- FIGURE India OTC Health Products Market size, forecast and trend analysis, 2018 to 2030 (USD Million)
- FIGURE China OTC Health Products Market size, forecast and trend analysis, 2018 to 2030 (USD Million)
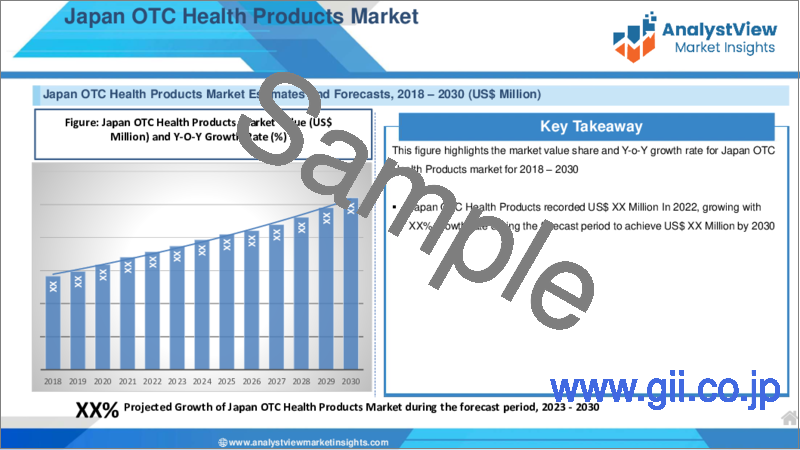
- FIGURE Japan OTC Health Products Market size, forecast and trend analysis, 2018 to 2030 (USD Million)
- FIGURE South Korea OTC Health Products Market size, forecast and trend analysis, 2018 to 2030 (USD Million)
- FIGURE Australia OTC Health Products Market size, forecast and trend analysis, 2018 to 2030 (USD Million)
- FIGURE Thailand OTC Health Products Market size, forecast and trend analysis, 2018 to 2030 (USD Million)
- FIGURE Indonesia OTC Health Products Market size, forecast and trend analysis, 2018 to 2030 (USD Million)
- FIGURE Phillipines OTC Health Products Market size, forecast and trend analysis, 2018 to 2030 (USD Million)
- FIGURE Rest of APAC OTC Health Products Market size, forecast and trend analysis, 2018 to 2030 (USD Million)
- FIGURE Latin America OTC Health Products Market size, forecast and trend analysis, 2018 to 2030 (USD Million)
- FIGURE Latin America OTC Health Products Market share analysis by country, 2022
- FIGURE Brazil OTC Health Products Market size, forecast and trend analysis, 2018 to 2030 (USD Million)
- FIGURE Mexico OTC Health Products Market size, forecast and trend analysis, 2018 to 2030 (USD Million)
- FIGURE Argentina OTC Health Products Market size, forecast and trend analysis, 2018 to 2030 (USD Million)
- FIGURE Colombia OTC Health Products Market size, forecast and trend analysis, 2018 to 2030 (USD Million)
- FIGURE Rest of LATAM OTC Health Products Market size, forecast and trend analysis, 2018 to 2030 (USD Million)
- FIGURE Middle East and Africa OTC Health Products Market size, forecast and trend analysis, 2018 to 2030 (USD Million)
- FIGURE Middle East and Africa OTC Health Products Market share analysis by country, 2022
- FIGURE Saudi Arabia OTC Health Products Market size, forecast and trend analysis, 2018 to 2030 (USD Million)
- FIGURE United Arab Emirates OTC Health Products Market size, forecast and trend analysis, 2018 to 2030 (USD Million)
- FIGURE Israel OTC Health Products Market size, forecast and trend analysis, 2018 to 2030 (USD Million)
- FIGURE Turkey OTC Health Products Market size, forecast and trend analysis, 2018 to 2030 (USD Million)
- FIGURE Algeria OTC Health Products Market size, forecast and trend analysis, 2018 to 2030 (USD Million)
- FIGURE Egypt OTC Health Products Market size, forecast and trend analysis, 2018 to 2030 (USD Million)
- FIGURE Rest of MEA OTC Health Products Market size, forecast and trend analysis, 2018 to 2030 (USD Million)
REPORT HIGHLIGHT
OTC Health Products Market size was valued at USD 46,443.93 Million in 2022, expanding at a CAGR of 6.12% from 2023 to 2030.
Non-prescription health products, commonly known as over-the-counter (OTC) products, encompass a range of medicines, vitamins, and personal care items that can be acquired without the need for a doctor's prescription. These products are designed to empower individuals to manage their own health and well-being, addressing common health concerns such as pain relief, coughs, allergies, colds, digestive issues, and skincare. OTC health products undergo rigorous evaluation and approval by the FDA, ensuring their safety and effectiveness when used as directed. They offer convenient and accessible solutions for consumers seeking relief from minor ailments or aiming to enhance their overall health without the necessity of consulting a healthcare professional.
OTC Health Products Market - Market Dynamics:
- The increasing consumer preference for self-care and empowerment in managing common health issues to propel market demand
- The increasing demand for easy and convenient remedies to address minor health issues, eliminating the need for doctor visits, is driven by factors such as time constraints, healthcare costs, and the desire for immediate relief. OTC medications offer a diverse range of solutions for managing pain, alleviating cold and allergy symptoms, and promoting overall well-being. This shift toward self-directed healthcare, combined with regulatory approvals and the availability of a wide array of OTC products, propels market expansion, catering to the evolving preferences of health-conscious individuals.
OTC Health Products Market - Key Insights:
- The Global OTC Health Products Market is segmented based on Product Type, Application, Distribution Channel, and Region.
- The market is categorized into several segments based on Product Type, including Pain Relief Products, Digestive Health Products, Cold and Allergy Products, Skin Care Products, Vitamins and Minerals, and Others.
- Among these, Cough, Cold, and Flu Products dominated the market in 2022 due to their high demand for alleviating common cold and flu symptoms.
- On the other hand, Digestive Health Products emerged as the leading segment in terms of applications in 2022. North America emerged as the dominant region in terms of revenue generation in 2022.
OTC Health Products Market- Segmentation Analysis:
- The Global OTC Health Products Market is structured around four key segments: Product Type, Application, Form, and Region.
- Within the Product Type category, there is a diverse range of offerings, including Cough, Cold, and Flu Products, Dietary Supplements and Weight Loss Products, Sports Nutrition Products, Probiotics, and CBD Nutraceutical Products. Among these, the Cough, Cold, and Flu Products segment stands out as the dominant force in the market. These products continue to enjoy robust demand, particularly during the colder seasons. Consumers turn to over-the-counter solutions for relief from common symptoms such as coughing, congestion, and sore throat. The appeal of OTC remedies lies in their convenience and familiarity, providing individuals with accessible and effective options for alleviating discomfort and managing minor respiratory ailments.
OTC Health Products Market- Competitive Landscape:
The OTC health products industry witnesses intense competition, with major pharmaceutical companies and consumer healthcare brands battling for market share. Esteemed companies like Bayer, Johnson & Johnson, and Procter & Gamble, known for their extensive product portfolios and established brands, hold a dominant position. Meanwhile, smaller firms and private labels compete by offering specialized formulations and unique solutions. The emergence of e-commerce platforms has expanded distribution channels, further intensifying competition.
To thrive in this dynamic landscape, companies focus on setting their products apart through innovation, incorporating natural ingredients, and embracing innovative packaging designs. Building consumer trust and fostering brand loyalty remain pivotal, prompting companies to invest in advertising, research, and quality assurance. This competitive environment not only fuels ongoing innovation but also benefits consumers by providing a diverse array of OTC health solutions.
SCOPE OF THE REPORT
The scope of this report covers the market by its major segments, which include as follows:
GLOBAL OTC HEALTH PRODUCTS MARKET KEY PLAYERS
- Johnson & Johnson
- Procter & Gamble
- Bayer
- GlaxoSmithKline
- Reckitt Benckiser
- Pfizer
- Sanofi
- Novartis
- Church & Dwight
- Perrigo Company
- GNC Holdings
- Nature's Bounty Co.
- Boiron
- Sundown Naturals
- Now Foods
GLOBAL OTC HEALTH PRODUCTS MARKET, BY PRODUCT TYPE
- Cough, Cold, and Flu Products
- Dietary Supplements and Weight Loss Products
- Sports Nutrition Products
- Probiotics
- CBD Nutraceutical Products
GLOBAL OTC HEALTH PRODUCTS MARKET, BY APPLICATION
- Digestive health
- Women's & Men's Health
- Weight Control
- Joint health
- Immune Defense
- Sports Formulation
- Others
GLOBAL OTC HEALTH PRODUCTS MARKET, BY FORM
- Liquid
- Capsules/Tablets
- Gummies
- Others
GLOBAL OTC HEALTH PRODUCTS MARKET, BY REGION
- North America
- The U.S.
- Canada
- Europe
- Germany
- France
- Italy
- Spain
- United Kingdom
- Russia
- Netherlands
- Sweden
- Poland
- Rest of Europe
- Asia Pacific
- India
- China
- South Korea
- Japan
- Australia
- Thailand
- Indonesia
- Philippines
- Rest of APAC
- Latin America
- Brazil
- Mexico
- Argentina
- Colombia
- Rest of LATAM
- The Middle East and Africa
- Saudi Arabia
- United Arab Emirates
- Israel
- Turkey
- Algeria
- Egypt
- Rest of MEA
Table of Contents
1. OTC Health Products Market Overview
- 1.1. Study Scope
- 1.2. Market Estimation Years
2. Executive Summary
- 2.1. Market Snippet
- 2.1.1. OTC Health Products Market Snippet by Product Type
- 2.1.2. OTC Health Products Market Snippet by Application
- 2.1.3. OTC Health Products Market Snippet by Form
- 2.1.4. OTC Health Products Market Snippet by Country
- 2.1.5. OTC Health Products Market Snippet by Region
- 2.2. Competitive Insights
3. OTC Health Products Key Market Trends
- 3.1. OTC Health Products Market Drivers
- 3.1.1. Impact Analysis of Market Drivers
- 3.2. OTC Health Products Market Restraints
- 3.2.1. Impact Analysis of Market Restraints
- 3.3. OTC Health Products Market Opportunities
- 3.4. OTC Health Products Market Future Trends
4. OTC Health Products Industry Study
- 4.1. PEST Analysis
- 4.2. Porter's Five Forces Analysis
- 4.3. Growth Prospect Mapping
- 4.4. Regulatory Framework Analysis
5. OTC Health Products Market: COVID-19 Impact Analysis
- 5.1. Pre-COVID-19 Impact Analysis
- 5.2. Post-COVID-19 Impact Analysis
- 5.2.1. Top Performing Segments
- 5.2.2. Marginal Growth Segments
- 5.2.3. Top Looser Segments
- 5.2.4. Marginal Loss Segments
6. OTC Health Products Market Landscape
- 6.1. OTC Health Products Market Share Analysis, 2022
- 6.2. Breakdown Data, by Key Manufacturer
- 6.2.1. Established Players' Analysis
- 6.2.2. Emerging Players' Analysis
7. OTC Health Products Market - By Product Type
- 7.1. Overview
- 7.1.1. Segment Share Analysis, By Product Type, 2022 & 2030 (%)
- 7.1.2. Cough, Cold, and Flu Products
- 7.1.3. Dietary Supplements and Weight Loss Products
- 7.1.4. Sports Nutrition Products
- 7.1.5. Probiotics
- 7.1.6. CBD Nutraceutical Products
8. OTC Health Products Market - By Application
- 8.1. Overview
- 8.1.1. Segment Share Analysis, By Application, 2022 & 2030 (%)
- 8.1.2. Digestive health
- 8.1.3. Women's & Men's Health
- 8.1.4. Weight Control
- 8.1.5. Joint health
- 8.1.6. Immune Defence
- 8.1.7. Sports Formulation
- 8.1.8. Others
9. OTC Health Products Market - By Form
- 9.1. Overview
- 9.1.1. Segment Share Analysis, By Form, 2022 & 2030 (%)
- 9.1.2. Liquid
- 9.1.3. Capsules/Tablets
- 9.1.4. Gummies
- 9.1.5. Others
10. OTC Health Products Market- By Geography
- 10.1. Introduction
- 10.1.1. Segment Share Analysis, By Geography, 2022 & 2030 (%)
- 10.2. North America
- 10.2.1. Overview
- 10.2.2. OTC Health Products Key Manufacturers in North America
- 10.2.3. North America Market Size and Forecast, By Country, 2018 - 2030 (US$ Million)
- 10.2.4. North America Market Size and Forecast, By Product Type, 2018 - 2030 (US$ Million)
- 10.2.5. North America Market Size and Forecast, By Application, 2018 - 2030 (US$ Million)
- 10.2.6. North America Market Size and Forecast, By Form, 2018 - 2030 (US$ Million)
- 10.2.7. U.S.
- 10.2.7.1. Overview
- 10.2.7.2. Market Analysis, Forecast, and Y-O-Y Growth Rate, 2018 - 2030, (US$ Million)
- 10.2.7.3. U.S. Market Size and Forecast, By Product Type, 2018 - 2030 (US$ Million)
- 10.2.7.4. U.S. Market Size and Forecast, By Application, 2018 - 2030 (US$ Million)
- 10.2.7.5. U.S. Market Size and Forecast, By Form, 2018 - 2030 (US$ Million)
- 10.2.8. Canada
- 10.2.8.1. Overview
- 10.2.8.2. Market Analysis, Forecast, and Y-O-Y Growth Rate, 2018 - 2030, (US$ Million)
- 10.2.8.3. Canada Market Size and Forecast, By Product Type, 2018 - 2030 (US$ Million)
- 10.2.8.4. Canada Market Size and Forecast, By Application, 2018 - 2030 (US$ Million)
- 10.2.8.5. Canada Market Size and Forecast, By Form, 2018 - 2030 (US$ Million)
- 10.3. Europe
- 10.3.1. Overview
- 10.3.2. OTC Health Products Key Manufacturers in Europe
- 10.3.3. Europe Market Size and Forecast, By Country, 2018 - 2030 (US$ Million)
- 10.3.4. Europe Market Size and Forecast, By Product Type, 2018 - 2030 (US$ Million)
- 10.3.5. Europe Market Size and Forecast, By Application, 2018 - 2030 (US$ Million)
- 10.3.6. Europe Market Size and Forecast, By Form, 2018 - 2030 (US$ Million)
- 10.3.7. Germany
- 10.3.7.1. Overview
- 10.3.7.2. Market Analysis, Forecast, and Y-O-Y Growth Rate, 2018 - 2030, (US$ Million)
- 10.3.7.3. Germany Market Size and Forecast, By Product Type, 2018 - 2030 (US$ Million)
- 10.3.7.4. Germany Market Size and Forecast, By Application, 2018 - 2030 (US$ Million)
- 10.3.7.5. Germany Market Size and Forecast, By Form, 2018 - 2030 (US$ Million)
- 10.3.8. Italy
- 10.3.8.1. Overview
- 10.3.8.2. Market Analysis, Forecast, and Y-O-Y Growth Rate, 2018 - 2030, (US$ Million)
- 10.3.8.3. Italy Market Size and Forecast, By Product Type, 2018 - 2030 (US$ Million)
- 10.3.8.4. Italy Market Size and Forecast, By Application, 2018 - 2030 (US$ Million)
- 10.3.8.5. Italy Market Size and Forecast, By Form, 2018 - 2030 (US$ Million)
- 10.3.9. United Kingdom
- 10.3.9.1. Overview
- 10.3.9.2. Market Analysis, Forecast, and Y-O-Y Growth Rate, 2018 - 2030, (US$ Million)
- 10.3.9.3. United Kingdom Market Size and Forecast, By Product Type, 2018 - 2030 (US$ Million)
- 10.3.9.4. United Kingdom Market Size and Forecast, By Application, 2018 - 2030 (US$ Million)
- 10.3.9.5. United Kingdom Market Size and Forecast, By Form, 2018 - 2030 (US$ Million)
- 10.3.10. France
- 10.3.10.1. Overview
- 10.3.10.2. Market Analysis, Forecast, and Y-O-Y Growth Rate, 2018 - 2030, (US$ Million)
- 10.3.10.3. France Market Size and Forecast, By Product Type, 2018 - 2030 (US$ Million)
- 10.3.10.4. France Market Size and Forecast, By Application, 2018 - 2030 (US$ Million)
- 10.3.10.5. France Market Size and Forecast, By Form, 2018 - 2030 (US$ Million)
- 10.3.11. Russia
- 10.3.11.1. Market Analysis, Forecast, and Y-O-Y Growth Rate, 2018 - 2030, (US$ Million)
- 10.3.11.2. Russia Market Size and Forecast, By Product Type, 2018 - 2030 (US$ Million)
- 10.3.11.3. Russia Market Size and Forecast, By Application, 2018 - 2030 (US$ Million)
- 10.3.11.4. Russia Market Size and Forecast, By Form, 2018 - 2030 (US$ Million)
- 10.3.12. Netherlands
- 10.3.12.1. Market Analysis, Forecast, and Y-O-Y Growth Rate, 2018 - 2030, (US$ Million)
- 10.3.12.2. Netherlands Market Size and Forecast, By Product Type, 2018 - 2030 (US$ Million)
- 10.3.12.3. Netherlands Market Size and Forecast, By Application, 2018 - 2030 (US$ Million)
- 10.3.12.4. Netherlands Market Size and Forecast, By Form, 2018 - 2030 (US$ Million)
- 10.3.13. Sweden
- 10.3.13.1. Market Analysis, Forecast, and Y-O-Y Growth Rate, 2018 - 2030, (US$ Million)
- 10.3.13.2. Sweden Market Size and Forecast, By Product Type, 2018 - 2030 (US$ Million)
- 10.3.13.3. Sweden Market Size and Forecast, By Application, 2018 - 2030 (US$ Million)
- 10.3.13.4. Sweden Market Size and Forecast, By Form, 2018 - 2030 (US$ Million)
- 10.3.14. Poland
- 10.3.14.1. Market Analysis, Forecast, and Y-O-Y Growth Rate, 2018 - 2030, (US$ Million)
- 10.3.14.2. Poland Market Size and Forecast, By Product Type, 2018 - 2030 (US$ Million)
- 10.3.14.3. Poland Market Size and Forecast, By Application, 2018 - 2030 (US$ Million)
- 10.3.14.4. Poland Market Size and Forecast, By Form, 2018 - 2030 (US$ Million)
- 10.3.15. Rest of Europe
- 10.3.15.1. Overview
- 10.3.15.2. Market Analysis, Forecast, and Y-O-Y Growth Rate, 2018 - 2030, (US$ Million)
- 10.3.15.3. Rest of the Europe Market Size and Forecast, By Product Type, 2018 - 2030 (US$ Million)
- 10.3.15.4. Rest of the Europe Market Size and Forecast, By Application, 2018 - 2030 (US$ Million)
- 10.3.15.5. Rest of the Europe Market Size and Forecast, By Form, 2018 - 2030 (US$ Million)
- 10.4. Asia Pacific (APAC)
- 10.4.1. Overview
- 10.4.2. OTC Health Products Key Manufacturers in Asia Pacific
- 10.4.3. Asia Pacific Market Size and Forecast, By Country, 2018 - 2030 (US$ Million)
- 10.4.4. Asia Pacific Market Size and Forecast, By Product Type, 2018 - 2030 (US$ Million)
- 10.4.5. Asia Pacific Market Size and Forecast, By Application, 2018 - 2030 (US$ Million)
- 10.4.6. Asia Pacific Market Size and Forecast, By Form, 2018 - 2030 (US$ Million)
- 10.4.7. India
- 10.4.7.1. Overview
- 10.4.7.2. Market Analysis, Forecast, and Y-O-Y Growth Rate, 2018 - 2030, (US$ Million)
- 10.4.7.3. India Market Size and Forecast, By Product Type, 2018 - 2030 (US$ Million)
- 10.4.7.4. India Market Size and Forecast, By Application, 2018 - 2030 (US$ Million)
- 10.4.7.5. India Market Size and Forecast, By Form, 2018 - 2030 (US$ Million)
- 10.4.8. China
- 10.4.8.1. Overview
- 10.4.8.2. Market Analysis, Forecast, and Y-O-Y Growth Rate, 2018 - 2030, (US$ Million)
- 10.4.8.3. China Market Size and Forecast, By Product Type, 2018 - 2030 (US$ Million)
- 10.4.8.4. China Market Size and Forecast, By Application, 2018 - 2030 (US$ Million)
- 10.4.8.5. China Market Size and Forecast, By Form, 2018 - 2030 (US$ Million)
- 10.4.9. Japan
- 10.4.9.1. Overview
- 10.4.9.2. Market Analysis, Forecast, and Y-O-Y Growth Rate, 2018 - 2030, (US$ Million)
- 10.4.9.3. Japan Market Size and Forecast, By Product Type, 2018 - 2030 (US$ Million)
- 10.4.9.4. Japan Market Size and Forecast, By Application, 2018 - 2030 (US$ Million)
- 10.4.9.5. Japan Market Size and Forecast, By Form, 2018 - 2030 (US$ Million)
- 10.4.10. South Korea
- 10.4.10.1. Overview
- 10.4.10.2. Market Analysis, Forecast, and Y-O-Y Growth Rate, 2018 - 2030, (US$ Million)
- 10.4.10.3. South Korea Market Size and Forecast, By Product Type, 2018 - 2030 (US$ Million)
- 10.4.10.4. South Korea Market Size and Forecast, By Application, 2018 - 2030 (US$ Million)
- 10.4.10.5. South Korea Market Size and Forecast, By Form, 2018 - 2030 (US$ Million)
- 10.4.11. Australia
- 10.4.11.1. Overview
- 10.4.11.2. Market Analysis, Forecast, and Y-O-Y Growth Rate, 2018 - 2030, (US$ Million)
- 10.4.11.3. Australia Market Size and Forecast, By Product Type, 2018 - 2030 (US$ Million)
- 10.4.11.4. Australia Market Size and Forecast, By Application, 2018 - 2030 (US$ Million)
- 10.4.11.5. Australia Market Size and Forecast, By Form, 2018 - 2030 (US$ Million)
- 10.4.12. Thailand
- 10.4.12.1. Overview
- 10.4.12.2. Market Analysis, Forecast, and Y-O-Y Growth Rate, 2018 - 2030, (US$ Million)
- 10.4.12.3. Thailand Market Size and Forecast, By Product Type, 2018 - 2030 (US$ Million)
- 10.4.12.4. Thailand Market Size and Forecast, By Application, 2018 - 2030 (US$ Million)
- 10.4.12.5. Thailand Market Size and Forecast, By Form, 2018 - 2030 (US$ Million)
- 10.4.13. Indonesia
- 10.4.13.1. Overview
- 10.4.13.2. Market Analysis, Forecast, and Y-O-Y Growth Rate, 2018 - 2030, (US$ Million)
- 10.4.13.3. Indonesia Market Size and Forecast, By Product Type, 2018 - 2030 (US$ Million)
- 10.4.13.4. Indonesia Market Size and Forecast, By Application, 2018 - 2030 (US$ Million)
- 10.4.13.5. Indonesia Market Size and Forecast, By Form, 2018 - 2030 (US$ Million)
- 10.4.14. Philippines
- 10.4.14.1. Overview
- 10.4.14.2. Market Analysis, Forecast, and Y-O-Y Growth Rate, 2018 - 2030, (US$ Million)
- 10.4.14.3. Philippines Market Size and Forecast, By Product Type, 2018 - 2030 (US$ Million)
- 10.4.14.4. Philippines Market Size and Forecast, By Application, 2018 - 2030 (US$ Million)
- 10.4.14.5. Philippines Market Size and Forecast, By Form, 2018 - 2030 (US$ Million)
- 10.4.15. Rest of APAC
- 10.4.15.1. Overview
- 10.4.15.2. Market Analysis, Forecast, and Y-O-Y Growth Rate, 2018 - 2030, (US$ Million)
- 10.4.15.3. Rest of APAC Market Size and Forecast, By Product Type, 2018 - 2030 (US$ Million)
- 10.4.15.4. Rest of APAC Market Size and Forecast, By Application, 2018 - 2030 (US$ Million)
- 10.4.15.5. Rest of APAC Market Size and Forecast, By Form, 2018 - 2030 (US$ Million)
- 10.5. Latin America
- 10.5.1. Overview
- 10.5.2. OTC Health Products Key Manufacturers in Latin America
- 10.5.3. Latin America Market Size and Forecast, By Country, 2018 - 2030 (US$ Million)
- 10.5.4. Latin America Market Size and Forecast, By Product Type, 2018 - 2030 (US$ Million)
- 10.5.5. Latin America Market Size and Forecast, By Application, 2018 - 2030 (US$ Million)
- 10.5.6. Latin America Market Size and Forecast, By Form, 2018 - 2030 (US$ Million)
- 10.5.7. Brazil
- 10.5.7.1. Overview
- 10.5.7.2. Market Analysis, Forecast, and Y-O-Y Growth Rate, 2018 - 2030, (US$ Million)
- 10.5.7.3. Brazil Market Size and Forecast, By Product Type, 2018 - 2030 (US$ Million)
- 10.5.7.4. Brazil Market Size and Forecast, By Application, 2018 - 2030 (US$ Million)
- 10.5.7.5. Brazil Market Size and Forecast, By Form, 2018 - 2030 (US$ Million)
- 10.5.8. Mexico
- 10.5.8.1. Overview
- 10.5.8.2. Market Analysis, Forecast, and Y-O-Y Growth Rate, 2018 - 2030, (US$ Million)
- 10.5.8.3. Mexico Market Size and Forecast, By Product Type, 2018 - 2030 (US$ Million)
- 10.5.8.4. Mexico Market Size and Forecast, By Application, 2018 - 2030 (US$ Million)
- 10.5.8.5. Mexico Market Size and Forecast, By Form, 2018 - 2030 (US$ Million)
- 10.5.9. Argentina
- 10.5.9.1. Overview
- 10.5.9.2. Market Analysis, Forecast, and Y-O-Y Growth Rate, 2018 - 2030, (US$ Million)
- 10.5.9.3. Argentina Market Size and Forecast, By Product Type, 2018 - 2030 (US$ Million)
- 10.5.9.4. Argentina Market Size and Forecast, By Application, 2018 - 2030 (US$ Million)
- 10.5.9.5. Argentina Market Size and Forecast, By Form, 2018 - 2030 (US$ Million)
- 10.5.10. Colombia
- 10.5.10.1. Overview
- 10.5.10.2. Market Analysis, Forecast, and Y-O-Y Growth Rate, 2018 - 2030, (US$ Million)
- 10.5.10.3. Colombia Market Size and Forecast, By Product Type, 2018 - 2030 (US$ Million)
- 10.5.10.4. Colombia Market Size and Forecast, By Application, 2018 - 2030 (US$ Million)
- 10.5.10.5. Colombia Market Size and Forecast, By Form, 2018 - 2030 (US$ Million)
- 10.5.11. Rest of LATAM
- 10.5.11.1. Overview
- 10.5.11.2. Market Analysis, Forecast, and Y-O-Y Growth Rate, 2018 - 2030, (US$ Million)
- 10.5.11.3. Rest of LATAM Market Size and Forecast, By Product Type, 2018 - 2030 (US$ Million)
- 10.5.11.4. Rest of LATAM Market Size and Forecast, By Application, 2018 - 2030 (US$ Million)
- 10.5.11.5. Rest of LATAM Market Size and Forecast, By Form, 2018 - 2030 (US$ Million)
- 10.6. Middle East and Africa
- 10.6.1. Overview
- 10.6.2. OTC Health Products Key Manufacturers in Middle East and Africa
- 10.6.3. Middle East and Africa Market Size and Forecast, By Country, 2018 - 2030 (US$ Million)
- 10.6.4. Middle East and Africa Market Size and Forecast, By Product Type, 2018 - 2030 (US$ Million)
- 10.6.5. Middle East and Africa Market Size and Forecast, By Application, 2018 - 2030 (US$ Million)
- 10.6.6. Middle East and Africa Market Size and Forecast, By Form, 2018 - 2030 (US$ Million)
- 10.6.7. Saudi Arabia
- 10.6.7.1. Overview
- 10.6.7.2. Market Analysis, Forecast, and Y-O-Y Growth Rate, 2018 - 2030, (US$ Million)
- 10.6.7.3. Saudi Arabia Market Size and Forecast, By Product Type, 2018 - 2030 (US$ Million)
- 10.6.7.4. Saudi Arabia Market Size and Forecast, By Application, 2018 - 2030 (US$ Million)
- 10.6.7.5. Saudi Arabia Market Size and Forecast, By Form, 2018 - 2030 (US$ Million)
- 10.6.8. United Arab Emirates
- 10.6.8.1. Overview
- 10.6.8.2. Market Analysis, Forecast, and Y-O-Y Growth Rate, 2018 - 2030, (US$ Million)
- 10.6.8.3. United Arab Emirates Market Size and Forecast, By Product Type, 2018 - 2030 (US$ Million)
- 10.6.8.4. United Arab Emirates Market Size and Forecast, By Application, 2018 - 2030 (US$ Million)
- 10.6.8.5. United Arab Emirates Market Size and Forecast, By Form, 2018 - 2030 (US$ Million)
- 10.6.9. Israel
- 10.6.9.1. Overview
- 10.6.9.2. Market Analysis, Forecast, and Y-O-Y Growth Rate, 2018 - 2030, (US$ Million)
- 10.6.9.3. Israel Market Size and Forecast, By Product Type, 2018 - 2030 (US$ Million)
- 10.6.9.4. Israel Market Size and Forecast, By Application, 2018 - 2030 (US$ Million)
- 10.6.9.5. Israel Market Size and Forecast, By Form, 2018 - 2030 (US$ Million)
- 10.6.10. Turkey
- 10.6.10.1. Overview
- 10.6.10.2. Market Analysis, Forecast, and Y-O-Y Growth Rate, 2018 - 2030, (US$ Million)
- 10.6.10.3. Turkey Market Size and Forecast, By Product Type, 2018 - 2030 (US$ Million)
- 10.6.10.4. Turkey Market Size and Forecast, By Application, 2018 - 2030 (US$ Million)
- 10.6.10.5. Turkey Market Size and Forecast, By Form, 2018 - 2030 (US$ Million)
- 10.6.11. Algeria
- 10.6.11.1. Overview
- 10.6.11.2. Market Analysis, Forecast, and Y-O-Y Growth Rate, 2018 - 2030, (US$ Million)
- 10.6.11.3. Algeria Market Size and Forecast, By Product Type, 2018 - 2030 (US$ Million)
- 10.6.11.4. Algeria Market Size and Forecast, By Application, 2018 - 2030 (US$ Million)
- 10.6.11.5. Algeria Market Size and Forecast, By Form, 2018 - 2030 (US$ Million)
- 10.6.12. Egypt
- 10.6.12.1. Overview
- 10.6.12.2. Market Analysis, Forecast, and Y-O-Y Growth Rate, 2018 - 2030, (US$ Million)
- 10.6.12.3. Egypt Market Size and Forecast, By Product Type, 2018 - 2030 (US$ Million)
- 10.6.12.4. Egypt Market Size and Forecast, By Application, 2018 - 2030 (US$ Million)
- 10.6.12.5. Egypt Market Size and Forecast, By Form, 2018 - 2030 (US$ Million)
- 10.6.13. Rest of MEA
- 10.6.13.1. Overview
- 10.6.13.2. Market Analysis, Forecast, and Y-O-Y Growth Rate, 2018 - 2030, (US$ Million)
- 10.6.13.3. Rest of MEA Market Size and Forecast, By Product Type, 2018 - 2030 (US$ Million)
- 10.6.13.4. Rest of MEA Market Size and Forecast, By Application, 2018 - 2030 (US$ Million)
- 10.6.13.5. Rest of MEA Market Size and Forecast, By Form, 2018 - 2030 (US$ Million)
11. Key Vendor Analysis- OTC Health Products Industry
- 11.1. Competitive Dashboard
- 11.2. Company Profiles
- 11.2.1. Johnson & Johnson
- 11.2.2. Procter & Gamble
- 11.2.3. Bayer
- 11.2.4. GlaxoSmithKline
- 11.2.5. Reckitt Benckiser
- 11.2.6. Pfizer
- 11.2.7. Sanofi
- 11.2.8. Novartis
- 11.2.9. Church & Dwight
- 11.2.10. Perrigo Company
- 11.2.11. GNC Holdings
- 11.2.12. Nature's Bounty Co.
- 11.2.13. Boiron
- 11.2.14. Sundown Naturals
- 11.2.15. Now Foods
12. 360 Degree Analyst View
13. Appendix
- 13.1. Research Methodology
- 13.2. References
- 13.3. Abbreviations
- 13.4. Disclaimer
- 13.5. Contact Us