|
|
市場調査レポート
商品コード
1320104
マイクロオプティクス(DOEとROE)市場:製品タイプ別、用途別、エンドユーザー別、国別、地域別- 産業分析、市場規模、市場シェア、2023-2030年予測Micro-Optics (DOEs and ROEs) Market with COVID-19 Impact Analysis, By Product Type, By Application, By End User, By Country, and By Region - Industry Analysis, Market Size, Market Share & Forecast from 2023-2030 |
||||||
|
|
|||||||
カスタマイズ可能
|
|||||||


| マイクロオプティクス(DOEとROE)市場:製品タイプ別、用途別、エンドユーザー別、国別、地域別- 産業分析、市場規模、市場シェア、2023-2030年予測 |
|
出版日: 2023年07月01日
発行: AnalystView Market Insights
ページ情報: 英文 238 Pages
納期: 2~3営業日
|

- 全表示
- 概要
- 図表
- 目次
レポートハイライト
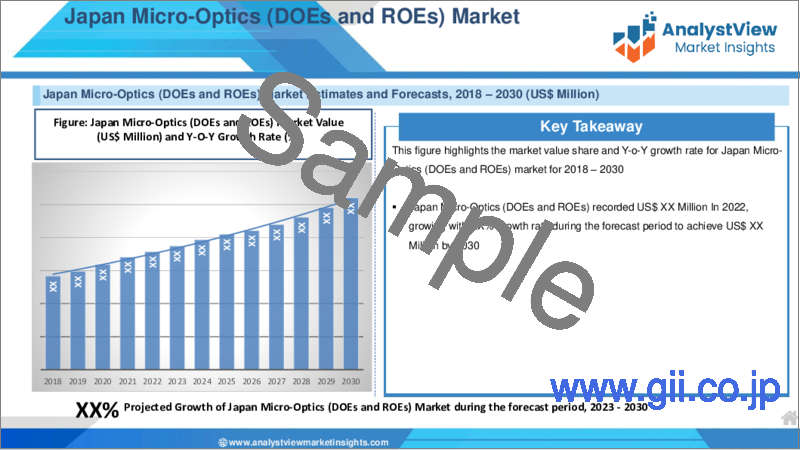
マイクロオプティクス(DOEとROE)市場規模は、2022年に37億890万米ドルと評価され、2023年から2030年までCAGR 6.8%で拡大。
マイクロオプティクス(DOEとROE)への政府支出の増加も、特に新興国市場の屈折光学素子の各地への普及を後押ししていると見られています。コンシューマエレクトロニクスや半導体デバイスのティア1メーカーの強力な市場プレゼンスは、SEAP全体、特に中国で屈折光学素子の販売を促進すると予想されるもう1つの要因です。屈折光学素子は、世界の通信分野で継続的な投資が増加した結果、成長の可能性を見てきました。さらに、半導体およびエレクトロニクス産業による研究開発への多額の投資は、屈折光学素子市場に有望な成長の可能性をもたらしています。
マイクロオプティクス(DOEとROE)市場-主要な洞察:
- 当社のリサーチアナリストが共有した分析によると、世界のマイクロオプティクス(DOEとROE)市場は、予測期間(2023-2030年)に約6.8%のCAGRで毎年成長すると予測されています。
- マイクロオプティクス市場は、通信、コンシューマエレクトロニクス、ヘルスケア、自動車など様々な産業で小型化された光デバイスの需要が増加しているため、大きな成長を遂げています。
- リソグラフィ、エッチング、複製法などの微細加工技術の進歩により、高品質のマイクロオプティクスを低コストで大量生産できるようになっています。
- 地域別では、北米が2022年の売上高をリードしています。
- 中小の屈折光学素子企業に投資するベンチャーキャピタルが多いため、欧州の光学素子産業が世界のマイクロオプティクス市場を独占すると予想されています。このため、これらの企業が成功し、屈折光学素子市場を拡大するのは簡単なことです。屈折光学素子市場を牽引する重要な要因は、この地域の各国政府による研究開発への多額の投資と、この地域の主要なマイクロオプティックメーカーの存在です。同地域の半導体・エレクトロニクス産業における大幅な技術的ブレークスルーのため、中東・アフリカ、その他のAPAC、北米も世界の屈折光学素子市場におけるシェアを大幅に伸ばすと予想されています。
最近の動向
- 2021年6月、Jenoptikはドイツのドレスデンに新しいオフィスコンプレックスを建設し、光学部品製造能力を拡大しました。
- 2020年1月、HOLOEYE Photonics AGは、異なるパターンを持つ10種類の新しい標準回折光学素子を発表しました。
研究の主な特徴
- この調査レポートは、マイクロオプティクス(DOEとROE)市場について、2022年を基準年とした市場規模、年間平均成長率(CAGR %)、推定・予測(2023-2030年)を提供しています。
- この調査レポートは、マイクロオプティクス(DOEとROE)市場に関する最新動向の洞察を顧客に提供します。
- 調査レポートは、さまざまなセグメント/国にわたる潜在的な成長機会を解明し、マイクロオプティクス(DOEとROE)市場の魅力的な投資提案マトリクスを説明します。
- 全体レポートでは、マイクロオプティクス(DOEとROE)市場における新規投資機会、既存企業が直面する課題、持続的成長要因を特定
- マイクロオプティクス(DOEとROE)市場規模、予測、CAGR、市場力学へのCOVID-19の影響は、調査範囲の下で詳細に議論されています。COVID後のマイクロオプティクス(DOEとROE)市場に関する詳細な洞察もカバーします。
- 本レポートのユーザーにマイクロオプティクス(DOEとROE)市場の包括的な見解を提供するために、マイクロオプティクス(DOEとROE)市場の競合情勢と主要イノベーター分析も含めています。
- この調査には、成長見通しマッピング分析が含まれており、すべての業界セグメントを市場規模、成長率、魅力度に基づいてベンチマークしています。
- 主要市場参入企業の詳細な企業プロファイルを掲載しており、マイクロオプティクス(DOEとROE)市場で活動する企業の財務情報や戦略的イニシアチブを理解するのに役立ちます。
- さらに、本レポートは、世界レベルだけでなく地域レベルで市場に関与する主要参入企業の重要な買収&合併、提携&ジョイントベンチャー、新発売、研究開発、地域展開も明らかにしています。
- マイクロオプティクス(DOEとROE)の世界市場レポートは、主にサプライヤー、投資家、新規参入者、流通業者、金融アナリストなど、この業界の様々な利害関係者を対象としています。
目次
第1章 マイクロオプティクス(DOEとROE)市場概要
- 調査範囲
- 市場推定年数
第2章 エグゼクティブサマリー
- 市場内訳
- 競合考察
第3章 マイクロオプティクス(DOEとROE)の主要な市場動向
- マイクロオプティクス(DOEとROE)市場促進要因
- マイクロオプティクス(DOEとROE)市場抑制要因
- マイクロオプティクス(DOEとROE)の市場機会
- マイクロオプティクス(DOEとROE)市場の将来動向
第4章 マイクロオプティクス(DOEとROE)業界の調査
- PEST分析
- ポーターのファイブフォース分析
- 成長見通しのマッピング
- 規制枠組みの分析
第5章 マイクロオプティクス(DOEとROE)市場:COVID-19の影響分析
- 新型コロナウイルス感染症以前の影響分析
- 新型コロナウイルス感染症後の影響分析
第6章 マイクロオプティクス(DOEとROE)市場情勢
- マイクロオプティクス(DOEとROE)市場シェア分析、2022年
- 主要メーカー別の内訳データ
- 確立された企業の分析
- 新興企業の分析
第7章 マイクロオプティクス(DOEとROE)市場-製品タイプ別
- 概要
- 製品タイプ別セグメントシェア分析
- DOE
- ROE
第8章 マイクロオプティクス(DOEとROE)市場- 用途別
- 概要
- 用途別のセグメントシェア分析
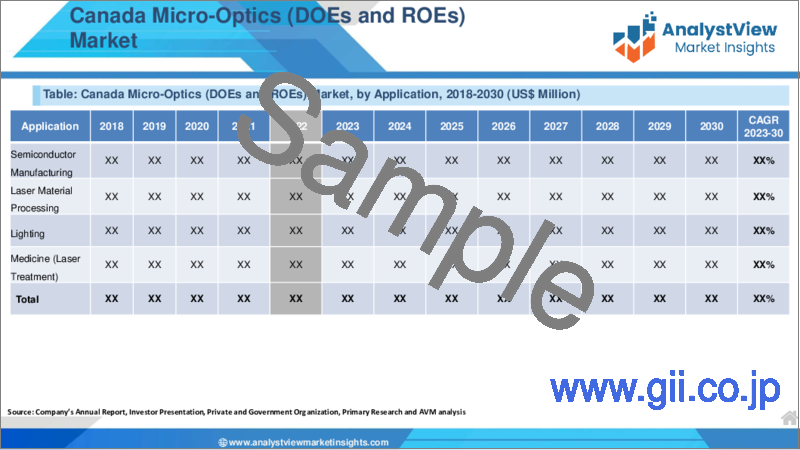
- 半導体製造
- レーザー材料加工
- 点灯
- 医療(レーザー治療)
- ディスプレイとプロジェクター
- 計測学
- LIDAR
- ファイバーおよび導波管カプラー
- その他
第9章 マイクロオプティクス(DOEとROE)市場- エンドユーザー別
- 概要
- エンドユーザー別のセグメントシェア分析
- 半導体
- 通信
- ヘルスケア
- エネルギー
- その他
第10章 マイクロオプティクス(DOEとROE)市場-地域別
- イントロダクション
- 北米
- 概要
- マイクロオプティクス(DOEとROE)北米の主要メーカー
- 米国
- カナダ
- 欧州
- 概要
- マイクロオプティクス(DOEとROE)欧州の主要メーカー
- ドイツ
- イタリア
- 英国
- フランス
- ロシア
- オランダ
- スウェーデン
- ポーランド
- その他
- アジア太平洋(APAC)
- 概要
- マイクロオプティクス(DOEとROE)アジア太平洋地域の主要メーカー
- インド
- 中国
- 日本
- 韓国
- オーストラリア
- タイ
- インドネシア
- フィリピン
- その他
- ラテンアメリカ
- 概要
- マイクロオプティクス(DOEとROE)ラテンアメリカの主要メーカー
- ブラジル
- メキシコ
- アルゼンチン
- コロンビア
- その他
- 中東とアフリカ
- 概要
- マイクロオプティクス(DOEとROE)中東およびアフリカの主要メーカー
- サウジアラビア
- アラブ首長国連邦
- イスラエル
- トルコ
- アルジェリア
- エジプト
- その他
第11章 主要ベンダー分析- マイクロオプティクス(DOEとROE)業界
- 競合ダッシュボード
- 企業プロファイル
- Hamamatsu Photonics
- HOLO/OR Ltd.
- Jenoptik AG
- SUSS MicroOptics SA
- Photop Technologies, Inc.
- LightTrans International UG
- RPC Photonics
- NIL Technology
- Zeiss
- Holographix LLC
第12章 アナリストの全方位展望
List of Tables
- TABLE List of data sources
- TABLE Market drivers; Impact Analysis
- TABLE Market restraints; Impact Analysis
- TABLE Micro-Optics (DOEs and ROEs) Market: Product Type Snapshot (2022)
- TABLE Segment Dashboard; Definition and Scope, by Product Type
- TABLE Global Micro-Optics (DOEs and ROEs) Market, by Product Type 2018-2030 (USD Million)
- TABLE Micro-Optics (DOEs and ROEs) Market: Application Snapshot (2022)
- TABLE Segment Dashboard; Definition and Scope, by Application
- TABLE Global Micro-Optics (DOEs and ROEs) Market, by Application 2018-2030 (USD Million)
- TABLE Micro-Optics (DOEs and ROEs) Market: End User Snapshot (2022)
- TABLE Segment Dashboard; Definition and Scope, by End User
- TABLE Global Micro-Optics (DOEs and ROEs) Market, by End User 2018-2030 (USD Million)
- TABLE Micro-Optics (DOEs and ROEs) Market: Regional snapshot (2022)
- TABLE Segment Dashboard; Definition and Scope, by Region
- TABLE Global Micro-Optics (DOEs and ROEs) Market, by Region 2018-2030 (USD Million)
- TABLE North America Micro-Optics (DOEs and ROEs) Market, by Country, 2018-2030 (USD Million)
- TABLE North America Micro-Optics (DOEs and ROEs) Market, by Product Type, 2018-2030 (USD Million)
- TABLE North America Micro-Optics (DOEs and ROEs) Market, by Application, 2018-2030 (USD Million)
- TABLE North America Micro-Optics (DOEs and ROEs) Market, by End User, 2018-2030 (USD Million)
- TABLE Europe Micro-Optics (DOEs and ROEs) Market, by Country, 2018-2030 (USD Million)
- TABLE Europe Micro-Optics (DOEs and ROEs) Market, by Product Type, 2018-2030 (USD Million)
- TABLE Europe Micro-Optics (DOEs and ROEs) Market, by Application, 2018-2030 (USD Million)
- TABLE Europe Micro-Optics (DOEs and ROEs) Market, by End User, 2018-2030 (USD Million)
- TABLE Asia Pacific Micro-Optics (DOEs and ROEs) Market, by Country, 2018-2030 (USD Million)
- TABLE Asia Pacific Micro-Optics (DOEs and ROEs) Market, by Product Type, 2018-2030 (USD Million)
- TABLE Asia Pacific Micro-Optics (DOEs and ROEs) Market, by Application, 2018-2030 (USD Million)
- TABLE Asia Pacific Micro-Optics (DOEs and ROEs) Market, by End User, 2018-2030 (USD Million)
- TABLE Latin America Micro-Optics (DOEs and ROEs) Market, by Country, 2018-2030 (USD Million)
- TABLE Latin America Micro-Optics (DOEs and ROEs) Market, by Product Type, 2018-2030 (USD Million)
- TABLE Latin America Micro-Optics (DOEs and ROEs) Market, by Application, 2018-2030 (USD Million)
- TABLE Latin America Micro-Optics (DOEs and ROEs) Market, by End User, 2018-2030 (USD Million)
- TABLE Middle East and Africa Micro-Optics (DOEs and ROEs) Market, by Country, 2018-2030 (USD Million)
- TABLE Middle East and Africa Micro-Optics (DOEs and ROEs) Market, by Product Type, 2018-2030 (USD Million)
- TABLE Middle East and Africa Micro-Optics (DOEs and ROEs) Market, by Application, 2018-2030 (USD Million)
- TABLE Middle East and Africa Micro-Optics (DOEs and ROEs) Market, by End User, 2018-2030 (USD Million)
REPORT HIGHLIGHT
Micro-Optics (DOEs and ROEs) Market size was valued at USD 3,708.9 Million in 2022, expanding at a CAGR of 6.8% from 2023 to 2030.
Demand is rising due to expanding use in the medical sector and laser applications for material processing. The global market for refractive optical elements is anticipated to expand as a result of the growing technological developments in laser material processing. The expansion of this regional market may be due to a number of variables, including rising research and development expenditures, rising demand from the medical sector, and expanding aerospace and defence industries. The market for refractive optic elements has expanded due to the increased need for highly precise optical components. The optical component can function as a beam-shaping tool. In comparison to typical lenses or mirrors, using refractive optics enables users to produce high-quality beams at a reduced cost and in small spaces.
Increased government spending on micro-optics R&D is also thought to help refractive optical elements spread throughout different locations, particularly in developing regional markets. Strong market presence of Tier 1 manufacturers of consumer electronics and semiconductor devices is another factor anticipated to drive sales of refractive optical elements throughout SEAP, notably in China.Refractive optical elements have seen growth potential as a result of ongoing and rising investments in the global telecommunications sector, which can be ascribed to the need for the best equipment. In addition, the significant investment on R&D by the semiconductor and electronics industries is generating prospective growth possibilities for the market for refractive optical elements.
Micro-Optics (DOEs and ROEs) Market- Key Insights:
- As per the analysis shared by our research analyst, the global Micro-Optics (DOEs and ROEs) market is estimated to grow annually at a CAGR of around 6.8% over the forecast period (2023-2030)
- The micro-optics market is experiencing significant growth due to the increasing demand for miniaturized optical devices in various industries such as telecommunications, consumer electronics, healthcare, and automotive.
- Technological advancements in microfabrication techniques, such as lithography, etching, and replication methods, have enabled the mass production of high-quality micro-optics at lower costs.
- On the basis of region, North America was the leading revenue generator in 2022
- Because there are many venture capitalists investing in small and medium refractive optical element companies, the optical elements industry in Europe is anticipated to dominate the worldwide micro-optic market. Because of this, it has been simple for these businesses to succeed and broaden the market for refractive optical elements. A significant factor driving the market for refractive optical elements has also been the substantial investment on research and development by the governments of various nations in the region, as well as the presence of major micro-optic producers in the region. Because of significant technical breakthroughs in the semiconductor & electronics industries in the area, SEA & other APAC and North America are also anticipated to significantly increase their market share in the worldwide refractive optical elements market.
Recent Developments:
- In June 2021, Jenoptik expanded its optics manufacturing capacities by building a new office complex at its Dresden, German
- In January 2020, HOLOEYE Photonics AG announced the launch of ten new standard diffractive optical elements with different patterns
Key features of the study:
- This proposed research study on Micro-Optics (DOEs and ROEs) market provides market size (US$ million), compound annual growth rate (CAGR %) and forecast estimation (2023-2030), considering 2022 as the base year
- The report provides the client the latest up-to-date and trending insights about the Micro-Optics (DOEs and ROEs) market.
- The research report elucidates potential growth opportunities across different segments/countries and explains attractive investment proposition matrix for Micro-Optics (DOEs and ROEs) market
- The overall report identifies new investment opportunities, challenges faced by established players, and growth factors to sustain in the Micro-Optics (DOEs and ROEs) market
- Impact of COVID-19 on Micro-Optics (DOEs and ROEs) market size, forecast, CAGR, and market dynamics are discussed in detail under the research scope. Detailed insight on Micro-Optics (DOEs and ROEs) market post-COVID will also be covered.
- In order to give the users of this report a comprehensive view on the Micro-Optics (DOEs and ROEs) market, we have also included competitive landscape and key innovator analysis for the Micro-Optics (DOEs and ROEs) market.
- The study encompasses a growth prospect mapping analysis, wherein all the industry segments are benchmarked based on their market size, growth rate and attractiveness.
- The report offers detailed company profiling featuring major market participants which will help users to understand their financial information and strategic initiatives of players operating in the Micro-Optics (DOEs and ROEs) market.
- In addition, the report also unveil the important acquisitions & mergers, collaborations & joint ventures, new launch, research & development, regional expansion of major participants involved in the market on global as well as regional level.
- The global Micro-Optics (DOEs and ROEs) market report primarily caters to various stakeholders in this industry including suppliers, investors, new entrants, distributors, and financial analysts
SCOPE OF THE REPORT
The scope of this report covers the market by its major segments, which include as follows:
GLOBAL MICRO-OPTICS (DOES AND ROES) MARKET KEY PLAYERS
- Hamamatsu Photonics
- HOLO/OR Ltd.
- Jenoptik AG
- SUSS MicroOptics SA
- Photop Technologies, Inc.
- LightTrans International UG
- RPC Photonics
- NIL Technology
- Zeiss
- Holographix LLC
GLOBAL MICRO-OPTICS (DOES AND ROES) MARKET, BY PRODUCT TYPE
- DOE
- ROE
GLOBAL MICRO-OPTICS (DOES AND ROES) MARKET, BY APPLICATION
- Semiconductor Manufacturing
- Laser Material Processing
- Lighting
- Medicine (Laser Treatment)
- Displays & Projectors
- Metrology
- LIDAR
- Fiber and Waveguide Coupler
- Others
GLOBAL MICRO-OPTICS (DOES AND ROES) MARKET, BY END USER
- Semiconductor
- Telecommunication
- Healthcare
- Energy
- Others
GLOBAL MICRO-OPTICS (DOES AND ROES) MARKET, BY REGION
- North America
- The U.S.
- Canada
- Europe
- Germany
- France
- Italy
- Spain
- United Kingdom
- Russia
- Netherlands
- Sweden
- Poland
- Rest of Europe
- Asia Pacific
- India
- China
- South Korea
- Japan
- Australia
- Thailand
- Indonesia
- Philippines
- Rest of APAC
- Latin America
- Brazil
- Mexico
- Argentina
- Colombia
- Rest of LATAM
- The Middle East and Africa
- Saudi Arabia
- United Arab Emirates
- Israel
- Turkey
- Algeria
- Egypt
- Rest of MEA
Table of Contents
1. Micro-Optics (DOEs and ROEs) Market Overview
- 1.1. Study Scope
- 1.2. Market Estimation Years
2. Executive Summary
- 2.1. Market Snippet
- 2.1.1. Micro-Optics (DOEs and ROEs) Market Snippet by Product Type
- 2.1.2. Micro-Optics (DOEs and ROEs) Market Snippet by Application
- 2.1.3. Micro-Optics (DOEs and ROEs) Market Snippet by End User
- 2.1.4. Micro-Optics (DOEs and ROEs) Market Snippet by Country
- 2.1.5. Micro-Optics (DOEs and ROEs) Market Snippet by Region
- 2.2. Competitive Insights
3. Micro-Optics (DOEs and ROEs) Key Market Trends
- 3.1. Micro-Optics (DOEs and ROEs) Market Drivers
- 3.1.1. Impact Analysis of Market Drivers
- 3.2. Micro-Optics (DOEs and ROEs) Market Restraints
- 3.2.1. Impact Analysis of Market Restraints
- 3.3. Micro-Optics (DOEs and ROEs) Market Opportunities
- 3.4. Micro-Optics (DOEs and ROEs) Market Future Trends
4. Micro-Optics (DOEs and ROEs) Industry Study
- 4.1. PEST Analysis
- 4.2. Porter's Five Forces Analysis
- 4.3. Growth Prospect Mapping
- 4.4. Regulatory Framework Analysis
5. Micro-Optics (DOEs and ROEs) Market: COVID-19 Impact Analysis
- 5.1. Pre-COVID-19 Impact Analysis
- 5.2. Post-COVID-19 Impact Analysis
- 5.2.1. Top Performing Segments
- 5.2.2. Marginal Growth Segments
- 5.2.3. Top Looser Segments
- 5.2.4. Marginal Loss Segments
6. Micro-Optics (DOEs and ROEs) Market Landscape
- 6.1. Micro-Optics (DOEs and ROEs) Market Share Analysis, 2022
- 6.2. Breakdown Data, by Key Manufacturer
- 6.2.1. Established Players' Analysis
- 6.2.2. Emerging Players' Analysis
7. Micro-Optics (DOEs and ROEs) Market - By Product Type
- 7.1. Overview
- 7.1.1. Segment Share Analysis, By Product Type, 2022 & 2030 (%)
- 7.1.2. DOE
- 7.1.3. ROE
8. Micro-Optics (DOEs and ROEs) Market - By Application
- 8.1. Overview
- 8.1.1. Segment Share Analysis, By Application, 2022 & 2030 (%)
- 8.1.2. Semiconductor Manufacturing
- 8.1.3. Laser Material Processing
- 8.1.4. Lighting
- 8.1.5. Medicine (Laser Treatment)
- 8.1.6. Displays & Projectors
- 8.1.7. Metrology
- 8.1.8. LIDAR
- 8.1.9. Fiber and Waveguide Coupler
- 8.1.10. Others
9. Micro-Optics (DOEs and ROEs) Market - By End User
- 9.1. Overview
- 9.1.1. Segment Share Analysis, By End User, 2022 & 2030 (%)
- 9.1.2. Semiconductor
- 9.1.3. Telecommunication
- 9.1.4. Healthcare
- 9.1.5. Energy
- 9.1.6. Others
10. Micro-Optics (DOEs and ROEs) Market- By Geography
- 10.1. Introduction
- 10.1.1. Segment Share Analysis, By Geography, 2022 & 2030 (%)
- 10.2. North America
- 10.2.1. Overview
- 10.2.2. Micro-Optics (DOEs and ROEs) Key Manufacturers in North America
- 10.2.3. North America Market Size and Forecast, By Country, 2018 - 2030 (US$ Million)
- 10.2.4. North America Market Size and Forecast, By Product Type, 2018 - 2030 (US$ Million)
- 10.2.5. North America Market Size and Forecast, By Application, 2018 - 2030 (US$ Million)
- 10.2.6. North America Market Size and Forecast, By End User, 2018 - 2030 (US$ Million)
- 10.2.7. U.S.
- 10.2.7.1. Overview
- 10.2.7.2. Market Analysis, Forecast, and Y-O-Y Growth Rate, 2018 - 2030, (US$ Million)
- 10.2.7.3. U.S. Market Size and Forecast, By Product Type, 2018 - 2030 (US$ Million)
- 10.2.7.4. U.S. Market Size and Forecast, By Application, 2018 - 2030 (US$ Million)
- 10.2.7.5. U.S. Market Size and Forecast, By End User, 2018 - 2030 (US$ Million)
- 10.2.8. Canada
- 10.2.8.1. Overview
- 10.2.8.2. Market Analysis, Forecast, and Y-O-Y Growth Rate, 2018 - 2030, (US$ Million)
- 10.2.8.3. Canada Market Size and Forecast, By Product Type, 2018 - 2030 (US$ Million)
- 10.2.8.4. Canada Market Size and Forecast, By Application, 2018 - 2030 (US$ Million)
- 10.2.8.5. Canada Market Size and Forecast, By End User, 2018 - 2030 (US$ Million)
- 10.3. Europe
- 10.3.1. Overview
- 10.3.2. Micro-Optics (DOEs and ROEs) Key Manufacturers in Europe
- 10.3.3. Europe Market Size and Forecast, By Country, 2018 - 2030 (US$ Million)
- 10.3.4. Europe Market Size and Forecast, By Product Type, 2018 - 2030 (US$ Million)
- 10.3.5. Europe Market Size and Forecast, By Application, 2018 - 2030 (US$ Million)
- 10.3.6. Europe Market Size and Forecast, By End User, 2018 - 2030 (US$ Million)
- 10.3.7. Germany
- 10.3.7.1. Overview
- 10.3.7.2. Market Analysis, Forecast, and Y-O-Y Growth Rate, 2018 - 2030, (US$ Million)
- 10.3.7.3. Germany Market Size and Forecast, By Product Type, 2018 - 2030 (US$ Million)
- 10.3.7.4. Germany Market Size and Forecast, By Application, 2018 - 2030 (US$ Million)
- 10.3.7.5. Germany Market Size and Forecast, By End User, 2018 - 2030 (US$ Million)
- 10.3.8. Italy
- 10.3.8.1. Overview
- 10.3.8.2. Market Analysis, Forecast, and Y-O-Y Growth Rate, 2018 - 2030, (US$ Million)
- 10.3.8.3. Italy Market Size and Forecast, By Product Type, 2018 - 2030 (US$ Million)
- 10.3.8.4. Italy Market Size and Forecast, By Application, 2018 - 2030 (US$ Million)
- 10.3.8.5. Italy Market Size and Forecast, By End User, 2018 - 2030 (US$ Million)
- 10.3.9. United Kingdom
- 10.3.9.1. Overview
- 10.3.9.2. Market Analysis, Forecast, and Y-O-Y Growth Rate, 2018 - 2030, (US$ Million)
- 10.3.9.3. United Kingdom Market Size and Forecast, By Product Type, 2018 - 2030 (US$ Million)
- 10.3.9.4. United Kingdom Market Size and Forecast, By Application, 2018 - 2030 (US$ Million)
- 10.3.9.5. United Kingdom Market Size and Forecast, By End User, 2018 - 2030 (US$ Million)
- 10.3.10. France
- 10.3.10.1. Overview
- 10.3.10.2. Market Analysis, Forecast, and Y-O-Y Growth Rate, 2018 - 2030, (US$ Million)
- 10.3.10.3. France Market Size and Forecast, By Product Type, 2018 - 2030 (US$ Million)
- 10.3.10.4. France Market Size and Forecast, By Application, 2018 - 2030 (US$ Million)
- 10.3.10.5. France Market Size and Forecast, By End User, 2018 - 2030 (US$ Million)
- 10.3.11. Russia
- 10.3.11.1. Market Analysis, Forecast, and Y-O-Y Growth Rate, 2018 - 2030, (US$ Million)
- 10.3.11.2. Russia Market Size and Forecast, By Product Type, 2018 - 2030 (US$ Million)
- 10.3.11.3. Russia Market Size and Forecast, By Application, 2018 - 2030 (US$ Million)
- 10.3.11.4. Russia Market Size and Forecast, By End User, 2018 - 2030 (US$ Million)
- 10.3.12. Netherlands
- 10.3.12.1. Market Analysis, Forecast, and Y-O-Y Growth Rate, 2018 - 2030, (US$ Million)
- 10.3.12.2. Netherlands Market Size and Forecast, By Product Type, 2018 - 2030 (US$ Million)
- 10.3.12.3. Netherlands Market Size and Forecast, By Application, 2018 - 2030 (US$ Million)
- 10.3.12.4. Netherlands Market Size and Forecast, By End User, 2018 - 2030 (US$ Million)
- 10.3.13. Sweden
- 10.3.13.1. Market Analysis, Forecast, and Y-O-Y Growth Rate, 2018 - 2030, (US$ Million)
- 10.3.13.2. Sweden Market Size and Forecast, By Product Type, 2018 - 2030 (US$ Million)
- 10.3.13.3. Sweden Market Size and Forecast, By Application, 2018 - 2030 (US$ Million)
- 10.3.13.4. Sweden Market Size and Forecast, By End User, 2018 - 2030 (US$ Million)
- 10.3.14. Poland
- 10.3.14.1. Market Analysis, Forecast, and Y-O-Y Growth Rate, 2018 - 2030, (US$ Million)
- 10.3.14.2. Poland Market Size and Forecast, By Product Type, 2018 - 2030 (US$ Million)
- 10.3.14.3. Poland Market Size and Forecast, By Application, 2018 - 2030 (US$ Million)
- 10.3.14.4. Poland Market Size and Forecast, By End User, 2018 - 2030 (US$ Million)
- 10.3.15. Rest of Europe
- 10.3.15.1. Overview
- 10.3.15.2. Market Analysis, Forecast, and Y-O-Y Growth Rate, 2018 - 2030, (US$ Million)
- 10.3.15.3. Rest of the Europe Market Size and Forecast, By Product Type, 2018 - 2030 (US$ Million)
- 10.3.15.4. Rest of the Europe Market Size and Forecast, By Application, 2018 - 2030 (US$ Million)
- 10.3.15.5. Rest of the Europe Market Size and Forecast, By End User, 2018 - 2030 (US$ Million)
- 10.4. Asia Pacific (APAC)
- 10.4.1. Overview
- 10.4.2. Micro-Optics (DOEs and ROEs) Key Manufacturers in Asia Pacific
- 10.4.3. Asia Pacific Market Size and Forecast, By Country, 2018 - 2030 (US$ Million)
- 10.4.4. Asia Pacific Market Size and Forecast, By Product Type, 2018 - 2030 (US$ Million)
- 10.4.5. Asia Pacific Market Size and Forecast, By Application, 2018 - 2030 (US$ Million)
- 10.4.6. Asia Pacific Market Size and Forecast, By End User, 2018 - 2030 (US$ Million)
- 10.4.7. India
- 10.4.7.1. Overview
- 10.4.7.2. Market Analysis, Forecast, and Y-O-Y Growth Rate, 2018 - 2030, (US$ Million)
- 10.4.7.3. India Market Size and Forecast, By Product Type, 2018 - 2030 (US$ Million)
- 10.4.7.4. India Market Size and Forecast, By Application, 2018 - 2030 (US$ Million)
- 10.4.7.5. India Market Size and Forecast, By End User, 2018 - 2030 (US$ Million)
- 10.4.8. China
- 10.4.8.1. Overview
- 10.4.8.2. Market Analysis, Forecast, and Y-O-Y Growth Rate, 2018 - 2030, (US$ Million)
- 10.4.8.3. China Market Size and Forecast, By Product Type, 2018 - 2030 (US$ Million)
- 10.4.8.4. China Market Size and Forecast, By Application, 2018 - 2030 (US$ Million)
- 10.4.8.5. China Market Size and Forecast, By End User, 2018 - 2030 (US$ Million)
- 10.4.9. Japan
- 10.4.9.1. Overview
- 10.4.9.2. Market Analysis, Forecast, and Y-O-Y Growth Rate, 2018 - 2030, (US$ Million)
- 10.4.9.3. Japan Market Size and Forecast, By Product Type, 2018 - 2030 (US$ Million)
- 10.4.9.4. Japan Market Size and Forecast, By Application, 2018 - 2030 (US$ Million)
- 10.4.9.5. Japan Market Size and Forecast, By End User, 2018 - 2030 (US$ Million)
- 10.4.10. South Korea
- 10.4.10.1. Overview
- 10.4.10.2. Market Analysis, Forecast, and Y-O-Y Growth Rate, 2018 - 2030, (US$ Million)
- 10.4.10.3. South Korea Market Size and Forecast, By Product Type, 2018 - 2030 (US$ Million)
- 10.4.10.4. South Korea Market Size and Forecast, By Application, 2018 - 2030 (US$ Million)
- 10.4.10.5. South Korea Market Size and Forecast, By End User, 2018 - 2030 (US$ Million)
- 10.4.11. Australia
- 10.4.11.1. Overview
- 10.4.11.2. Market Analysis, Forecast, and Y-O-Y Growth Rate, 2018 - 2030, (US$ Million)
- 10.4.11.3. Australia Market Size and Forecast, By Product Type, 2018 - 2030 (US$ Million)
- 10.4.11.4. Australia Market Size and Forecast, By Application, 2018 - 2030 (US$ Million)
- 10.4.11.5. Australia Market Size and Forecast, By End User, 2018 - 2030 (US$ Million)
- 10.4.12. Thailand
- 10.4.12.1. Overview
- 10.4.12.2. Market Analysis, Forecast, and Y-O-Y Growth Rate, 2018 - 2030, (US$ Million)
- 10.4.12.3. Thailand Market Size and Forecast, By Product Type, 2018 - 2030 (US$ Million)
- 10.4.12.4. Thailand Market Size and Forecast, By Application, 2018 - 2030 (US$ Million)
- 10.4.12.5. Thailand Market Size and Forecast, By End User, 2018 - 2030 (US$ Million)
- 10.4.13. Indonesia
- 10.4.13.1. Overview
- 10.4.13.2. Market Analysis, Forecast, and Y-O-Y Growth Rate, 2018 - 2030, (US$ Million)
- 10.4.13.3. Indonesia Market Size and Forecast, By Product Type, 2018 - 2030 (US$ Million)
- 10.4.13.4. Indonesia Market Size and Forecast, By Application, 2018 - 2030 (US$ Million)
- 10.4.13.5. Indonesia Market Size and Forecast, By End User, 2018 - 2030 (US$ Million)
- 10.4.14. Philippines
- 10.4.14.1. Overview
- 10.4.14.2. Market Analysis, Forecast, and Y-O-Y Growth Rate, 2018 - 2030, (US$ Million)
- 10.4.14.3. Philippines Market Size and Forecast, By Product Type, 2018 - 2030 (US$ Million)
- 10.4.14.4. Philippines Market Size and Forecast, By Application, 2018 - 2030 (US$ Million)
- 10.4.14.5. Philippines Market Size and Forecast, By End User, 2018 - 2030 (US$ Million)
- 10.4.15. Rest of APAC
- 10.4.15.1. Overview
- 10.4.15.2. Market Analysis, Forecast, and Y-O-Y Growth Rate, 2018 - 2030, (US$ Million)
- 10.4.15.3. Rest of APAC Market Size and Forecast, By Product Type, 2018 - 2030 (US$ Million)
- 10.4.15.4. Rest of APAC Market Size and Forecast, By Application, 2018 - 2030 (US$ Million)
- 10.4.15.5. Rest of APAC Market Size and Forecast, By End User, 2018 - 2030 (US$ Million)
- 10.5. Latin America
- 10.5.1. Overview
- 10.5.2. Micro-Optics (DOEs and ROEs) Key Manufacturers in Latin America
- 10.5.3. Latin America Market Size and Forecast, By Country, 2018 - 2030 (US$ Million)
- 10.5.4. Latin America Market Size and Forecast, By Product Type, 2018 - 2030 (US$ Million)
- 10.5.5. Latin America Market Size and Forecast, By Application, 2018 - 2030 (US$ Million)
- 10.5.6. Latin America Market Size and Forecast, By End User, 2018 - 2030 (US$ Million)
- 10.5.7. Brazil
- 10.5.7.1. Overview
- 10.5.7.2. Market Analysis, Forecast, and Y-O-Y Growth Rate, 2018 - 2030, (US$ Million)
- 10.5.7.3. Brazil Market Size and Forecast, By Product Type, 2018 - 2030 (US$ Million)
- 10.5.7.4. Brazil Market Size and Forecast, By Application, 2018 - 2030 (US$ Million)
- 10.5.7.5. Brazil Market Size and Forecast, By End User, 2018 - 2030 (US$ Million)
- 10.5.8. Mexico
- 10.5.8.1. Overview
- 10.5.8.2. Market Analysis, Forecast, and Y-O-Y Growth Rate, 2018 - 2030, (US$ Million)
- 10.5.8.3. Mexico Market Size and Forecast, By Product Type, 2018 - 2030 (US$ Million)
- 10.5.8.4. Mexico Market Size and Forecast, By Application, 2018 - 2030 (US$ Million)
- 10.5.8.5. Mexico Market Size and Forecast, By End User, 2018 - 2030 (US$ Million)
- 10.5.9. Argentina
- 10.5.9.1. Overview
- 10.5.9.2. Market Analysis, Forecast, and Y-O-Y Growth Rate, 2018 - 2030, (US$ Million)
- 10.5.9.3. Argentina Market Size and Forecast, By Product Type, 2018 - 2030 (US$ Million)
- 10.5.9.4. Argentina Market Size and Forecast, By Application, 2018 - 2030 (US$ Million)
- 10.5.9.5. Argentina Market Size and Forecast, By End User, 2018 - 2030 (US$ Million)
- 10.5.10. Colombia
- 10.5.10.1. Overview
- 10.5.10.2. Market Analysis, Forecast, and Y-O-Y Growth Rate, 2018 - 2030, (US$ Million)
- 10.5.10.3. Colombia Market Size and Forecast, By Product Type, 2018 - 2030 (US$ Million)
- 10.5.10.4. Colombia Market Size and Forecast, By Application, 2018 - 2030 (US$ Million)
- 10.5.10.5. Colombia Market Size and Forecast, By End User, 2018 - 2030 (US$ Million)
- 10.5.11. Rest of LATAM
- 10.5.11.1. Overview
- 10.5.11.2. Market Analysis, Forecast, and Y-O-Y Growth Rate, 2018 - 2030, (US$ Million)
- 10.5.11.3. Rest of LATAM Market Size and Forecast, By Product Type, 2018 - 2030 (US$ Million)
- 10.5.11.4. Rest of LATAM Market Size and Forecast, By Application, 2018 - 2030 (US$ Million)
- 10.5.11.5. Rest of LATAM Market Size and Forecast, By End User, 2018 - 2030 (US$ Million)
- 10.6. Middle East and Africa
- 10.6.1. Overview
- 10.6.2. Micro-Optics (DOEs and ROEs) Key Manufacturers in Middle East and Africa
- 10.6.3. Middle East and Africa Market Size and Forecast, By Country, 2018 - 2030 (US$ Million)
- 10.6.4. Middle East and Africa Market Size and Forecast, By Product Type, 2018 - 2030 (US$ Million)
- 10.6.5. Middle East and Africa Market Size and Forecast, By Application, 2018 - 2030 (US$ Million)
- 10.6.6. Middle East and Africa Market Size and Forecast, By End User, 2018 - 2030 (US$ Million)
- 10.6.7. Saudi Arabia
- 10.6.7.1. Overview
- 10.6.7.2. Market Analysis, Forecast, and Y-O-Y Growth Rate, 2018 - 2030, (US$ Million)
- 10.6.7.3. Saudi Arabia Market Size and Forecast, By Product Type, 2018 - 2030 (US$ Million)
- 10.6.7.4. Saudi Arabia Market Size and Forecast, By Application, 2018 - 2030 (US$ Million)
- 10.6.7.5. Saudi Arabia Market Size and Forecast, By End User, 2018 - 2030 (US$ Million)
- 10.6.8. United Arab Emirates
- 10.6.8.1. Overview
- 10.6.8.2. Market Analysis, Forecast, and Y-O-Y Growth Rate, 2018 - 2030, (US$ Million)
- 10.6.8.3. United Arab Emirates Market Size and Forecast, By Product Type, 2018 - 2030 (US$ Million)
- 10.6.8.4. United Arab Emirates Market Size and Forecast, By Application, 2018 - 2030 (US$ Million)
- 10.6.8.5. United Arab Emirates Market Size and Forecast, By End User, 2018 - 2030 (US$ Million)
- 10.6.9. Israel
- 10.6.9.1. Overview
- 10.6.9.2. Market Analysis, Forecast, and Y-O-Y Growth Rate, 2018 - 2030, (US$ Million)
- 10.6.9.3. Israel Market Size and Forecast, By Product Type, 2018 - 2030 (US$ Million)
- 10.6.9.4. Israel Market Size and Forecast, By Application, 2018 - 2030 (US$ Million)
- 10.6.9.5. Israel Market Size and Forecast, By End User, 2018 - 2030 (US$ Million)
- 10.6.10. Turkey
- 10.6.10.1. Overview
- 10.6.10.2. Market Analysis, Forecast, and Y-O-Y Growth Rate, 2018 - 2030, (US$ Million)
- 10.6.10.3. Turkey Market Size and Forecast, By Product Type, 2018 - 2030 (US$ Million)
- 10.6.10.4. Turkey Market Size and Forecast, By Application, 2018 - 2030 (US$ Million)
- 10.6.10.5. Turkey Market Size and Forecast, By End User, 2018 - 2030 (US$ Million)
- 10.6.11. Algeria
- 10.6.11.1. Overview
- 10.6.11.2. Market Analysis, Forecast, and Y-O-Y Growth Rate, 2018 - 2030, (US$ Million)
- 10.6.11.3. Algeria Market Size and Forecast, By Product Type, 2018 - 2030 (US$ Million)
- 10.6.11.4. Algeria Market Size and Forecast, By Application, 2018 - 2030 (US$ Million)
- 10.6.11.5. Algeria Market Size and Forecast, By End User, 2018 - 2030 (US$ Million)
- 10.6.12. Egypt
- 10.6.12.1. Overview
- 10.6.12.2. Market Analysis, Forecast, and Y-O-Y Growth Rate, 2018 - 2030, (US$ Million)
- 10.6.12.3. Egypt Market Size and Forecast, By Product Type, 2018 - 2030 (US$ Million)
- 10.6.12.4. Egypt Market Size and Forecast, By Application, 2018 - 2030 (US$ Million)
- 10.6.12.5. Egypt Market Size and Forecast, By End User, 2018 - 2030 (US$ Million)
- 10.6.13. Rest of MEA
- 10.6.13.1. Overview
- 10.6.13.2. Market Analysis, Forecast, and Y-O-Y Growth Rate, 2018 - 2030, (US$ Million)
- 10.6.13.3. Rest of MEA Market Size and Forecast, By Product Type, 2018 - 2030 (US$ Million)
- 10.6.13.4. Rest of MEA Market Size and Forecast, By Application, 2018 - 2030 (US$ Million)
- 10.6.13.5. Rest of MEA Market Size and Forecast, By End User, 2018 - 2030 (US$ Million)
11. Key Vendor Analysis- Micro-Optics (DOEs and ROEs) Industry
- 11.1. Competitive Dashboard
- 11.2. Company Profiles
- 11.2.1. Hamamatsu Photonics
- 11.2.2. HOLO/OR Ltd.
- 11.2.3. Jenoptik AG
- 11.2.4. SUSS MicroOptics SA
- 11.2.5. Photop Technologies, Inc.
- 11.2.6. LightTrans International UG
- 11.2.7. RPC Photonics
- 11.2.8. NIL Technology
- 11.2.9. Zeiss
- 11.2.10. Holographix LLC
12. 360 Degree Analyst View
13. Appendix
- 13.1. Research Methodology
- 13.2. References
- 13.3. Abbreviations
- 13.4. Disclaimer
- 13.5. Contact Us