
|
市場調査レポート
商品コード
1645718
マネーロンダリング防止ソフトウェアの世界市場:コンポーネント別、製品タイプ別、展開別、組織規模別、エンドユーザー別 - 市場機会分析および産業予測、2024年~2033年Anti-Money Laundering Software Market By Component, By Product Type, By Deployment, By Organization Size, By End-User : Global Opportunity Analysis and Industry Forecast, 2024-2033 |
||||||
|
|||||||

| マネーロンダリング防止ソフトウェアの世界市場:コンポーネント別、製品タイプ別、展開別、組織規模別、エンドユーザー別 - 市場機会分析および産業予測、2024年~2033年 |
|
出版日: 2024年12月01日
発行: Allied Market Research
ページ情報: 英文 370 Pages
納期: 2~3営業日
|

- 全表示
- 概要
- 目次
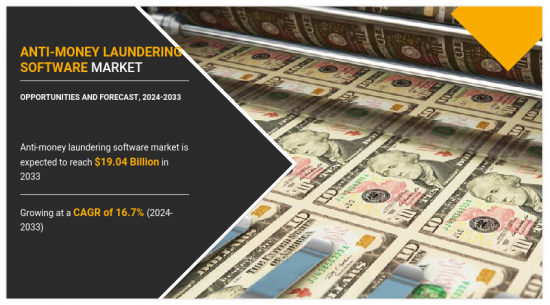
マネーロンダリング防止ソフトウェア市場は、2023年には40億米ドルと評価され、2024年から2033年までのCAGRは16.7%を示し、2033年には190億米ドルに達すると推定されています。
マネーロンダリング防止ソフトウェアは、金融機関や組織がマネーロンダリングに関与する可能性のある疑わしい活動を検出、防止、報告できるように設計された専門技術です。これらのツールは、コンプライアンスプロセスを自動化し、取引に異常がないかを監視し、金融犯罪対策を目的とした規制要件の遵守を保証します。高度なアルゴリズム、機械学習、データ分析を活用することで、マネーロンダリング防止ソフトウェアは不正行為の検出を合理化し、人的ミスを減らし、業務効率を高めます。
世界のマネーロンダリング防止ソフトウェア市場は、マネーロンダリング、サイバー犯罪、テロ資金供与などの金融犯罪の憂慮すべき増加や、マネーロンダリング防止ソフトウェアを採用するための厳しい政府規制の実施などの要因により、堅調な成長を遂げています。例えば、欧州連合の第5次マネーロンダリング防止指令(5AMLD)は、マネーロンダリング防止ソリューションの需要を増加させました。デロイトの2024年の調査によると、世界では毎年約8,000億米ドルから2兆ドルの資金洗浄が行われています。このうち、犯罪収益が回収されるのはわずか1%に過ぎず、マネーロンダリング防止ソフトウェアの緊急の必要性が浮き彫りになっています。さらに、銀行や金融サービスがデジタルプラットフォームに移行するにつれて、リアルタイムのモニタリングとコンプライアンスの必要性が急増しており、強固なマネーロンダリング防止ソフトウェアの需要が高まっています。さらに、金融活動の世界化により、マネーロンダリングリスクの影響を受けやすい国境を越えた取引が増加しています。マネーロンダリング防止ソフトウェアは、国際的な規制への準拠を保証し、そのような活動を効果的に監視するため、このことがマネーロンダリング防止ソフトウェアに対する需要を大幅に増大させています。さらに、暗号通貨の人気の高まりは、不正な資金の流れを追跡する上での新たな課題を導入し、ブロックチェーン取引を分析できるマネーロンダリング防止ソリューションの採用増加につながっています。しかし、マネーロンダリング防止ソフトウェアの取得と導入に伴う高コストと、継続的なメンテナンスとアップデートは、市場の成長を著しく阻害しています。さらに、マネーロンダリング防止ソフトウェアを効果的に導入するための訓練を受けた専門家が世界的に不足していることも、世界市場の主要な阻害要因となっています。それとは逆に、メーカーはマネーロンダリング防止ソフトウェアにAIやML技術を統合し、疑わしいパターンの検出、リスクの予測、誤検知の低減能力を強化することに注力しており、これらのソリューションをより効果的なものにしています。こうした進展は、予測期間中の世界市場拡大に有利な機会を提供すると期待されています。
マネーロンダリング防止(AML)市場は、テクノロジーの進歩、規制要件の増加、金融犯罪の複雑化などを背景に、急速に進化しています。最近の動向の1つは、取引監視とリスク評価の強化のための人工知能(AI)と機械学習(ML)の採用で、疑わしい活動をリアルタイムでより正確に検知できるようになっています。さらに、コンプライアンスプロセスを合理化し、誤検知を減らし、効率を向上させるために、自動化が重視されるようになってきています。また、金融取引の透明性と安全性を向上させるブロックチェーン技術の導入も進んでいます。規制当局は、新たな脅威に対処するためにガイドラインを継続的に更新しており、堅牢なAMLソリューションへの投資拡大につながっています。さらに、デジタルバンキングや国境を越えた取引の拡大により、世界で複数法域にまたがる業務を管理できる、より高度なAMLシステムが必要とされています。
マネーロンダリング防止ソフトウェア市場は、コンポーネント、製品タイプ、展開、組織規模、エンドユーザー、地域に区分されます。コンポーネント別では、市場はソフトウェアとサービスに二分されます。製品タイプ別では、取引モニタリング、KYYC/CDD&サンクションスクリーニング、キャッシュマネジメント&レポーティングに分けられます。展開によって、クラウド型とオンプレミス型に分類されます。組織規模別では、大企業と中小企業に分類されます。エンドユーザー別では、銀行・金融機関、保険、賭博・ギャンブルに分類されます。地域別では、北米、欧州、アジア太平洋、ラテンアメリカ・中東・アフリカで分析されます。
主な調査結果
コンポーネント別では、ソフトウェアセグメントが2024年から2033年にかけて市場を独占すると予測されます。
製品タイプ別では、トランザクションモニタリング分野が予測期間中に最も高い成長を示すと予測されています。
展開タイプ別では、世界のマネーロンダリング防止ソフトウェア市場は、2023年にはオンプレミスセグメントが支配的であり、今後数年間もその優位性を維持すると予測されます。
組織規模別では、大企業セグメントが今後数年間で支配的な勢力として台頭する可能性が高いです。
エンドユーザー別では、銀行・金融機関セグメントが予測期間を通じて顕著なペースで成長すると予測されています。
地域別では、北米が2023年のマネーロンダリング防止ソフトウェア市場を牽引しています。
競合分析
利害関係者にとっての主なメリット
この調査レポートは、市場予測に関する詳細な分析を、現在および将来の動向とともに提供し、差し迫った投資ポケットを説明します。
主要促進要因、抑制要因、市場機会、およびそれらが市場動向に与える影響分析に関する情報を掲載しています。
ポーターのファイブフォース分析では、業界で活動するバイヤーとサプライヤーの潜在力を示しています。
2023年から2032年までの市場の定量分析は、市場の可能性を決定するために提供されます。
本レポートで可能なカスタマイズ(追加費用とスケジュールが必要です。)
- エンドユーザーの嗜好とペインポイント
- 地域別の産業ライフサイクル評価
- 投資機会
- 製品ベンチマーク/製品仕様と用途
- 製品ライフサイクル
- シナリオ分析と成長動向比較
- 技術動向分析
- 企業の市場シェア分析:製品/セグメント別
- 新製品開発/主要企業の製品マトリックス
- ペインポイント分析
- 規制ガイドライン
- 戦略的提言
- クライアントの関心に特化した追加企業プロファイル
- 国別または地域別追加分析 - 市場規模と予測
- ブランドシェア分析
- クリスクロスセグメント分析 - 市場規模と予測
- 企業プロファイルの拡張リスト
- 過去の市場データ
- 世界/地域/国別の企業シェア分析
- SWOT分析
目次
第1章 イントロダクション
第2章 エグゼクティブサマリー
第3章 市場概要
- 市場の定義と範囲
- 主な調査結果
- 影響要因
- 主な投資機会
- ポーターのファイブフォース分析
- 市場力学
- 促進要因
- 銀行取引におけるオンライン決済の増加
- マネーロンダリング防止のための厳格な規制とコンプライアンスの増加
- インターネットソリューションの普及
- 抑制要因
- 消費者の知識・認識不足
- 初期費用と経費の高さ
- 機会
- 分析ソリューションの採用拡大
- 先端技術の統合の急増
- 促進要因
第4章 マネーロンダリング防止ソフトウェア市場:コンポーネント別
- 概要
- ソフトウェア
- サービス
第5章 マネーロンダリング防止ソフトウェア市場:製品タイプ別
- 概要
- KYC/CDDおよびサンクションスクリーニング
- 取引モニタリング
- ケース管理とレポーティング
第6章 マネーロンダリング防止ソフトウェア市場:展開別
- 概要
- オンプレミス
- クラウド
第7章 マネーロンダリング防止ソフトウェア市場:組織規模別
- 概要
- 大企業
- 中小企業
第8章 マネーロンダリング防止ソフトウェア市場:エンドユーザー別
- 概要
- 銀行・金融機関
- 保険
- 賭博・ギャンブル
第9章 マネーロンダリング防止ソフトウェア市場:地域別
- 概要
- 北米
- 米国
- カナダ
- 欧州
- 英国
- ドイツ
- フランス
- イタリア
- スペイン
- その他
- アジア太平洋
- 中国
- 日本
- インド
- オーストラリア
- 韓国
- その他
- ラテンアメリカ
- ラテンアメリカ
- 中東
- アフリカ
第10章 競合情勢
- イントロダクション
- 主要成功戦略
- 主要10社の製品マッピング
- 競合ダッシュボード
- 競合ヒートマップ
- 主要企業のポジショニング(2023年)
第11章 企業プロファイル
- ACI Worldwide, Inc.
- NICE Actimize
- Verafin Solutions ULC
- HyperVerge Technologies Private Limited
- IMTF
- LexisNexis Risk Solutions
- Thomson Reuters Corporation
- Moody's Corporation
- SAS Institute Inc.
- Eastnets Holding Ltd.
The anti-money laundering software market was valued at $4 billion in 2023 and is estimated to reach $19 billion by 2033, exhibiting a CAGR of 16.7% from 2024 to 2033. Anti-money laundering software is a specialized technology designed to help financial institutions and organizations detect, prevent, and report suspicious activities that may involve money laundering. These tools automate compliance processes, monitor transactions for anomalies, and ensure adherence to regulatory requirements aimed at combating financial crimes. By leveraging advanced algorithms, machine learning, and data analytics, anti-money laundering software streamlines the detection of irregularities, reduces human error, and enhances operational efficiency.
The global anti-money laundering software market is witnessing robust growth due to factors such as alarming rise in financial crimes like money laundering, cyber-enabled crimes, and terrorist financing as well as implementation of stringent government regulations to adopt anti-money laundering software. For instance, the European Union's Fifth Anti-Money Laundering Directive (5AMLD) increased the demand for anti-money laundering solutions. As per a 2024 study by Deloitte, approximately $800 billion-$2 trillion is still laundered globally every year. Of this, merely 1% of the proceeds of crime are recovered, thus highlighting the urgent need for anti-money laundering software. Moreover, as banks and financial services shift towards digital platforms, the need for real-time monitoring and compliance has surged, driving the demand for robust anti-money laundering software. Furthermore, globalization of financial activities has led to rise in cross-border transactions, which are more susceptible to money laundering risks. This has significantly augmented the demand for anti-money laundering software, as it ensures compliance with international regulations and monitors such activities effectively. In addition, rise in popularity of cryptocurrencies has introduced new challenges in tracking illicit financial flows, leading to increased adoption of anti-money laundering solutions capable of analyzing blockchain transactions. However, high cost associated with acquiring and implementing anti-money laundering software, along with ongoing maintenance and updates, significantly hampers the market growth. Moreover, global shortage of trained professionals to effective deploy anti-money laundering software acts as a key deterrent factor of the global market. On the contrary, manufacturers are focusing on integrating AI and ML technologies in anti-money laundering software to enhance the ability to detect suspicious patterns, predict risks, and reduce false positives, making these solutions more effective. Such developments are expected to offer lucrative opportunities for the expansion of the global market during the forecast period.
The Anti-Money Laundering (AML) market has been evolving rapidly, driven by advancements in technology, increasing regulatory requirements, and the growing complexity of financial crime. One of the recent trends is the adoption of artificial intelligence (AI) and machine learning (ML) for enhanced transaction monitoring and risk assessment, allowing for more accurate detection of suspicious activities in real-time. Additionally, there is a rising emphasis on automation to streamline compliance processes, reduce false positives, and improve efficiency. The integration of blockchain technology is also gaining traction, offering greater transparency and security in financial transactions. Regulatory authorities are continuously updating guidelines to address emerging threats, leading to higher investments in robust AML solutions. Furthermore, the expansion of digital banking and cross-border transactions has necessitated more sophisticated AML systems capable of managing global, multi-jurisdictional operations.
The anti-money laundering software market is segmented into component, product type, deployment, organization size, end user, and region. On the basis of component, the market is bifurcated into software and services. By product type, it is divided into transaction monitoring, KYYC/CDD & sanction screening, and cash management & reporting. Depending on deployment, it is categorized into cloud and on-premise. As per organization size, it is classified into large enterprises and small & medium-sized enterprises. By end user, it is segregated into banks & financial institutes, insurance, and gaming & gambling. Region wise, the market is analyzed across North America, Europe, Asia-Pacific, and LAMEA.
Key Findings
On the basis of component, the software segment is expected to dominate the market from 2024 to 2033.
By product type, the transaction monitoring segment is anticipated to exhibit the highest growth during the forecast period.
On the basis of deployment type, the global anti-money laundering software market was dominated by the on-premise segment in 2023, and is expected to maintain its dominance in the upcoming years.
As per organization size, the large enterprises segment is likely to emerge as the dominant force in the coming years.
By end user, the banks & financial institutes segment is projected to grow at a notable pace throughout the forecast period.
Region wise, North America was the major shareholder in 2023 in the anti-money laundering software market.
Competitive Analysis
The key players operating in the anti-money laundering software market are LexisNexis Risk Solutions, Thomson Reuters Corporation, HyperVerge Technologies Private Limited, Moody's Corporation, SAS Institute Inc., Eastnets Holding Ltd., ACI Worldwide, Inc., NICE Actimize, IMTF, and Verafin Solutions ULC. These major players have adopted various key development strategies such as business expansion, new product launches, and partnerships to strengthen their foothold in the competitive market.
Key Benefits for Stakeholders
The study provides an in-depth analysis of the EV charging software market forecast along with the current and future trends to explain the imminent investment pockets.
Information about key drivers, restraints, and opportunities and their impact analysis on EV charging software market trends is provided in the report.
The Porter's five forces analysis illustrates the potency of the buyers and suppliers operating in the industry.
The quantitative analysis of the EV charging software market from 2023 to 2032 is provided to determine the market potential.
Additional benefits you will get with this purchase are:
- Quarterly Update and* (only available with a corporate license, on listed price)
- 5 additional Company Profile of client Choice pre- or Post-purchase, as a free update.
- Free Upcoming Version on the Purchase of Five and Enterprise User License.
- 16 analyst hours of support* (post-purchase, if you find additional data requirements upon review of the report, you may receive support amounting to 16 analyst hours to solve questions, and post-sale queries)
- 15% Free Customization* (in case the scope or segment of the report does not match your requirements, 15% is equivalent to 3 working days of free work, applicable once)
- Free data Pack on the Five and Enterprise User License. (Excel version of the report)
- Free Updated report if the report is 6-12 months old or older.
- 24-hour priority response*
- Free Industry updates and white papers.
Possible Customization with this report (with additional cost and timeline, please talk to the sales executive to know more)
- End user preferences and pain points
- Industry life cycle assessment, by region
- Investment Opportunities
- Product Benchmarking / Product specification and applications
- Product Life Cycles
- Senario Analysis & Growth Trend Comparision
- Technology Trend Analysis
- Market share analysis of players by products/segments
- New Product Development/ Product Matrix of Key Players
- Pain Point Analysis
- Regulatory Guidelines
- Strategic Recommedations
- Additional company profiles with specific to client's interest
- Additional country or region analysis- market size and forecast
- Brands Share Analysis
- Criss-cross segment analysis- market size and forecast
- Expanded list for Company Profiles
- Historic market data
- Market share analysis of players at global/region/country level
- SWOT Analysis
Key Market Segments
By Component
- Software
- Service
By Product Type
- KYC/CDD and Sanction Screening
- Transaction Monitoring
- Case Management and Reporting
By Deployment
- On-premise
- Cloud
By Organization Size
- Large Enterprises
- Small and Medium-sized Enterprises
By End-User
- Banks and Financial Institutes
- Insurance
- Gaming and Gambling
By Region
- North America
- U.S.
- Canada
- Europe
- UK
- Germany
- France
- Italy
- Spain
- Rest of Europe
- Asia-Pacific
- China
- Japan
- India
- Australia
- South Korea
- Rest of Asia-Pacific
- LAMEA
- Latin America
- Middle East
- Africa
Key Market Players:
- IMTF
- LexisNexis Risk Solutions
- Moody's Corporation
- NICE Actimize
- SAS Institute Inc.
- Eastnets Holding Ltd.
- HyperVerge Technologies Private Limited
- Verafin Solutions ULC
- Thomson Reuters Corporation
- ACI Worldwide, Inc.
TABLE OF CONTENTS
CHAPTER 1: INTRODUCTION
- 1.1. Report description
- 1.2. Key market segments
- 1.3. Key benefits to the stakeholders
- 1.4. Research methodology
- 1.4.1. Primary research
- 1.4.2. Secondary research
- 1.4.3. Analyst tools and models
CHAPTER 2: EXECUTIVE SUMMARY
- 2.1. CXO perspective
CHAPTER 3: MARKET OVERVIEW
- 3.1. Market definition and scope
- 3.2. Key findings
- 3.2.1. Top impacting factors
- 3.2.2. Top investment pockets
- 3.3. Porter's five forces analysis
- 3.3.1. Moderate to high bargaining power of suppliers
- 3.3.2. Moderate to high threat of new entrants
- 3.3.3. Moderate to high threat of substitutes
- 3.3.4. Low to moderate intensity of rivalry
- 3.3.5. Moderate bargaining power of buyers
- 3.4. Market dynamics
- 3.4.1. Drivers
- 3.4.1.1. Rise in Online Payment Modes in Bank Transactions
- 3.4.1.2. Increase in Strict Regulations and Compliances for Anti-money Laundering
- 3.4.1.3. The Rising Adoption of Internet Solutions
- 3.4.2. Restraints
- 3.4.2.1. Lack of Consumer Knowledge and Awareness
- 3.4.2.2. High Initial Cost and Expenses Consideration
- 3.4.3. Opportunities
- 3.4.3.1. Growth in Adoption of Analytics Solutions
- 3.4.3.2. Surge in Integration of Advanced Technologies
- 3.4.1. Drivers
CHAPTER 4: ANTI-MONEY LAUNDERING SOFTWARE MARKET, BY COMPONENT
- 4.1. Overview
- 4.1.1. Market size and forecast
- 4.2. Software
- 4.2.1. Key market trends, growth factors and opportunities
- 4.2.2. Market size and forecast, by region
- 4.2.3. Market share analysis by country
- 4.3. Service
- 4.3.1. Key market trends, growth factors and opportunities
- 4.3.2. Market size and forecast, by region
- 4.3.3. Market share analysis by country
CHAPTER 5: ANTI-MONEY LAUNDERING SOFTWARE MARKET, BY PRODUCT TYPE
- 5.1. Overview
- 5.1.1. Market size and forecast
- 5.2. KYC/CDD and Sanction Screening
- 5.2.1. Key market trends, growth factors and opportunities
- 5.2.2. Market size and forecast, by region
- 5.2.3. Market share analysis by country
- 5.3. Transaction Monitoring
- 5.3.1. Key market trends, growth factors and opportunities
- 5.3.2. Market size and forecast, by region
- 5.3.3. Market share analysis by country
- 5.4. Case Management and Reporting
- 5.4.1. Key market trends, growth factors and opportunities
- 5.4.2. Market size and forecast, by region
- 5.4.3. Market share analysis by country
CHAPTER 6: ANTI-MONEY LAUNDERING SOFTWARE MARKET, BY DEPLOYMENT
- 6.1. Overview
- 6.1.1. Market size and forecast
- 6.2. On-premise
- 6.2.1. Key market trends, growth factors and opportunities
- 6.2.2. Market size and forecast, by region
- 6.2.3. Market share analysis by country
- 6.3. Cloud
- 6.3.1. Key market trends, growth factors and opportunities
- 6.3.2. Market size and forecast, by region
- 6.3.3. Market share analysis by country
CHAPTER 7: ANTI-MONEY LAUNDERING SOFTWARE MARKET, BY ORGANIZATION SIZE
- 7.1. Overview
- 7.1.1. Market size and forecast
- 7.2. Large Enterprises
- 7.2.1. Key market trends, growth factors and opportunities
- 7.2.2. Market size and forecast, by region
- 7.2.3. Market share analysis by country
- 7.3. Small and Medium-sized Enterprises
- 7.3.1. Key market trends, growth factors and opportunities
- 7.3.2. Market size and forecast, by region
- 7.3.3. Market share analysis by country
CHAPTER 8: ANTI-MONEY LAUNDERING SOFTWARE MARKET, BY END-USER
- 8.1. Overview
- 8.1.1. Market size and forecast
- 8.2. Banks and Financial Institutes
- 8.2.1. Key market trends, growth factors and opportunities
- 8.2.2. Market size and forecast, by region
- 8.2.3. Market share analysis by country
- 8.3. Insurance
- 8.3.1. Key market trends, growth factors and opportunities
- 8.3.2. Market size and forecast, by region
- 8.3.3. Market share analysis by country
- 8.4. Gaming and Gambling
- 8.4.1. Key market trends, growth factors and opportunities
- 8.4.2. Market size and forecast, by region
- 8.4.3. Market share analysis by country
CHAPTER 9: ANTI-MONEY LAUNDERING SOFTWARE MARKET, BY REGION
- 9.1. Overview
- 9.1.1. Market size and forecast By Region
- 9.2. North America
- 9.2.1. Key market trends, growth factors and opportunities
- 9.2.2. Market size and forecast, by Component
- 9.2.3. Market size and forecast, by Product Type
- 9.2.4. Market size and forecast, by Deployment
- 9.2.5. Market size and forecast, by Organization Size
- 9.2.6. Market size and forecast, by End-User
- 9.2.7. Market size and forecast, by country
- 9.2.7.1. U.S.
- 9.2.7.1.1. Market size and forecast, by Component
- 9.2.7.1.2. Market size and forecast, by Product Type
- 9.2.7.1.3. Market size and forecast, by Deployment
- 9.2.7.1.4. Market size and forecast, by Organization Size
- 9.2.7.1.5. Market size and forecast, by End-User
- 9.2.7.2. Canada
- 9.2.7.2.1. Market size and forecast, by Component
- 9.2.7.2.2. Market size and forecast, by Product Type
- 9.2.7.2.3. Market size and forecast, by Deployment
- 9.2.7.2.4. Market size and forecast, by Organization Size
- 9.2.7.2.5. Market size and forecast, by End-User
- 9.3. Europe
- 9.3.1. Key market trends, growth factors and opportunities
- 9.3.2. Market size and forecast, by Component
- 9.3.3. Market size and forecast, by Product Type
- 9.3.4. Market size and forecast, by Deployment
- 9.3.5. Market size and forecast, by Organization Size
- 9.3.6. Market size and forecast, by End-User
- 9.3.7. Market size and forecast, by country
- 9.3.7.1. UK
- 9.3.7.1.1. Market size and forecast, by Component
- 9.3.7.1.2. Market size and forecast, by Product Type
- 9.3.7.1.3. Market size and forecast, by Deployment
- 9.3.7.1.4. Market size and forecast, by Organization Size
- 9.3.7.1.5. Market size and forecast, by End-User
- 9.3.7.2. Germany
- 9.3.7.2.1. Market size and forecast, by Component
- 9.3.7.2.2. Market size and forecast, by Product Type
- 9.3.7.2.3. Market size and forecast, by Deployment
- 9.3.7.2.4. Market size and forecast, by Organization Size
- 9.3.7.2.5. Market size and forecast, by End-User
- 9.3.7.3. France
- 9.3.7.3.1. Market size and forecast, by Component
- 9.3.7.3.2. Market size and forecast, by Product Type
- 9.3.7.3.3. Market size and forecast, by Deployment
- 9.3.7.3.4. Market size and forecast, by Organization Size
- 9.3.7.3.5. Market size and forecast, by End-User
- 9.3.7.4. Italy
- 9.3.7.4.1. Market size and forecast, by Component
- 9.3.7.4.2. Market size and forecast, by Product Type
- 9.3.7.4.3. Market size and forecast, by Deployment
- 9.3.7.4.4. Market size and forecast, by Organization Size
- 9.3.7.4.5. Market size and forecast, by End-User
- 9.3.7.5. Spain
- 9.3.7.5.1. Market size and forecast, by Component
- 9.3.7.5.2. Market size and forecast, by Product Type
- 9.3.7.5.3. Market size and forecast, by Deployment
- 9.3.7.5.4. Market size and forecast, by Organization Size
- 9.3.7.5.5. Market size and forecast, by End-User
- 9.3.7.6. Rest of Europe
- 9.3.7.6.1. Market size and forecast, by Component
- 9.3.7.6.2. Market size and forecast, by Product Type
- 9.3.7.6.3. Market size and forecast, by Deployment
- 9.3.7.6.4. Market size and forecast, by Organization Size
- 9.3.7.6.5. Market size and forecast, by End-User
- 9.4. Asia-Pacific
- 9.4.1. Key market trends, growth factors and opportunities
- 9.4.2. Market size and forecast, by Component
- 9.4.3. Market size and forecast, by Product Type
- 9.4.4. Market size and forecast, by Deployment
- 9.4.5. Market size and forecast, by Organization Size
- 9.4.6. Market size and forecast, by End-User
- 9.4.7. Market size and forecast, by country
- 9.4.7.1. China
- 9.4.7.1.1. Market size and forecast, by Component
- 9.4.7.1.2. Market size and forecast, by Product Type
- 9.4.7.1.3. Market size and forecast, by Deployment
- 9.4.7.1.4. Market size and forecast, by Organization Size
- 9.4.7.1.5. Market size and forecast, by End-User
- 9.4.7.2. Japan
- 9.4.7.2.1. Market size and forecast, by Component
- 9.4.7.2.2. Market size and forecast, by Product Type
- 9.4.7.2.3. Market size and forecast, by Deployment
- 9.4.7.2.4. Market size and forecast, by Organization Size
- 9.4.7.2.5. Market size and forecast, by End-User
- 9.4.7.3. India
- 9.4.7.3.1. Market size and forecast, by Component
- 9.4.7.3.2. Market size and forecast, by Product Type
- 9.4.7.3.3. Market size and forecast, by Deployment
- 9.4.7.3.4. Market size and forecast, by Organization Size
- 9.4.7.3.5. Market size and forecast, by End-User
- 9.4.7.4. Australia
- 9.4.7.4.1. Market size and forecast, by Component
- 9.4.7.4.2. Market size and forecast, by Product Type
- 9.4.7.4.3. Market size and forecast, by Deployment
- 9.4.7.4.4. Market size and forecast, by Organization Size
- 9.4.7.4.5. Market size and forecast, by End-User
- 9.4.7.5. South Korea
- 9.4.7.5.1. Market size and forecast, by Component
- 9.4.7.5.2. Market size and forecast, by Product Type
- 9.4.7.5.3. Market size and forecast, by Deployment
- 9.4.7.5.4. Market size and forecast, by Organization Size
- 9.4.7.5.5. Market size and forecast, by End-User
- 9.4.7.6. Rest of Asia-Pacific
- 9.4.7.6.1. Market size and forecast, by Component
- 9.4.7.6.2. Market size and forecast, by Product Type
- 9.4.7.6.3. Market size and forecast, by Deployment
- 9.4.7.6.4. Market size and forecast, by Organization Size
- 9.4.7.6.5. Market size and forecast, by End-User
- 9.5. LAMEA
- 9.5.1. Key market trends, growth factors and opportunities
- 9.5.2. Market size and forecast, by Component
- 9.5.3. Market size and forecast, by Product Type
- 9.5.4. Market size and forecast, by Deployment
- 9.5.5. Market size and forecast, by Organization Size
- 9.5.6. Market size and forecast, by End-User
- 9.5.7. Market size and forecast, by country
- 9.5.7.1. Latin America
- 9.5.7.1.1. Market size and forecast, by Component
- 9.5.7.1.2. Market size and forecast, by Product Type
- 9.5.7.1.3. Market size and forecast, by Deployment
- 9.5.7.1.4. Market size and forecast, by Organization Size
- 9.5.7.1.5. Market size and forecast, by End-User
- 9.5.7.2. Middle East
- 9.5.7.2.1. Market size and forecast, by Component
- 9.5.7.2.2. Market size and forecast, by Product Type
- 9.5.7.2.3. Market size and forecast, by Deployment
- 9.5.7.2.4. Market size and forecast, by Organization Size
- 9.5.7.2.5. Market size and forecast, by End-User
- 9.5.7.3. Africa
- 9.5.7.3.1. Market size and forecast, by Component
- 9.5.7.3.2. Market size and forecast, by Product Type
- 9.5.7.3.3. Market size and forecast, by Deployment
- 9.5.7.3.4. Market size and forecast, by Organization Size
- 9.5.7.3.5. Market size and forecast, by End-User
CHAPTER 10: COMPETITIVE LANDSCAPE
- 10.1. Introduction
- 10.2. Top winning strategies
- 10.3. Product mapping of top 10 player
- 10.4. Competitive dashboard
- 10.5. Competitive heatmap
- 10.6. Top player positioning, 2023
CHAPTER 11: COMPANY PROFILES
- 11.1. ACI Worldwide, Inc.
- 11.1.1. Company overview
- 11.1.2. Key executives
- 11.1.3. Company snapshot
- 11.1.4. Operating business segments
- 11.1.5. Product portfolio
- 11.1.6. Business performance
- 11.2. NICE Actimize
- 11.2.1. Company overview
- 11.2.2. Key executives
- 11.2.3. Company snapshot
- 11.2.4. Operating business segments
- 11.2.5. Product portfolio
- 11.2.6. Business performance
- 11.2.7. Key strategic moves and developments
- 11.3. Verafin Solutions ULC
- 11.3.1. Company overview
- 11.3.2. Key executives
- 11.3.3. Company snapshot
- 11.3.4. Operating business segments
- 11.3.5. Product portfolio
- 11.3.6. Business performance
- 11.3.7. Key strategic moves and developments
- 11.4. HyperVerge Technologies Private Limited
- 11.4.1. Company overview
- 11.4.2. Key executives
- 11.4.3. Company snapshot
- 11.4.4. Operating business segments
- 11.4.5. Product portfolio
- 11.5. IMTF
- 11.5.1. Company overview
- 11.5.2. Key executives
- 11.5.3. Company snapshot
- 11.5.4. Operating business segments
- 11.5.5. Product portfolio
- 11.6. LexisNexis Risk Solutions
- 11.6.1. Company overview
- 11.6.2. Key executives
- 11.6.3. Company snapshot
- 11.6.4. Operating business segments
- 11.6.5. Product portfolio
- 11.6.6. Business performance
- 11.6.7. Key strategic moves and developments
- 11.7. Thomson Reuters Corporation
- 11.7.1. Company overview
- 11.7.2. Key executives
- 11.7.3. Company snapshot
- 11.7.4. Operating business segments
- 11.7.5. Product portfolio
- 11.7.6. Business performance
- 11.8. Moody's Corporation
- 11.8.1. Company overview
- 11.8.2. Key executives
- 11.8.3. Company snapshot
- 11.8.4. Operating business segments
- 11.8.5. Product portfolio
- 11.8.6. Business performance
- 11.8.7. Key strategic moves and developments
- 11.9. SAS Institute Inc.
- 11.9.1. Company overview
- 11.9.2. Key executives
- 11.9.3. Company snapshot
- 11.9.4. Operating business segments
- 11.9.5. Product portfolio
- 11.10. Eastnets Holding Ltd.
- 11.10.1. Company overview
- 11.10.2. Key executives
- 11.10.3. Company snapshot
- 11.10.4. Operating business segments
- 11.10.5. Product portfolio
