
|
市場調査レポート
商品コード
1513372
E-waste(電気電子機器廃棄物)処理の世界市場:材質別、発生源別:機会分析と産業予測(2024年~2032年)E-waste Disposal Market By Material (Metal, Plastic, Glass, Others), By Source (Household Appliances, IT and Telecommunication, Consumer Electronics, Others): Global Opportunity Analysis and Industry Forecast, 2024-2032 |
||||||
|
|||||||

| E-waste(電気電子機器廃棄物)処理の世界市場:材質別、発生源別:機会分析と産業予測(2024年~2032年) |
|
出版日: 2024年04月01日
発行: Allied Market Research
ページ情報: 英文 250 Pages
納期: 2~3営業日
|

- 全表示
- 概要
- 図表
- 目次
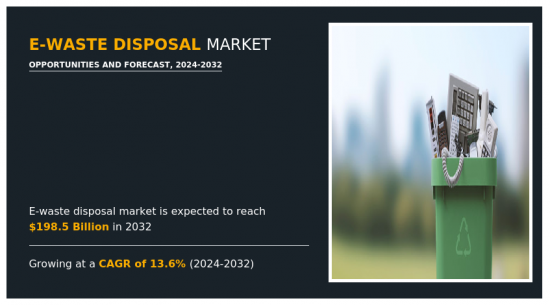
世界のE-waste(電気電子機器廃棄物)処理の市場規模は、2023年に644億米ドルと評価され、2024年~2032年に13.6%のCAGRで成長し、2032年には1,985億米ドルに達すると予測されています。
E-waste(電気電子機器廃棄物)処理市場は、廃棄された電気・電子機器を含む電気電子機器廃棄物の管理と処理に関連したものです。世界の技術の普及に伴い、電気電子機器廃棄物の処理は、その環境と健康への影響から、世界の緊急課題となっています。この市場には、環境的に持続可能な方法での電気電子機器廃棄物の収集、リサイクル、改修、廃棄といった様々なプロセスが含まれます。
社会がデジタル化を受け入れ、テクノロジーの導入が加速するにつれて、電気電子機器廃棄物の量は急増し続け、効果的な廃棄ソリューションの需要が高まっています。さらに、厳しい規制、環境保全に関する意識の高まり、企業の持続可能性への取り組みが、E-waste(電気電子機器廃棄物)処理市場をさらに前進させ、持続可能な未来のための電気電子機器廃棄物の責任ある管理の重要性を強調しています。
環境意識は、個人や組織が電気電子機器廃棄物処理の持続可能な解決策を模索する上で極めて重要な役割を果たしています。社会が不適切な電気電子機器廃棄物管理に伴う環境への悪影響をより認識するようになるにつれ、責任ある廃棄処理方法を採用しなければならないという危機感が高まっています。このような意識の高まりの原動力となっている主な懸念事項の一つは、電気電子機器廃棄物が生態系や人間の健康に与える有害な影響です。埋め立てや焼却などの不適切な廃棄方法は、鉛、水銀、カドミウムなどの有害物質を環境中に放出し、土壌、水、空気を汚染します。これらの有害物質は、生物多様性、農業生産性、人間の福利に重大なリスクをもたらし、さまざまな健康問題や生態系の不均衡の原因となっています。
さらに、天然資源の有限性と持続可能な資源管理の必要性が認識されつつあります。電子機器には、金、銀、銅、希土類金属などの貴重な材質が含まれており、これらはリサイクル処理によって回収されます。E-wasteをリサイクルすることで、貴重な資源が節約され、新たに採取する必要性が減り、資源の枯渇による環境への影響を最小限に抑えることができます。さらに、環境に対する意識は、擁護活動、教育キャンペーン、電気電子機器廃棄物汚染の結果を強調するメディア報道によって高まっています。
環境への害を最小限に抑え、資源効率を最大化するために、リサイクルや再生などの適切な廃棄方法が重要であることを、個人や組織が教育するようになってきています。このような懸念を受けて、政府、企業、非営利団体は、持続可能な電気電子機器廃棄物処理方法を促進するためのイニシアチブを実施しています。これには、規制の確立、リサイクルに対するインセンティブ、E-wasteの収集と処理のためのインフラ整備などが含まれます。環境意識を育み、持続可能な解決策を促進することで、社会は、より循環的で資源効率の高い経済へと向かう一方で、電気電子機器廃棄物処理による環境フットプリントを軽減しています。
E-waste管理のためのインフラが不十分であることは、特に資源の乏しい発展途上地域において、大きな課題となっています。専門的な施設や設備へのアクセスが限られているため、電気電子機器廃棄物の安全な収集、輸送、リサイクルが妨げられ、環境リスクや健康リスクを悪化させています。多くの新興諸国では、電気電子機器廃棄物のリサイクル施設が不足しているか、未発達であることが多く、地域社会は、電気電子機器廃棄物を焼却したり、埋立地や水域に投棄するなど、非公式で、しばしば危険な廃棄方法に頼らざるを得ない状況です。さらに、輸送網や物流インフラが不十分なため、集積所からリサイクル施設までの電気電子機器廃棄物の効率的な移動が妨げられ、遅延、非効率、コスト増につながっています。また、適切な廃棄物管理システムの欠如も、都市部におけるE-wasteの拡散を助長し、汚染や公衆衛生上の懸念を悪化させています。インフラの未整備という課題に対処するには、リサイクル施設の設置、輸送網の改善、効果的な規制枠組みの導入など、包括的なE-waste管理システムの開発に投資するために、政府、業界の利害関係者、国際機関が協調して取り組む必要があります。さらに、意識を高め、持続可能な消費と廃棄の慣行を促進するイニシアティブは、発展途上地域における不十分な電気電子機器廃棄物インフラが環境と社会に与える影響を緩和するのに役立ちます。
循環型経済モデルへの移行は、電気電子機器廃棄物処理分野において、直線的な「取る・作る・捨てる」のアプローチを、資源効率を最大化し廃棄物を最小化するクローズドループシステムに転換することで、大きな機会を提供します。リサイクル、再生、再製造のプロセスを通じて、E-wasteは埋立地から切り離され、生産サイクルに再統合されます。リサイクルでは、電子機器廃棄物から金属、プラスチック、ガラスなどの貴重な材質を回収し、新しい製品や部品の製造に使用します。リファービッシュ(再生)とは、使用済みの電子機器の修理やアップグレードを行い、寿命や機能を延ばすことで、新品に代わる手頃な価格で持続可能な製品を求める消費者の需要に応えることです。再製造は、劣化した部品やコンポーネントを交換することで製品を「新品同様の状態」に戻し、二次市場での再販や再利用を可能にします。
循環型経済への取り組みを取り入れることで、企業はバージン資源への依存を減らし、資源採取や廃棄物処理に伴う環境悪化を緩和し、二酸化炭素排出量を削減することができます。さらに、循環型経済モデルへの移行は、イノベーション、雇用創出、経済成長を促進すると同時に、持続可能な消費パターンを促進し、資源不足に対する回復力を高めます。全体として、電気電子機器廃棄物処理分野で循環型経済の原則を取り入れることは、企業が環境への影響を最小限に抑え、より持続可能な未来に貢献する機会を提供します。
世界のE-waste(電気電子機器廃棄物)処理市場は、材質、発生源、地域に区分されます。材質別では、市場は金属、プラスチック、ガラス、その他に分けられます。発生源別では、家電、IT・通信、家庭用電子機器、その他に分類されます。
地域別では、北米(米国、カナダ、メキシコ)、欧州(英国、ドイツ、フランス、イタリア、スペイン、その他欧州)、アジア太平洋(中国、日本、インド、韓国、オーストラリア、その他アジア太平洋)、ラテンアメリカ(ブラジル、アルゼンチン、その他ラテンアメリカ)、中東・アフリカ(アラブ首長国連邦、サウジアラビア、南アフリカ、その他中東・アフリカ)で分析されます。
世界のE-waste(電気電子機器廃棄物)処理市場で事業を展開している企業は、Desco Electronic Recyclers、Aurubis AG、Boliden Group、MBA Polymers Inc.、ERI、Sims Limited、Umicore、Stena Metall AB、Tetronics Environmental Technology Company、MRI Technologiesです。
利害関係者にとっての主なメリット
- 本レポートは、2023年~2032年のE-waste(電気電子機器廃棄物)処理市場分析の市場セグメント、現在の動向、推定、力学の定量分析を提供し、E-waste(電気電子機器廃棄物)処理市場の有力な機会を特定します。
- 市場促進要因、市場抑制要因、市場機会に関連する情報とともに市場調査を提供します。
- ポーターのファイブフォース分析は、利害関係者が利益志向のビジネス決定を行い、サプライヤーとバイヤーのネットワークを強化できるように、バイヤーとサプライヤーの潜在力を明らかにします。
- E-waste(電気電子機器廃棄物)処理市場のセグメンテーションの詳細な分析は、市場機会を決定するのに役立ちます。
- 各地域の主要国は、世界市場への収益貢献度に応じてマッピングされています。
- 市場企業のポジショニングは、ベンチマーキングを容易にし、市場企業の現在のポジションの明確な理解を提供します。
- 本レポートは、地域および世界のE-waste(電気電子機器廃棄物)処理市場動向、主要企業、市場セグメント、応用分野、市場成長戦略の分析を含んでいます。
本レポートで可能なレポートカスタマイズ(追加費用とタイムラインに関しましては販売担当へご連絡ください)
- 市場参入戦略
- 主要企業の詳細(所在地、連絡先、サプライヤー/ベンダーネットワークなどを含む、エクセル形式)
- SWOT分析
目次
第1章 イントロダクション
第2章 エグゼクティブサマリー
第3章 市場概要
- 市場の定義と範囲
- 主な調査結果
- 影響要因
- 主な投資機会
- ポーターのファイブフォース分析
- 市場力学
- 促進要因
- 抑制要因
- 機会
- 特許情勢
第4章 E-waste(電気電子機器廃棄物)処理市場:材質別
- 概要
- 金属
- プラスチック
- ガラス
- その他
第5章 E-waste(電気電子機器廃棄物)処理市場:発生源別
- 概要
- 家電
- IT・通信
- 家庭用電子機
- その他
第6章 E-waste(電気電子機器廃棄物)処理市場:地域別
- 概要
- 北米
- 米国
- カナダ
- メキシコ
- 欧州
- ドイツ
- フランス
- イタリア
- 英国
- スペイン
- その他
- アジア太平洋
- 中国
- 日本
- インド
- オーストラリア
- 韓国
- その他
- ラテンアメリカ
- ブラジル
- アルゼンチン
- その他
- 中東・アフリカ
- サウジアラビア
- 南アフリカ
- その他
第7章 競合情勢
- イントロダクション
- 主要成功戦略
- 主要10社の製品マッピング
- 競合ダッシュボード
- 競合ヒートマップ
- 主要企業のポジショニング(2023年)
第8章 企業プロファイル
- Desco Electronic Recyclers
- AURUBIS AG
- Boliden Group
- MBA Polymers Inc
- ERI
- Sims Limited
- Umicore
- Stena Metall AB
- Tetronics Environmental Technology Company
- MRI Technologies
LIST OF TABLES
- TABLE 01. GLOBAL E-WASTE DISPOSAL MARKET, BY MATERIAL, 2023-2032 ($MILLION)
- TABLE 02. E-WASTE DISPOSAL MARKET FOR METAL, BY REGION, 2023-2032 ($MILLION)
- TABLE 03. E-WASTE DISPOSAL MARKET FOR PLASTIC, BY REGION, 2023-2032 ($MILLION)
- TABLE 04. E-WASTE DISPOSAL MARKET FOR GLASS, BY REGION, 2023-2032 ($MILLION)
- TABLE 05. E-WASTE DISPOSAL MARKET FOR OTHERS, BY REGION, 2023-2032 ($MILLION)
- TABLE 06. GLOBAL E-WASTE DISPOSAL MARKET, BY SOURCE, 2023-2032 ($MILLION)
- TABLE 07. E-WASTE DISPOSAL MARKET FOR HOUSEHOLD APPLIANCES, BY REGION, 2023-2032 ($MILLION)
- TABLE 08. E-WASTE DISPOSAL MARKET FOR IT AND TELECOMMUNICATION, BY REGION, 2023-2032 ($MILLION)
- TABLE 09. E-WASTE DISPOSAL MARKET FOR CONSUMER ELECTRONICS, BY REGION, 2023-2032 ($MILLION)
- TABLE 10. E-WASTE DISPOSAL MARKET FOR OTHERS, BY REGION, 2023-2032 ($MILLION)
- TABLE 11. E-WASTE DISPOSAL MARKET, BY REGION, 2023-2032 ($MILLION)
- TABLE 12. NORTH AMERICA E-WASTE DISPOSAL MARKET, BY MATERIAL, 2023-2032 ($MILLION)
- TABLE 13. NORTH AMERICA E-WASTE DISPOSAL MARKET, BY SOURCE, 2023-2032 ($MILLION)
- TABLE 14. NORTH AMERICA E-WASTE DISPOSAL MARKET, BY COUNTRY, 2023-2032 ($MILLION)
- TABLE 15. U.S. E-WASTE DISPOSAL MARKET, BY MATERIAL, 2023-2032 ($MILLION)
- TABLE 16. U.S. E-WASTE DISPOSAL MARKET, BY SOURCE, 2023-2032 ($MILLION)
- TABLE 17. CANADA E-WASTE DISPOSAL MARKET, BY MATERIAL, 2023-2032 ($MILLION)
- TABLE 18. CANADA E-WASTE DISPOSAL MARKET, BY SOURCE, 2023-2032 ($MILLION)
- TABLE 19. MEXICO E-WASTE DISPOSAL MARKET, BY MATERIAL, 2023-2032 ($MILLION)
- TABLE 20. MEXICO E-WASTE DISPOSAL MARKET, BY SOURCE, 2023-2032 ($MILLION)
- TABLE 21. EUROPE E-WASTE DISPOSAL MARKET, BY MATERIAL, 2023-2032 ($MILLION)
- TABLE 22. EUROPE E-WASTE DISPOSAL MARKET, BY SOURCE, 2023-2032 ($MILLION)
- TABLE 23. EUROPE E-WASTE DISPOSAL MARKET, BY COUNTRY, 2023-2032 ($MILLION)
- TABLE 24. GERMANY E-WASTE DISPOSAL MARKET, BY MATERIAL, 2023-2032 ($MILLION)
- TABLE 25. GERMANY E-WASTE DISPOSAL MARKET, BY SOURCE, 2023-2032 ($MILLION)
- TABLE 26. FRANCE E-WASTE DISPOSAL MARKET, BY MATERIAL, 2023-2032 ($MILLION)
- TABLE 27. FRANCE E-WASTE DISPOSAL MARKET, BY SOURCE, 2023-2032 ($MILLION)
- TABLE 28. ITALY E-WASTE DISPOSAL MARKET, BY MATERIAL, 2023-2032 ($MILLION)
- TABLE 29. ITALY E-WASTE DISPOSAL MARKET, BY SOURCE, 2023-2032 ($MILLION)
- TABLE 30. UK E-WASTE DISPOSAL MARKET, BY MATERIAL, 2023-2032 ($MILLION)
- TABLE 31. UK E-WASTE DISPOSAL MARKET, BY SOURCE, 2023-2032 ($MILLION)
- TABLE 32. SPAIN E-WASTE DISPOSAL MARKET, BY MATERIAL, 2023-2032 ($MILLION)
- TABLE 33. SPAIN E-WASTE DISPOSAL MARKET, BY SOURCE, 2023-2032 ($MILLION)
- TABLE 34. REST OF EUROPE E-WASTE DISPOSAL MARKET, BY MATERIAL, 2023-2032 ($MILLION)
- TABLE 35. REST OF EUROPE E-WASTE DISPOSAL MARKET, BY SOURCE, 2023-2032 ($MILLION)
- TABLE 36. ASIA-PACIFIC E-WASTE DISPOSAL MARKET, BY MATERIAL, 2023-2032 ($MILLION)
- TABLE 37. ASIA-PACIFIC E-WASTE DISPOSAL MARKET, BY SOURCE, 2023-2032 ($MILLION)
- TABLE 38. ASIA-PACIFIC E-WASTE DISPOSAL MARKET, BY COUNTRY, 2023-2032 ($MILLION)
- TABLE 39. CHINA E-WASTE DISPOSAL MARKET, BY MATERIAL, 2023-2032 ($MILLION)
- TABLE 40. CHINA E-WASTE DISPOSAL MARKET, BY SOURCE, 2023-2032 ($MILLION)
- TABLE 41. JAPAN E-WASTE DISPOSAL MARKET, BY MATERIAL, 2023-2032 ($MILLION)
- TABLE 42. JAPAN E-WASTE DISPOSAL MARKET, BY SOURCE, 2023-2032 ($MILLION)
- TABLE 43. INDIA E-WASTE DISPOSAL MARKET, BY MATERIAL, 2023-2032 ($MILLION)
- TABLE 44. INDIA E-WASTE DISPOSAL MARKET, BY SOURCE, 2023-2032 ($MILLION)
- TABLE 45. AUSTRALIA E-WASTE DISPOSAL MARKET, BY MATERIAL, 2023-2032 ($MILLION)
- TABLE 46. AUSTRALIA E-WASTE DISPOSAL MARKET, BY SOURCE, 2023-2032 ($MILLION)
- TABLE 47. SOUTH KOREA E-WASTE DISPOSAL MARKET, BY MATERIAL, 2023-2032 ($MILLION)
- TABLE 48. SOUTH KOREA E-WASTE DISPOSAL MARKET, BY SOURCE, 2023-2032 ($MILLION)
- TABLE 49. REST OF ASIA-PACIFIC E-WASTE DISPOSAL MARKET, BY MATERIAL, 2023-2032 ($MILLION)
- TABLE 50. REST OF ASIA-PACIFIC E-WASTE DISPOSAL MARKET, BY SOURCE, 2023-2032 ($MILLION)
- TABLE 51. LATIN AMERICA E-WASTE DISPOSAL MARKET, BY MATERIAL, 2023-2032 ($MILLION)
- TABLE 52. LATIN AMERICA E-WASTE DISPOSAL MARKET, BY SOURCE, 2023-2032 ($MILLION)
- TABLE 53. LATIN AMERICA E-WASTE DISPOSAL MARKET, BY COUNTRY, 2023-2032 ($MILLION)
- TABLE 54. BRAZIL E-WASTE DISPOSAL MARKET, BY MATERIAL, 2023-2032 ($MILLION)
- TABLE 55. BRAZIL E-WASTE DISPOSAL MARKET, BY SOURCE, 2023-2032 ($MILLION)
- TABLE 56. ARGENTINA E-WASTE DISPOSAL MARKET, BY MATERIAL, 2023-2032 ($MILLION)
- TABLE 57. ARGENTINA E-WASTE DISPOSAL MARKET, BY SOURCE, 2023-2032 ($MILLION)
- TABLE 58. REST OF LATIN AMERICA E-WASTE DISPOSAL MARKET, BY MATERIAL, 2023-2032 ($MILLION)
- TABLE 59. REST OF LATIN AMERICA E-WASTE DISPOSAL MARKET, BY SOURCE, 2023-2032 ($MILLION)
- TABLE 60. MIDDLE EAST AND AFRICA E-WASTE DISPOSAL MARKET, BY MATERIAL, 2023-2032 ($MILLION)
- TABLE 61. MIDDLE EAST AND AFRICA E-WASTE DISPOSAL MARKET, BY SOURCE, 2023-2032 ($MILLION)
- TABLE 62. MIDDLE EAST AND AFRICA E-WASTE DISPOSAL MARKET, BY COUNTRY, 2023-2032 ($MILLION)
- TABLE 63. SAUDI ARABIA E-WASTE DISPOSAL MARKET, BY MATERIAL, 2023-2032 ($MILLION)
- TABLE 64. SAUDI ARABIA E-WASTE DISPOSAL MARKET, BY SOURCE, 2023-2032 ($MILLION)
- TABLE 65. SOUTH AFRICA E-WASTE DISPOSAL MARKET, BY MATERIAL, 2023-2032 ($MILLION)
- TABLE 66. SOUTH AFRICA E-WASTE DISPOSAL MARKET, BY SOURCE, 2023-2032 ($MILLION)
- TABLE 67. REST OF MIDDLE EAST AND AFRICA E-WASTE DISPOSAL MARKET, BY MATERIAL, 2023-2032 ($MILLION)
- TABLE 68. REST OF MIDDLE EAST AND AFRICA E-WASTE DISPOSAL MARKET, BY SOURCE, 2023-2032 ($MILLION)
- TABLE 69. DESCO ELECTRONIC RECYCLERS: KEY EXECUTIVES
- TABLE 70. DESCO ELECTRONIC RECYCLERS: COMPANY SNAPSHOT
- TABLE 71. DESCO ELECTRONIC RECYCLERS: PRODUCT SEGMENTS
- TABLE 72. DESCO ELECTRONIC RECYCLERS: SERVICE SEGMENTS
- TABLE 73. DESCO ELECTRONIC RECYCLERS: PRODUCT PORTFOLIO
- TABLE 74. DESCO ELECTRONIC RECYCLERS: KEY STRATEGIES
- TABLE 75. AURUBIS AG: KEY EXECUTIVES
- TABLE 76. AURUBIS AG: COMPANY SNAPSHOT
- TABLE 77. AURUBIS AG: PRODUCT SEGMENTS
- TABLE 78. AURUBIS AG: SERVICE SEGMENTS
- TABLE 79. AURUBIS AG: PRODUCT PORTFOLIO
- TABLE 80. AURUBIS AG: KEY STRATEGIES
- TABLE 81. BOLIDEN GROUP: KEY EXECUTIVES
- TABLE 82. BOLIDEN GROUP: COMPANY SNAPSHOT
- TABLE 83. BOLIDEN GROUP: PRODUCT SEGMENTS
- TABLE 84. BOLIDEN GROUP: SERVICE SEGMENTS
- TABLE 85. BOLIDEN GROUP: PRODUCT PORTFOLIO
- TABLE 86. BOLIDEN GROUP: KEY STRATEGIES
- TABLE 87. MBA POLYMERS INC: KEY EXECUTIVES
- TABLE 88. MBA POLYMERS INC: COMPANY SNAPSHOT
- TABLE 89. MBA POLYMERS INC: PRODUCT SEGMENTS
- TABLE 90. MBA POLYMERS INC: SERVICE SEGMENTS
- TABLE 91. MBA POLYMERS INC: PRODUCT PORTFOLIO
- TABLE 92. MBA POLYMERS INC: KEY STRATEGIES
- TABLE 93. ERI: KEY EXECUTIVES
- TABLE 94. ERI: COMPANY SNAPSHOT
- TABLE 95. ERI: PRODUCT SEGMENTS
- TABLE 96. ERI: SERVICE SEGMENTS
- TABLE 97. ERI: PRODUCT PORTFOLIO
- TABLE 98. ERI: KEY STRATEGIES
- TABLE 99. SIMS LIMITED: KEY EXECUTIVES
- TABLE 100. SIMS LIMITED: COMPANY SNAPSHOT
- TABLE 101. SIMS LIMITED: PRODUCT SEGMENTS
- TABLE 102. SIMS LIMITED: SERVICE SEGMENTS
- TABLE 103. SIMS LIMITED: PRODUCT PORTFOLIO
- TABLE 104. SIMS LIMITED: KEY STRATEGIES
- TABLE 105. UMICORE: KEY EXECUTIVES
- TABLE 106. UMICORE: COMPANY SNAPSHOT
- TABLE 107. UMICORE: PRODUCT SEGMENTS
- TABLE 108. UMICORE: SERVICE SEGMENTS
- TABLE 109. UMICORE: PRODUCT PORTFOLIO
- TABLE 110. UMICORE: KEY STRATEGIES
- TABLE 111. STENA METALL AB: KEY EXECUTIVES
- TABLE 112. STENA METALL AB: COMPANY SNAPSHOT
- TABLE 113. STENA METALL AB: PRODUCT SEGMENTS
- TABLE 114. STENA METALL AB: SERVICE SEGMENTS
- TABLE 115. STENA METALL AB: PRODUCT PORTFOLIO
- TABLE 116. STENA METALL AB: KEY STRATEGIES
- TABLE 117. TETRONICS ENVIRONMENTAL TECHNOLOGY COMPANY: KEY EXECUTIVES
- TABLE 118. TETRONICS ENVIRONMENTAL TECHNOLOGY COMPANY: COMPANY SNAPSHOT
- TABLE 119. TETRONICS ENVIRONMENTAL TECHNOLOGY COMPANY: PRODUCT SEGMENTS
- TABLE 120. TETRONICS ENVIRONMENTAL TECHNOLOGY COMPANY: SERVICE SEGMENTS
- TABLE 121. TETRONICS ENVIRONMENTAL TECHNOLOGY COMPANY: PRODUCT PORTFOLIO
- TABLE 122. TETRONICS ENVIRONMENTAL TECHNOLOGY COMPANY: KEY STRATEGIES
- TABLE 123. MRI TECHNOLOGIES: KEY EXECUTIVES
- TABLE 124. MRI TECHNOLOGIES: COMPANY SNAPSHOT
- TABLE 125. MRI TECHNOLOGIES: PRODUCT SEGMENTS
- TABLE 126. MRI TECHNOLOGIES: SERVICE SEGMENTS
- TABLE 127. MRI TECHNOLOGIES: PRODUCT PORTFOLIO
- TABLE 128. MRI TECHNOLOGIES: KEY STRATEGIES
LIST OF FIGURES
- FIGURE 01. E-WASTE DISPOSAL MARKET, 2023-2032
- FIGURE 02. SEGMENTATION OF E-WASTE DISPOSAL MARKET,2023-2032
- FIGURE 03. TOP IMPACTING FACTORS IN E-WASTE DISPOSAL MARKET
- FIGURE 04. TOP INVESTMENT POCKETS IN E-WASTE DISPOSAL MARKET (2024-2032)
- FIGURE 05. BARGAINING POWER OF SUPPLIERS
- FIGURE 06. BARGAINING POWER OF BUYERS
- FIGURE 07. THREAT OF SUBSTITUTION
- FIGURE 08. THREAT OF SUBSTITUTION
- FIGURE 09. COMPETITIVE RIVALRY
- FIGURE 10. GLOBAL E-WASTE DISPOSAL MARKET:DRIVERS, RESTRAINTS AND OPPORTUNITIES
- FIGURE 11. PATENT ANALYSIS BY COMPANY
- FIGURE 12. PATENT ANALYSIS BY COUNTRY
- FIGURE 13. E-WASTE DISPOSAL MARKET, BY MATERIAL, 2023 AND 2032(%)
- FIGURE 14. COMPARATIVE SHARE ANALYSIS OF E-WASTE DISPOSAL MARKET FOR METAL, BY COUNTRY 2023 AND 2032(%)
- FIGURE 15. COMPARATIVE SHARE ANALYSIS OF E-WASTE DISPOSAL MARKET FOR PLASTIC, BY COUNTRY 2023 AND 2032(%)
- FIGURE 16. COMPARATIVE SHARE ANALYSIS OF E-WASTE DISPOSAL MARKET FOR GLASS, BY COUNTRY 2023 AND 2032(%)
- FIGURE 17. COMPARATIVE SHARE ANALYSIS OF E-WASTE DISPOSAL MARKET FOR OTHERS, BY COUNTRY 2023 AND 2032(%)
- FIGURE 18. E-WASTE DISPOSAL MARKET, BY SOURCE, 2023 AND 2032(%)
- FIGURE 19. COMPARATIVE SHARE ANALYSIS OF E-WASTE DISPOSAL MARKET FOR HOUSEHOLD APPLIANCES, BY COUNTRY 2023 AND 2032(%)
- FIGURE 20. COMPARATIVE SHARE ANALYSIS OF E-WASTE DISPOSAL MARKET FOR IT AND TELECOMMUNICATION, BY COUNTRY 2023 AND 2032(%)
- FIGURE 21. COMPARATIVE SHARE ANALYSIS OF E-WASTE DISPOSAL MARKET FOR CONSUMER ELECTRONICS, BY COUNTRY 2023 AND 2032(%)
- FIGURE 22. COMPARATIVE SHARE ANALYSIS OF E-WASTE DISPOSAL MARKET FOR OTHERS, BY COUNTRY 2023 AND 2032(%)
- FIGURE 23. E-WASTE DISPOSAL MARKET BY REGION, 2023 AND 2032(%)
- FIGURE 24. U.S. E-WASTE DISPOSAL MARKET, 2023-2032 ($MILLION)
- FIGURE 25. CANADA E-WASTE DISPOSAL MARKET, 2023-2032 ($MILLION)
- FIGURE 26. MEXICO E-WASTE DISPOSAL MARKET, 2023-2032 ($MILLION)
- FIGURE 27. GERMANY E-WASTE DISPOSAL MARKET, 2023-2032 ($MILLION)
- FIGURE 28. FRANCE E-WASTE DISPOSAL MARKET, 2023-2032 ($MILLION)
- FIGURE 29. ITALY E-WASTE DISPOSAL MARKET, 2023-2032 ($MILLION)
- FIGURE 30. UK E-WASTE DISPOSAL MARKET, 2023-2032 ($MILLION)
- FIGURE 31. SPAIN E-WASTE DISPOSAL MARKET, 2023-2032 ($MILLION)
- FIGURE 32. REST OF EUROPE E-WASTE DISPOSAL MARKET, 2023-2032 ($MILLION)
- FIGURE 33. CHINA E-WASTE DISPOSAL MARKET, 2023-2032 ($MILLION)
- FIGURE 34. JAPAN E-WASTE DISPOSAL MARKET, 2023-2032 ($MILLION)
- FIGURE 35. INDIA E-WASTE DISPOSAL MARKET, 2023-2032 ($MILLION)
- FIGURE 36. AUSTRALIA E-WASTE DISPOSAL MARKET, 2023-2032 ($MILLION)
- FIGURE 37. SOUTH KOREA E-WASTE DISPOSAL MARKET, 2023-2032 ($MILLION)
- FIGURE 38. REST OF ASIA-PACIFIC E-WASTE DISPOSAL MARKET, 2023-2032 ($MILLION)
- FIGURE 39. BRAZIL E-WASTE DISPOSAL MARKET, 2023-2032 ($MILLION)
- FIGURE 40. ARGENTINA E-WASTE DISPOSAL MARKET, 2023-2032 ($MILLION)
- FIGURE 41. REST OF LATIN AMERICA E-WASTE DISPOSAL MARKET, 2023-2032 ($MILLION)
- FIGURE 42. SAUDI ARABIA E-WASTE DISPOSAL MARKET, 2023-2032 ($MILLION)
- FIGURE 43. SOUTH AFRICA E-WASTE DISPOSAL MARKET, 2023-2032 ($MILLION)
- FIGURE 44. REST OF MIDDLE EAST AND AFRICA E-WASTE DISPOSAL MARKET, 2023-2032 ($MILLION)
- FIGURE 45. TOP WINNING STRATEGIES, BY YEAR
- FIGURE 46. TOP WINNING STRATEGIES, BY DEVELOPMENT
- FIGURE 47. TOP WINNING STRATEGIES, BY COMPANY
- FIGURE 48. PRODUCT MAPPING OF TOP 10 PLAYERS
- FIGURE 49. COMPETITIVE DASHBOARD
- FIGURE 50. COMPETITIVE HEATMAP: E-WASTE DISPOSAL MARKET
- FIGURE 51. TOP PLAYER POSITIONING, 2023
The e-waste disposal market was valued at $64.4 billion in 2023 and is projected to reach $ 198.5 billion by 2032, growing at a CAGR of 13.6% from 2024 to 2032.
The e-waste disposal market pertains to the management and treatment of electronic waste, encompassing discarded electrical and electronic devices. With the proliferation of technology worldwide, the disposal of electronic waste has become a pressing global concern due to its environmental and health implications. This market involves various processes such as collection, recycling, refurbishment, and disposal of e-waste in an environmentally sustainable manner.
As societies embrace digitalization and technology adoption accelerates, the volume of electronic waste continues to surge, driving the demand for effective disposal solutions. In addition, stringent regulations, growing awareness regarding environmental conservation, and corporate sustainability initiatives further propel the e-waste disposal market forward, emphasizing the importance of responsible management of electronic waste for a sustainable future.
Environmental awareness plays a pivotal role in driving individuals and organizations towards seeking sustainable solutions for e-waste disposal. As society becomes more cognizant of the adverse environmental impacts associated with improper e-waste management, there is a growing sense of urgency to adopt responsible disposal practices. One of the primary concerns driving this awareness is the detrimental impact of e-waste on ecosystems and human health. Improper disposal methods such as landfilling or incineration release hazardous substances like lead, mercury, and cadmium into the environment, contaminating soil, water, and air. These toxins pose significant risks to biodiversity, agricultural productivity, and human well-being, contributing to various health problems and ecological imbalances.
Moreover, there is a growing recognition of the finite nature of natural resources and the need for sustainable resource management. Electronic devices contain valuable materials such as gold, silver, copper, and rare earth metals, which are recovered through recycling processes. By recycling e-waste, valuable resources are conserved, reducing the need for virgin extraction, and minimizing the environmental impact of resource depletion. Furthermore, environmental awareness is fueled by advocacy efforts, educational campaigns, and media coverage highlighting the consequences of e-waste pollution.
Individuals and organizations are increasingly educated about the importance of proper disposal methods, such as recycling and refurbishment, to minimize environmental harm and maximize resource efficiency. In response to these concerns, governments, businesses, and non-profit organizations are implementing initiatives to promote sustainable e-waste disposal practices. This includes the establishment of regulations, incentives for recycling, and the development of infrastructure for e-waste collection and processing. By fostering environmental awareness and promoting sustainable solutions, society mitigates the environmental footprint of e-waste disposal while moving towards a more circular and resource-efficient economy.
Inadequate infrastructure for e-waste management presents a formidable challenge, especially in developing regions where resources are scarce. Limited access to specialized facilities and equipment hampers the safe collection, transportation, and recycling of electronic waste, exacerbating environmental and health risks. In many developing countries, e-waste recycling facilities are often lacking or underdeveloped, forcing communities to resort to informal and often hazardous methods of disposal, such as burning or dumping e-waste in landfills or water bodies. Furthermore, inadequate transportation networks and logistics infrastructure impede the efficient movement of e-waste from collection points to recycling facilities, leading to delays, inefficiencies, and increased costs. Lack of proper waste management systems also contributes to the proliferation of e-waste in urban areas, exacerbating pollution and public health concerns. Addressing the challenge of inadequate infrastructure requires concerted efforts from governments, industry stakeholders, and international organizations to invest in the development of comprehensive e-waste management systems, including the establishment of recycling facilities, improvement of transportation networks, and implementation of effective regulatory frameworks. In addition, initiatives to raise awareness and promote sustainable consumption and disposal practices help mitigate the environmental and social impacts of inadequate e-waste infrastructure in developing regions.
Transitioning to a circular economy model offers profound opportunities within the e-waste disposal sector by transforming the linear take-make-dispose approach into a closed-loop system that maximizes resource efficiency and minimizes waste. Through recycling, refurbishment, and remanufacturing processes, e-waste is diverted from landfills and reintegrated into the production cycle, thereby extracting additional value from discarded electronics. Recycling involves recovering valuable materials such as metals, plastics, and glass from e-waste, which then are used to manufacture new products or components. Refurbishment entails repairing and upgrading used electronics to extend their lifespan and functionality, catering to consumers' demand for affordable and sustainable alternatives to new devices. Remanufacturing involves restoring products to a "like-new condition by replacing worn-out parts and components, enabling their resale or reuse in secondary markets.
By embracing circular economy initiatives, businesses reduce their reliance on virgin resources, mitigate environmental degradation associated with resource extraction and waste disposal, and lower their carbon footprint. Furthermore, transitioning to a circular economy model fosters innovation, job creation, and economic growth while promoting sustainable consumption patterns and enhancing resilience to resource scarcity. Overall, embracing circular economy principles within the e-waste disposal sector presents opportunities for businesses to minimize environmental impact, and contribute to a more sustainable future.
The global e-waste disposal market is segmented into material, source, and region. By material, the market is divided into metal, plastic, glass, and others. On the basis of source, it is categorized into household appliances, IT and telecommunication, consumer electronics, and others.
Region-wise, it is analyzed across North America (the U.S., Canada, and Mexico), Europe (the UK, Germany, France, Italy, Spain, and the rest of Europe), Asia-Pacific (China, Japan, India, South Korea, Australia, and rest of Asia-Pacific), Latin America (Brazil, Argentina, and rest of Latin America), and Middle East and Africa (UAE, Saudi Arabia, South Africa, and rest of Middle East & Africa).
The players operating in the global e-waste disposal market are Desco Electronic Recyclers, Aurubis AG, Boliden Group, MBA Polymers Inc., ERI, Sims Limited, Umicore, Stena Metall AB, Tetronics Environmental Technology Company, and MRI Technologies.
Key Benefits For Stakeholders
- This report provides a quantitative analysis of the market segments, current trends, estimations, and dynamics of the e-waste disposal market analysis from 2023 to 2032 to identify the prevailing e-waste disposal market opportunities.
- The market research is offered along with information related to key drivers, restraints, and opportunities.
- Porter's five forces analysis highlights the potency of buyers and suppliers to enable stakeholders make profit-oriented business decisions and strengthen their supplier-buyer network.
- In-depth analysis of the e-waste disposal market segmentation assists to determine the prevailing market opportunities.
- Major countries in each region are mapped according to their revenue contribution to the global market.
- Market player positioning facilitates benchmarking and provides a clear understanding of the present position of the market players.
- The report includes the analysis of the regional as well as global e-waste disposal market trends, key players, market segments, application areas, and market growth strategies.
Additional benefits you will get with this purchase are:
- Quarterly Update and* (only available with a corporate license, on listed price)
- 5 additional Company Profile of client Choice pre- or Post-purchase, as a free update.
- Free Upcoming Version on the Purchase of Five and Enterprise User License.
- 16 analyst hours of support* (post-purchase, if you find additional data requirements upon review of the report, you may receive support amounting to 16 analyst hours to solve questions, and post-sale queries)
- 15% Free Customization* (in case the scope or segment of the report does not match your requirements, 15% is equivalent to 3 working days of free work, applicable once)
- Free data Pack on the Five and Enterprise User License. (Excel version of the report)
- Free Updated report if the report is 6-12 months old or older.
- 24-hour priority response*
- Free Industry updates and white papers.
Possible Customization with this report (with additional cost and timeline, please talk to the sales executive to know more)
- Go To Market Strategy
- Key player details (including location, contact details, supplier/vendor network etc. in excel format)
- SWOT Analysis
Key Market Segments
By Material
- Metal
- Plastic
- Glass
- Others
By Source
- Household Appliances
- IT and Telecommunication
- Consumer Electronics
- Others
By Region
- North America
- U.S.
- Canada
- Mexico
- Europe
- Germany
- France
- Italy
- UK
- Spain
- Rest of Europe
- Asia-Pacific
- China
- Japan
- India
- Australia
- South Korea
- Rest of Asia-Pacific
- Latin America
- Brazil
- Argentina
- Rest of Latin America
- Middle East and Africa
- Saudi Arabia
- South Africa
- Rest of Middle East And Africa
Key Market Players:
- Desco Electronic Recyclers
- AURUBIS AG
- Boliden Group
- MBA Polymers Inc
- ERI
- Sims Limited
- Umicore
- Stena Metall AB
- Tetronics Environmental Technology Company
- MRI Technologies
TABLE OF CONTENTS
CHAPTER 1: INTRODUCTION
- 1.1. Report description
- 1.2. Key market segments
- 1.3. Key benefits to the stakeholders
- 1.4. Research methodology
- 1.4.1. Primary research
- 1.4.2. Secondary research
- 1.4.3. Analyst tools and models
CHAPTER 2: EXECUTIVE SUMMARY
- 2.1. CXO perspective
CHAPTER 3: MARKET OVERVIEW
- 3.1. Market definition and scope
- 3.2. Key findings
- 3.2.1. Top impacting factors
- 3.2.2. Top investment pockets
- 3.3. Porter's five forces analysis
- 3.4. Market dynamics
- 3.4.1. Drivers
- 3.4.2. Restraints
- 3.4.3. Opportunities
- 3.5. Patent Landscape
CHAPTER 4: E-WASTE DISPOSAL MARKET, BY MATERIAL
- 4.1. Overview
- 4.1.1. Market size and forecast
- 4.2. Metal
- 4.2.1. Key market trends, growth factors and opportunities
- 4.2.2. Market size and forecast, by region
- 4.2.3. Market share analysis by country
- 4.3. Plastic
- 4.3.1. Key market trends, growth factors and opportunities
- 4.3.2. Market size and forecast, by region
- 4.3.3. Market share analysis by country
- 4.4. Glass
- 4.4.1. Key market trends, growth factors and opportunities
- 4.4.2. Market size and forecast, by region
- 4.4.3. Market share analysis by country
- 4.5. Others
- 4.5.1. Key market trends, growth factors and opportunities
- 4.5.2. Market size and forecast, by region
- 4.5.3. Market share analysis by country
CHAPTER 5: E-WASTE DISPOSAL MARKET, BY SOURCE
- 5.1. Overview
- 5.1.1. Market size and forecast
- 5.2. Household Appliances
- 5.2.1. Key market trends, growth factors and opportunities
- 5.2.2. Market size and forecast, by region
- 5.2.3. Market share analysis by country
- 5.3. IT and Telecommunication
- 5.3.1. Key market trends, growth factors and opportunities
- 5.3.2. Market size and forecast, by region
- 5.3.3. Market share analysis by country
- 5.4. Consumer Electronics
- 5.4.1. Key market trends, growth factors and opportunities
- 5.4.2. Market size and forecast, by region
- 5.4.3. Market share analysis by country
- 5.5. Others
- 5.5.1. Key market trends, growth factors and opportunities
- 5.5.2. Market size and forecast, by region
- 5.5.3. Market share analysis by country
CHAPTER 6: E-WASTE DISPOSAL MARKET, BY REGION
- 6.1. Overview
- 6.1.1. Market size and forecast By Region
- 6.2. North America
- 6.2.1. Key market trends, growth factors and opportunities
- 6.2.2. Market size and forecast, by Material
- 6.2.3. Market size and forecast, by Source
- 6.2.4. Market size and forecast, by country
- 6.2.4.1. U.S.
- 6.2.4.1.1. Market size and forecast, by Material
- 6.2.4.1.2. Market size and forecast, by Source
- 6.2.4.2. Canada
- 6.2.4.2.1. Market size and forecast, by Material
- 6.2.4.2.2. Market size and forecast, by Source
- 6.2.4.3. Mexico
- 6.2.4.3.1. Market size and forecast, by Material
- 6.2.4.3.2. Market size and forecast, by Source
- 6.3. Europe
- 6.3.1. Key market trends, growth factors and opportunities
- 6.3.2. Market size and forecast, by Material
- 6.3.3. Market size and forecast, by Source
- 6.3.4. Market size and forecast, by country
- 6.3.4.1. Germany
- 6.3.4.1.1. Market size and forecast, by Material
- 6.3.4.1.2. Market size and forecast, by Source
- 6.3.4.2. France
- 6.3.4.2.1. Market size and forecast, by Material
- 6.3.4.2.2. Market size and forecast, by Source
- 6.3.4.3. Italy
- 6.3.4.3.1. Market size and forecast, by Material
- 6.3.4.3.2. Market size and forecast, by Source
- 6.3.4.4. UK
- 6.3.4.4.1. Market size and forecast, by Material
- 6.3.4.4.2. Market size and forecast, by Source
- 6.3.4.5. Spain
- 6.3.4.5.1. Market size and forecast, by Material
- 6.3.4.5.2. Market size and forecast, by Source
- 6.3.4.6. Rest of Europe
- 6.3.4.6.1. Market size and forecast, by Material
- 6.3.4.6.2. Market size and forecast, by Source
- 6.4. Asia-Pacific
- 6.4.1. Key market trends, growth factors and opportunities
- 6.4.2. Market size and forecast, by Material
- 6.4.3. Market size and forecast, by Source
- 6.4.4. Market size and forecast, by country
- 6.4.4.1. China
- 6.4.4.1.1. Market size and forecast, by Material
- 6.4.4.1.2. Market size and forecast, by Source
- 6.4.4.2. Japan
- 6.4.4.2.1. Market size and forecast, by Material
- 6.4.4.2.2. Market size and forecast, by Source
- 6.4.4.3. India
- 6.4.4.3.1. Market size and forecast, by Material
- 6.4.4.3.2. Market size and forecast, by Source
- 6.4.4.4. Australia
- 6.4.4.4.1. Market size and forecast, by Material
- 6.4.4.4.2. Market size and forecast, by Source
- 6.4.4.5. South Korea
- 6.4.4.5.1. Market size and forecast, by Material
- 6.4.4.5.2. Market size and forecast, by Source
- 6.4.4.6. Rest of Asia-Pacific
- 6.4.4.6.1. Market size and forecast, by Material
- 6.4.4.6.2. Market size and forecast, by Source
- 6.5. Latin America
- 6.5.1. Key market trends, growth factors and opportunities
- 6.5.2. Market size and forecast, by Material
- 6.5.3. Market size and forecast, by Source
- 6.5.4. Market size and forecast, by country
- 6.5.4.1. Brazil
- 6.5.4.1.1. Market size and forecast, by Material
- 6.5.4.1.2. Market size and forecast, by Source
- 6.5.4.2. Argentina
- 6.5.4.2.1. Market size and forecast, by Material
- 6.5.4.2.2. Market size and forecast, by Source
- 6.5.4.3. Rest of Latin America
- 6.5.4.3.1. Market size and forecast, by Material
- 6.5.4.3.2. Market size and forecast, by Source
- 6.6. Middle East and Africa
- 6.6.1. Key market trends, growth factors and opportunities
- 6.6.2. Market size and forecast, by Material
- 6.6.3. Market size and forecast, by Source
- 6.6.4. Market size and forecast, by country
- 6.6.4.1. Saudi Arabia
- 6.6.4.1.1. Market size and forecast, by Material
- 6.6.4.1.2. Market size and forecast, by Source
- 6.6.4.2. South Africa
- 6.6.4.2.1. Market size and forecast, by Material
- 6.6.4.2.2. Market size and forecast, by Source
- 6.6.4.3. Rest of Middle East And Africa
- 6.6.4.3.1. Market size and forecast, by Material
- 6.6.4.3.2. Market size and forecast, by Source
CHAPTER 7: COMPETITIVE LANDSCAPE
- 7.1. Introduction
- 7.2. Top winning strategies
- 7.3. Product mapping of top 10 player
- 7.4. Competitive dashboard
- 7.5. Competitive heatmap
- 7.6. Top player positioning, 2023
CHAPTER 8: COMPANY PROFILES
- 8.1. Desco Electronic Recyclers
- 8.1.1. Company overview
- 8.1.2. Key executives
- 8.1.3. Company snapshot
- 8.1.4. Operating business segments
- 8.1.5. Product portfolio
- 8.1.6. Business performance
- 8.1.7. Key strategic moves and developments
- 8.2. AURUBIS AG
- 8.2.1. Company overview
- 8.2.2. Key executives
- 8.2.3. Company snapshot
- 8.2.4. Operating business segments
- 8.2.5. Product portfolio
- 8.2.6. Business performance
- 8.2.7. Key strategic moves and developments
- 8.3. Boliden Group
- 8.3.1. Company overview
- 8.3.2. Key executives
- 8.3.3. Company snapshot
- 8.3.4. Operating business segments
- 8.3.5. Product portfolio
- 8.3.6. Business performance
- 8.3.7. Key strategic moves and developments
- 8.4. MBA Polymers Inc
- 8.4.1. Company overview
- 8.4.2. Key executives
- 8.4.3. Company snapshot
- 8.4.4. Operating business segments
- 8.4.5. Product portfolio
- 8.4.6. Business performance
- 8.4.7. Key strategic moves and developments
- 8.5. ERI
- 8.5.1. Company overview
- 8.5.2. Key executives
- 8.5.3. Company snapshot
- 8.5.4. Operating business segments
- 8.5.5. Product portfolio
- 8.5.6. Business performance
- 8.5.7. Key strategic moves and developments
- 8.6. Sims Limited
- 8.6.1. Company overview
- 8.6.2. Key executives
- 8.6.3. Company snapshot
- 8.6.4. Operating business segments
- 8.6.5. Product portfolio
- 8.6.6. Business performance
- 8.6.7. Key strategic moves and developments
- 8.7. Umicore
- 8.7.1. Company overview
- 8.7.2. Key executives
- 8.7.3. Company snapshot
- 8.7.4. Operating business segments
- 8.7.5. Product portfolio
- 8.7.6. Business performance
- 8.7.7. Key strategic moves and developments
- 8.8. Stena Metall AB
- 8.8.1. Company overview
- 8.8.2. Key executives
- 8.8.3. Company snapshot
- 8.8.4. Operating business segments
- 8.8.5. Product portfolio
- 8.8.6. Business performance
- 8.8.7. Key strategic moves and developments
- 8.9. Tetronics Environmental Technology Company
- 8.9.1. Company overview
- 8.9.2. Key executives
- 8.9.3. Company snapshot
- 8.9.4. Operating business segments
- 8.9.5. Product portfolio
- 8.9.6. Business performance
- 8.9.7. Key strategic moves and developments
- 8.10. MRI Technologies
- 8.10.1. Company overview
- 8.10.2. Key executives
- 8.10.3. Company snapshot
- 8.10.4. Operating business segments
- 8.10.5. Product portfolio
- 8.10.6. Business performance
- 8.10.7. Key strategic moves and developments
