
|
市場調査レポート
商品コード
1472370
頭蓋顔面インプラントの世界市場:材料別、製品タイプ別、エンドユーザー別:機会分析と産業予測(2023年~2032年)Craniofacial Implants Market By Material (Metal, Polymers, Other), By Product Type (Plate, Mesh, Paste, Screws), By End User (Hospitals, Plastic Surgery Clinics, Ambulatory Surgical Centers): Global Opportunity Analysis and Industry Forecast, 2023-2032 |
||||||
|
|||||||

| 頭蓋顔面インプラントの世界市場:材料別、製品タイプ別、エンドユーザー別:機会分析と産業予測(2023年~2032年) |
|
出版日: 2024年03月01日
発行: Allied Market Research
ページ情報: 英文 280 Pages
納期: 2~3営業日
|

- 全表示
- 概要
- 図表
- 目次
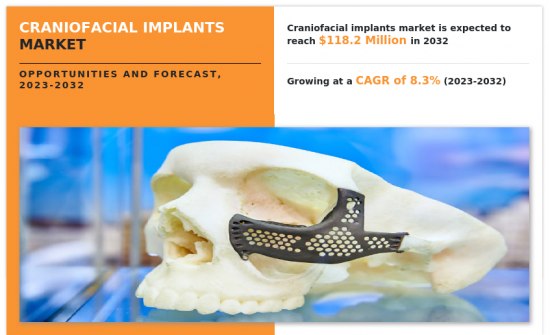
世界の頭蓋顔面インプラントの市場規模は、2022年に5,340万米ドルに達し、2023年~2032年にCAGR8.3%で成長し、2032年には1億1,820万米ドルに達すると予測されています。 頭蓋顔面インプラントは、特に頭蓋顔面に大きな外傷や先天性欠損がある場合に、顔面構造の外観と機能を回復するために使用される特殊な補綴装置です。
これらのインプラントは、手術によって頭蓋骨や顔面骨に埋め込まれ、欠損または損傷した組織を補い、顔面を支え、左右対称にします。チタンやシリコンのような生体適合性のある材料で作られており、周囲の骨や軟部組織とよくなじみ、拒絶反応や合併症のリスクを最小限に抑えます。頭蓋顔面インプラントは、様々な顔の輪郭や審美的なニーズに対応できるよう、様々な形やサイズがあります。インプラントの外科手術には、最適な結果と自然な仕上がりを確実にするために、正確なプランニングと埋入技術が必要です。
頭蓋顔面インプラント市場の成長は、外傷や事故の発生率の増加、および新しい高度なインプラントを開発するための技術進歩に起因しています。自動車事故から転倒に至るまで、外傷はしばしば深刻な頭蓋顔面変形を引き起こし、再建手術が必要となります。例えば、道路交通高速道路省(インド)によると、2022年に州および連邦直轄領(UT)から報告された交通事故は合計46万1,312件でした。このような不幸な事故は、骨折、脱臼、組織損傷などを伴う重篤な頭蓋顔面損傷につながり、しばしば再建手術が必要となります。頭蓋顔面インプラントは、このような場合に不可欠なソリューションとして登場し、患部の機能性と審美性の両方を回復する手段を提供します。頭蓋顔面インプラントは、チタンプレートからカスタムメイドの補綴物に至るまで、骨折した骨を安定させ、組織の再生をサポートし、顔面の特徴を再建する上で重要な役割を果たします。したがって、外傷や事故の発生率の増加が市場の成長を促進すると予想されます。
インプラント技術の進歩は、頭蓋顔面インプラント市場の成長を促進すると予想されます。この市場成長の主な促進要因のひとつは、先端材料と製造技術の開発です。チタン合金や生体適合性セラミックなどの新材料は、強度、耐久性、人体との適合性を向上させ、従来の材料に伴う拒絶反応や合併症のリスクを低減します。
さらに、3Dプリンティング技術の進歩により、各患者固有の解剖学的構造に合わせた高度にカスタマイズされたインプラントの作製が可能になり、より優れた機能的・審美的な結果が得られるようになりました。2023年4月、3D Systems, Inc.は、ザルツブルグ大学病院(オーストリア)が、同社独自のポイント・オブ・ケア積層造形技術のポートフォリオを応用し、個々の患者のニーズに合わせたカスタムデバイスとして、初の3DプリントPEEK製頭蓋顔面インプラントの設計と製造に成功したと発表しました。しかし、頭蓋顔面インプラントのコストが高いことが市場の成長を抑制しています。頭蓋顔面手術は複雑なため、高度な材料と精密な製造技術を使用する必要があり、製造コストを押し上げています。さらに、外科医が頭蓋顔面再建に熟達するために必要な専門知識は、専門的な訓練や技能により高い費用が必要なため、全体的な費用の一因となっています。したがって、頭蓋顔面インプラントの高コストは、頭蓋顔面インプラントの普及に悪影響を及ぼし、市場の成長を抑制すると予想されます。
利害関係者にとっての主な利点
- 当レポートでは、2022年~2032年の頭蓋顔面インプラント市場分析の市場セグメント、現在の動向、推定、力学の定量分析を提供し、一般的な頭蓋顔面インプラント市場機会を特定します。
- 市場促進要因、市場抑制要因、市場機会に関連する情報とともに市場調査を提供します。
- ポーターのファイブフォース分析では、利害関係者が利益重視のビジネス決定を下し、サプライヤーとバイヤーのネットワークを強化できるように、バイヤーとサプライヤーの潜在力を強調します。
- 頭蓋顔面インプラント市場セグメンテーションの詳細な分析により、市場機会を決定することができます。
- 各地域の主要国は、世界市場への収益貢献度に応じてマッピングされています。
- 市場企業のポジショニングは、ベンチマーキングを容易にし、市場企業の現在のポジションの明確な理解を提供します。
- 本レポートには、地域および世界の頭蓋顔面インプラント市場動向、主要企業、市場セグメント、応用分野、市場成長戦略の分析が含まれています。
本レポートで可能なレポートカスタマイズ(追加費用とタイムラインに関しましては販売担当へご連絡ください)
- 製品ベンチマーク/製品仕様と用途
- 規制ガイドライン
- クライアントの関心に応じた企業プロファイルの追加
- 国別または地域別の追加分析:市場規模と予測
- 企業プロファイルの拡張リスト
- 過去の市場データ
- 主要企業の詳細(所在地、連絡先、サプライヤー/ベンダーネットワークなどを含む、エクセル形式)
目次
第1章 イントロダクション
第2章 エグゼクティブサマリー
第3章 市場概要
- 市場の定義と範囲
- 主な調査結果
- 影響要因
- 主な投資機会
- ポーターのファイブフォース分析
- 市場力学
- 促進要因
- 抑制要因
- 機会
第4章 頭蓋顔面インプラント市場:材料別
- 概要
- 金属
- ポリマー
- その他
第5章 頭蓋顔面インプラント市場:製品タイプ別
- 概要
- プレート
- メッシュ
- ペースト
- スクリュー
第6章 頭蓋顔面インプラント市場:エンドユーザー別
- 概要
- 病院
- 形成外科クリニック
- 外来手術センター
第7章 頭蓋顔面インプラント市場:地域別
- 概要
- 北米
- 米国
- カナダ
- メキシコ
- 欧州
- ドイツ
- フランス
- 英国
- イタリア
- スペイン
- その他
- アジア太平洋
- 日本
- 中国
- インド
- オーストラリア
- 韓国
- その他
- ラテンアメリカ
- ブラジル
- コロンビア
- アルゼンチン
- その他のラテンアメリカ
- 中東・アフリカ
- GCC諸国
- 南アフリカ
- 北アフリカ
- その他
第8章 競合情勢
- イントロダクション
- 主要成功戦略
- 主要10社の製品マッピング
- 競合ダッシュボード
- 競合ヒートマップ
- 主要企業のポジショニング(2022年)
第9章 企業プロファイル
- Zimmer Biomet Holding, Inc.
- Stryker Corporation.
- Johnson and Johnson(DePuy Synthes)
- Medtronic
- KLS Martin Group
- Anatomics Pty Ltd
- Bioplate Inc.
- Integra LifeSciences Holdings Corporation
- B. Braun SE
- OssDsign AB
LIST OF TABLES
- TABLE 01. GLOBAL CRANIOFACIAL IMPLANTS MARKET, BY MATERIAL, 2022-2032 ($MILLION)
- TABLE 02. CRANIOFACIAL IMPLANTS MARKET FOR METAL, BY REGION, 2022-2032 ($MILLION)
- TABLE 03. CRANIOFACIAL IMPLANTS MARKET FOR POLYMERS, BY REGION, 2022-2032 ($MILLION)
- TABLE 04. CRANIOFACIAL IMPLANTS MARKET FOR OTHER, BY REGION, 2022-2032 ($MILLION)
- TABLE 05. GLOBAL CRANIOFACIAL IMPLANTS MARKET, BY PRODUCT TYPE, 2022-2032 ($MILLION)
- TABLE 06. CRANIOFACIAL IMPLANTS MARKET FOR PLATE, BY REGION, 2022-2032 ($MILLION)
- TABLE 07. CRANIOFACIAL IMPLANTS MARKET FOR MESH, BY REGION, 2022-2032 ($MILLION)
- TABLE 08. CRANIOFACIAL IMPLANTS MARKET FOR PASTE, BY REGION, 2022-2032 ($MILLION)
- TABLE 09. CRANIOFACIAL IMPLANTS MARKET FOR SCREWS, BY REGION, 2022-2032 ($MILLION)
- TABLE 10. GLOBAL CRANIOFACIAL IMPLANTS MARKET, BY END USER, 2022-2032 ($MILLION)
- TABLE 11. CRANIOFACIAL IMPLANTS MARKET FOR HOSPITALS, BY REGION, 2022-2032 ($MILLION)
- TABLE 12. CRANIOFACIAL IMPLANTS MARKET FOR PLASTIC SURGERY CLINICS, BY REGION, 2022-2032 ($MILLION)
- TABLE 13. CRANIOFACIAL IMPLANTS MARKET FOR AMBULATORY SURGICAL CENTERS, BY REGION, 2022-2032 ($MILLION)
- TABLE 14. CRANIOFACIAL IMPLANTS MARKET, BY REGION, 2022-2032 ($MILLION)
- TABLE 15. NORTH AMERICA CRANIOFACIAL IMPLANTS MARKET, BY MATERIAL, 2022-2032 ($MILLION)
- TABLE 16. NORTH AMERICA CRANIOFACIAL IMPLANTS MARKET, BY PRODUCT TYPE, 2022-2032 ($MILLION)
- TABLE 17. NORTH AMERICA CRANIOFACIAL IMPLANTS MARKET, BY END USER, 2022-2032 ($MILLION)
- TABLE 18. NORTH AMERICA CRANIOFACIAL IMPLANTS MARKET, BY COUNTRY, 2022-2032 ($MILLION)
- TABLE 19. U.S. CRANIOFACIAL IMPLANTS MARKET, BY MATERIAL, 2022-2032 ($MILLION)
- TABLE 20. U.S. CRANIOFACIAL IMPLANTS MARKET, BY PRODUCT TYPE, 2022-2032 ($MILLION)
- TABLE 21. U.S. CRANIOFACIAL IMPLANTS MARKET, BY END USER, 2022-2032 ($MILLION)
- TABLE 22. CANADA CRANIOFACIAL IMPLANTS MARKET, BY MATERIAL, 2022-2032 ($MILLION)
- TABLE 23. CANADA CRANIOFACIAL IMPLANTS MARKET, BY PRODUCT TYPE, 2022-2032 ($MILLION)
- TABLE 24. CANADA CRANIOFACIAL IMPLANTS MARKET, BY END USER, 2022-2032 ($MILLION)
- TABLE 25. MEXICO CRANIOFACIAL IMPLANTS MARKET, BY MATERIAL, 2022-2032 ($MILLION)
- TABLE 26. MEXICO CRANIOFACIAL IMPLANTS MARKET, BY PRODUCT TYPE, 2022-2032 ($MILLION)
- TABLE 27. MEXICO CRANIOFACIAL IMPLANTS MARKET, BY END USER, 2022-2032 ($MILLION)
- TABLE 28. EUROPE CRANIOFACIAL IMPLANTS MARKET, BY MATERIAL, 2022-2032 ($MILLION)
- TABLE 29. EUROPE CRANIOFACIAL IMPLANTS MARKET, BY PRODUCT TYPE, 2022-2032 ($MILLION)
- TABLE 30. EUROPE CRANIOFACIAL IMPLANTS MARKET, BY END USER, 2022-2032 ($MILLION)
- TABLE 31. EUROPE CRANIOFACIAL IMPLANTS MARKET, BY COUNTRY, 2022-2032 ($MILLION)
- TABLE 32. GERMANY CRANIOFACIAL IMPLANTS MARKET, BY MATERIAL, 2022-2032 ($MILLION)
- TABLE 33. GERMANY CRANIOFACIAL IMPLANTS MARKET, BY PRODUCT TYPE, 2022-2032 ($MILLION)
- TABLE 34. GERMANY CRANIOFACIAL IMPLANTS MARKET, BY END USER, 2022-2032 ($MILLION)
- TABLE 35. FRANCE CRANIOFACIAL IMPLANTS MARKET, BY MATERIAL, 2022-2032 ($MILLION)
- TABLE 36. FRANCE CRANIOFACIAL IMPLANTS MARKET, BY PRODUCT TYPE, 2022-2032 ($MILLION)
- TABLE 37. FRANCE CRANIOFACIAL IMPLANTS MARKET, BY END USER, 2022-2032 ($MILLION)
- TABLE 38. UK CRANIOFACIAL IMPLANTS MARKET, BY MATERIAL, 2022-2032 ($MILLION)
- TABLE 39. UK CRANIOFACIAL IMPLANTS MARKET, BY PRODUCT TYPE, 2022-2032 ($MILLION)
- TABLE 40. UK CRANIOFACIAL IMPLANTS MARKET, BY END USER, 2022-2032 ($MILLION)
- TABLE 41. ITALY CRANIOFACIAL IMPLANTS MARKET, BY MATERIAL, 2022-2032 ($MILLION)
- TABLE 42. ITALY CRANIOFACIAL IMPLANTS MARKET, BY PRODUCT TYPE, 2022-2032 ($MILLION)
- TABLE 43. ITALY CRANIOFACIAL IMPLANTS MARKET, BY END USER, 2022-2032 ($MILLION)
- TABLE 44. SPAIN CRANIOFACIAL IMPLANTS MARKET, BY MATERIAL, 2022-2032 ($MILLION)
- TABLE 45. SPAIN CRANIOFACIAL IMPLANTS MARKET, BY PRODUCT TYPE, 2022-2032 ($MILLION)
- TABLE 46. SPAIN CRANIOFACIAL IMPLANTS MARKET, BY END USER, 2022-2032 ($MILLION)
- TABLE 47. REST OF EUROPE CRANIOFACIAL IMPLANTS MARKET, BY MATERIAL, 2022-2032 ($MILLION)
- TABLE 48. REST OF EUROPE CRANIOFACIAL IMPLANTS MARKET, BY PRODUCT TYPE, 2022-2032 ($MILLION)
- TABLE 49. REST OF EUROPE CRANIOFACIAL IMPLANTS MARKET, BY END USER, 2022-2032 ($MILLION)
- TABLE 50. ASIA-PACIFIC CRANIOFACIAL IMPLANTS MARKET, BY MATERIAL, 2022-2032 ($MILLION)
- TABLE 51. ASIA-PACIFIC CRANIOFACIAL IMPLANTS MARKET, BY PRODUCT TYPE, 2022-2032 ($MILLION)
- TABLE 52. ASIA-PACIFIC CRANIOFACIAL IMPLANTS MARKET, BY END USER, 2022-2032 ($MILLION)
- TABLE 53. ASIA-PACIFIC CRANIOFACIAL IMPLANTS MARKET, BY COUNTRY, 2022-2032 ($MILLION)
- TABLE 54. JAPAN CRANIOFACIAL IMPLANTS MARKET, BY MATERIAL, 2022-2032 ($MILLION)
- TABLE 55. JAPAN CRANIOFACIAL IMPLANTS MARKET, BY PRODUCT TYPE, 2022-2032 ($MILLION)
- TABLE 56. JAPAN CRANIOFACIAL IMPLANTS MARKET, BY END USER, 2022-2032 ($MILLION)
- TABLE 57. CHINA CRANIOFACIAL IMPLANTS MARKET, BY MATERIAL, 2022-2032 ($MILLION)
- TABLE 58. CHINA CRANIOFACIAL IMPLANTS MARKET, BY PRODUCT TYPE, 2022-2032 ($MILLION)
- TABLE 59. CHINA CRANIOFACIAL IMPLANTS MARKET, BY END USER, 2022-2032 ($MILLION)
- TABLE 60. INDIA CRANIOFACIAL IMPLANTS MARKET, BY MATERIAL, 2022-2032 ($MILLION)
- TABLE 61. INDIA CRANIOFACIAL IMPLANTS MARKET, BY PRODUCT TYPE, 2022-2032 ($MILLION)
- TABLE 62. INDIA CRANIOFACIAL IMPLANTS MARKET, BY END USER, 2022-2032 ($MILLION)
- TABLE 63. AUSTRALIA CRANIOFACIAL IMPLANTS MARKET, BY MATERIAL, 2022-2032 ($MILLION)
- TABLE 64. AUSTRALIA CRANIOFACIAL IMPLANTS MARKET, BY PRODUCT TYPE, 2022-2032 ($MILLION)
- TABLE 65. AUSTRALIA CRANIOFACIAL IMPLANTS MARKET, BY END USER, 2022-2032 ($MILLION)
- TABLE 66. SOUTH KOREA CRANIOFACIAL IMPLANTS MARKET, BY MATERIAL, 2022-2032 ($MILLION)
- TABLE 67. SOUTH KOREA CRANIOFACIAL IMPLANTS MARKET, BY PRODUCT TYPE, 2022-2032 ($MILLION)
- TABLE 68. SOUTH KOREA CRANIOFACIAL IMPLANTS MARKET, BY END USER, 2022-2032 ($MILLION)
- TABLE 69. REST OF ASIA-PACIFIC CRANIOFACIAL IMPLANTS MARKET, BY MATERIAL, 2022-2032 ($MILLION)
- TABLE 70. REST OF ASIA-PACIFIC CRANIOFACIAL IMPLANTS MARKET, BY PRODUCT TYPE, 2022-2032 ($MILLION)
- TABLE 71. REST OF ASIA-PACIFIC CRANIOFACIAL IMPLANTS MARKET, BY END USER, 2022-2032 ($MILLION)
- TABLE 72. LATIN AMERICA CRANIOFACIAL IMPLANTS MARKET, BY MATERIAL, 2022-2032 ($MILLION)
- TABLE 73. LATIN AMERICA CRANIOFACIAL IMPLANTS MARKET, BY PRODUCT TYPE, 2022-2032 ($MILLION)
- TABLE 74. LATIN AMERICA CRANIOFACIAL IMPLANTS MARKET, BY END USER, 2022-2032 ($MILLION)
- TABLE 75. LATIN AMERICA CRANIOFACIAL IMPLANTS MARKET, BY COUNTRY, 2022-2032 ($MILLION)
- TABLE 76. BRAZIL CRANIOFACIAL IMPLANTS MARKET, BY MATERIAL, 2022-2032 ($MILLION)
- TABLE 77. BRAZIL CRANIOFACIAL IMPLANTS MARKET, BY PRODUCT TYPE, 2022-2032 ($MILLION)
- TABLE 78. BRAZIL CRANIOFACIAL IMPLANTS MARKET, BY END USER, 2022-2032 ($MILLION)
- TABLE 79. COLOMBIA CRANIOFACIAL IMPLANTS MARKET, BY MATERIAL, 2022-2032 ($MILLION)
- TABLE 80. COLOMBIA CRANIOFACIAL IMPLANTS MARKET, BY PRODUCT TYPE, 2022-2032 ($MILLION)
- TABLE 81. COLOMBIA CRANIOFACIAL IMPLANTS MARKET, BY END USER, 2022-2032 ($MILLION)
- TABLE 82. ARGENTINA CRANIOFACIAL IMPLANTS MARKET, BY MATERIAL, 2022-2032 ($MILLION)
- TABLE 83. ARGENTINA CRANIOFACIAL IMPLANTS MARKET, BY PRODUCT TYPE, 2022-2032 ($MILLION)
- TABLE 84. ARGENTINA CRANIOFACIAL IMPLANTS MARKET, BY END USER, 2022-2032 ($MILLION)
- TABLE 85. REST OF LA CRANIOFACIAL IMPLANTS MARKET, BY MATERIAL, 2022-2032 ($MILLION)
- TABLE 86. REST OF LA CRANIOFACIAL IMPLANTS MARKET, BY PRODUCT TYPE, 2022-2032 ($MILLION)
- TABLE 87. REST OF LA CRANIOFACIAL IMPLANTS MARKET, BY END USER, 2022-2032 ($MILLION)
- TABLE 88. MIDDLE EAST AND AFRICA CRANIOFACIAL IMPLANTS MARKET, BY MATERIAL, 2022-2032 ($MILLION)
- TABLE 89. MIDDLE EAST AND AFRICA CRANIOFACIAL IMPLANTS MARKET, BY PRODUCT TYPE, 2022-2032 ($MILLION)
- TABLE 90. MIDDLE EAST AND AFRICA CRANIOFACIAL IMPLANTS MARKET, BY END USER, 2022-2032 ($MILLION)
- TABLE 91. MIDDLE EAST AND AFRICA CRANIOFACIAL IMPLANTS MARKET, BY COUNTRY, 2022-2032 ($MILLION)
- TABLE 92. GCC CRANIOFACIAL IMPLANTS MARKET, BY MATERIAL, 2022-2032 ($MILLION)
- TABLE 93. GCC CRANIOFACIAL IMPLANTS MARKET, BY PRODUCT TYPE, 2022-2032 ($MILLION)
- TABLE 94. GCC CRANIOFACIAL IMPLANTS MARKET, BY END USER, 2022-2032 ($MILLION)
- TABLE 95. SOUTH AFRICA CRANIOFACIAL IMPLANTS MARKET, BY MATERIAL, 2022-2032 ($MILLION)
- TABLE 96. SOUTH AFRICA CRANIOFACIAL IMPLANTS MARKET, BY PRODUCT TYPE, 2022-2032 ($MILLION)
- TABLE 97. SOUTH AFRICA CRANIOFACIAL IMPLANTS MARKET, BY END USER, 2022-2032 ($MILLION)
- TABLE 98. NORTH AFRICA CRANIOFACIAL IMPLANTS MARKET, BY MATERIAL, 2022-2032 ($MILLION)
- TABLE 99. NORTH AFRICA CRANIOFACIAL IMPLANTS MARKET, BY PRODUCT TYPE, 2022-2032 ($MILLION)
- TABLE 100. NORTH AFRICA CRANIOFACIAL IMPLANTS MARKET, BY END USER, 2022-2032 ($MILLION)
- TABLE 101. REST OF MEA CRANIOFACIAL IMPLANTS MARKET, BY MATERIAL, 2022-2032 ($MILLION)
- TABLE 102. REST OF MEA CRANIOFACIAL IMPLANTS MARKET, BY PRODUCT TYPE, 2022-2032 ($MILLION)
- TABLE 103. REST OF MEA CRANIOFACIAL IMPLANTS MARKET, BY END USER, 2022-2032 ($MILLION)
- TABLE 104. ZIMMER BIOMET HOLDING, INC.: KEY EXECUTIVES
- TABLE 105. ZIMMER BIOMET HOLDING, INC.: COMPANY SNAPSHOT
- TABLE 106. ZIMMER BIOMET HOLDING, INC.: PRODUCT SEGMENTS
- TABLE 107. ZIMMER BIOMET HOLDING, INC.: SERVICE SEGMENTS
- TABLE 108. ZIMMER BIOMET HOLDING, INC.: PRODUCT PORTFOLIO
- TABLE 109. ZIMMER BIOMET HOLDING, INC.: KEY STRATERGIES
- TABLE 110. STRYKER CORPORATION.: KEY EXECUTIVES
- TABLE 111. STRYKER CORPORATION.: COMPANY SNAPSHOT
- TABLE 112. STRYKER CORPORATION.: PRODUCT SEGMENTS
- TABLE 113. STRYKER CORPORATION.: SERVICE SEGMENTS
- TABLE 114. STRYKER CORPORATION.: PRODUCT PORTFOLIO
- TABLE 115. STRYKER CORPORATION.: KEY STRATERGIES
- TABLE 116. JOHNSON AND JOHNSON (DEPUY SYNTHES): KEY EXECUTIVES
- TABLE 117. JOHNSON AND JOHNSON (DEPUY SYNTHES): COMPANY SNAPSHOT
- TABLE 118. JOHNSON AND JOHNSON (DEPUY SYNTHES): PRODUCT SEGMENTS
- TABLE 119. JOHNSON AND JOHNSON (DEPUY SYNTHES): SERVICE SEGMENTS
- TABLE 120. JOHNSON AND JOHNSON (DEPUY SYNTHES): PRODUCT PORTFOLIO
- TABLE 121. JOHNSON AND JOHNSON (DEPUY SYNTHES): KEY STRATERGIES
- TABLE 122. MEDTRONIC: KEY EXECUTIVES
- TABLE 123. MEDTRONIC: COMPANY SNAPSHOT
- TABLE 124. MEDTRONIC: PRODUCT SEGMENTS
- TABLE 125. MEDTRONIC: SERVICE SEGMENTS
- TABLE 126. MEDTRONIC: PRODUCT PORTFOLIO
- TABLE 127. MEDTRONIC: KEY STRATERGIES
- TABLE 128. KLS MARTIN GROUP: KEY EXECUTIVES
- TABLE 129. KLS MARTIN GROUP: COMPANY SNAPSHOT
- TABLE 130. KLS MARTIN GROUP: PRODUCT SEGMENTS
- TABLE 131. KLS MARTIN GROUP: SERVICE SEGMENTS
- TABLE 132. KLS MARTIN GROUP: PRODUCT PORTFOLIO
- TABLE 133. KLS MARTIN GROUP: KEY STRATERGIES
- TABLE 134. ANATOMICS PTY LTD: KEY EXECUTIVES
- TABLE 135. ANATOMICS PTY LTD: COMPANY SNAPSHOT
- TABLE 136. ANATOMICS PTY LTD: PRODUCT SEGMENTS
- TABLE 137. ANATOMICS PTY LTD: SERVICE SEGMENTS
- TABLE 138. ANATOMICS PTY LTD: PRODUCT PORTFOLIO
- TABLE 139. ANATOMICS PTY LTD: KEY STRATERGIES
- TABLE 140. BIOPLATE INC.: KEY EXECUTIVES
- TABLE 141. BIOPLATE INC.: COMPANY SNAPSHOT
- TABLE 142. BIOPLATE INC.: PRODUCT SEGMENTS
- TABLE 143. BIOPLATE INC.: SERVICE SEGMENTS
- TABLE 144. BIOPLATE INC.: PRODUCT PORTFOLIO
- TABLE 145. BIOPLATE INC.: KEY STRATERGIES
- TABLE 146. INTEGRA LIFESCIENCES HOLDINGS CORPORATION: KEY EXECUTIVES
- TABLE 147. INTEGRA LIFESCIENCES HOLDINGS CORPORATION: COMPANY SNAPSHOT
- TABLE 148. INTEGRA LIFESCIENCES HOLDINGS CORPORATION: PRODUCT SEGMENTS
- TABLE 149. INTEGRA LIFESCIENCES HOLDINGS CORPORATION: SERVICE SEGMENTS
- TABLE 150. INTEGRA LIFESCIENCES HOLDINGS CORPORATION: PRODUCT PORTFOLIO
- TABLE 151. INTEGRA LIFESCIENCES HOLDINGS CORPORATION: KEY STRATERGIES
- TABLE 152. B. BRAUN SE: KEY EXECUTIVES
- TABLE 153. B. BRAUN SE: COMPANY SNAPSHOT
- TABLE 154. B. BRAUN SE: PRODUCT SEGMENTS
- TABLE 155. B. BRAUN SE: SERVICE SEGMENTS
- TABLE 156. B. BRAUN SE: PRODUCT PORTFOLIO
- TABLE 157. B. BRAUN SE: KEY STRATERGIES
- TABLE 158. OSSDSIGN AB: KEY EXECUTIVES
- TABLE 159. OSSDSIGN AB: COMPANY SNAPSHOT
- TABLE 160. OSSDSIGN AB: PRODUCT SEGMENTS
- TABLE 161. OSSDSIGN AB: SERVICE SEGMENTS
- TABLE 162. OSSDSIGN AB: PRODUCT PORTFOLIO
- TABLE 163. OSSDSIGN AB: KEY STRATERGIES
LIST OF FIGURES
- FIGURE 01. CRANIOFACIAL IMPLANTS MARKET, 2022-2032
- FIGURE 02. SEGMENTATION OF CRANIOFACIAL IMPLANTS MARKET,2022-2032
- FIGURE 03. TOP IMPACTING FACTORS IN CRANIOFACIAL IMPLANTS MARKET
- FIGURE 04. TOP INVESTMENT POCKETS IN CRANIOFACIAL IMPLANTS MARKET (2023-2032)
- FIGURE 05. BARGAINING POWER OF SUPPLIERS
- FIGURE 06. BARGAINING POWER OF BUYERS
- FIGURE 07. THREAT OF SUBSTITUTION
- FIGURE 08. THREAT OF SUBSTITUTION
- FIGURE 09. COMPETITIVE RIVALRY
- FIGURE 10. GLOBAL CRANIOFACIAL IMPLANTS MARKET:DRIVERS, RESTRAINTS AND OPPORTUNITIES
- FIGURE 11. CRANIOFACIAL IMPLANTS MARKET, BY MATERIAL, 2022 AND 2032(%)
- FIGURE 12. COMPARATIVE SHARE ANALYSIS OF CRANIOFACIAL IMPLANTS MARKET FOR METAL, BY COUNTRY 2022 AND 2032(%)
- FIGURE 13. COMPARATIVE SHARE ANALYSIS OF CRANIOFACIAL IMPLANTS MARKET FOR POLYMERS, BY COUNTRY 2022 AND 2032(%)
- FIGURE 14. COMPARATIVE SHARE ANALYSIS OF CRANIOFACIAL IMPLANTS MARKET FOR OTHER, BY COUNTRY 2022 AND 2032(%)
- FIGURE 15. CRANIOFACIAL IMPLANTS MARKET, BY PRODUCT TYPE, 2022 AND 2032(%)
- FIGURE 16. COMPARATIVE SHARE ANALYSIS OF CRANIOFACIAL IMPLANTS MARKET FOR PLATE, BY COUNTRY 2022 AND 2032(%)
- FIGURE 17. COMPARATIVE SHARE ANALYSIS OF CRANIOFACIAL IMPLANTS MARKET FOR MESH, BY COUNTRY 2022 AND 2032(%)
- FIGURE 18. COMPARATIVE SHARE ANALYSIS OF CRANIOFACIAL IMPLANTS MARKET FOR PASTE, BY COUNTRY 2022 AND 2032(%)
- FIGURE 19. COMPARATIVE SHARE ANALYSIS OF CRANIOFACIAL IMPLANTS MARKET FOR SCREWS, BY COUNTRY 2022 AND 2032(%)
- FIGURE 20. CRANIOFACIAL IMPLANTS MARKET, BY END USER, 2022 AND 2032(%)
- FIGURE 21. COMPARATIVE SHARE ANALYSIS OF CRANIOFACIAL IMPLANTS MARKET FOR HOSPITALS, BY COUNTRY 2022 AND 2032(%)
- FIGURE 22. COMPARATIVE SHARE ANALYSIS OF CRANIOFACIAL IMPLANTS MARKET FOR PLASTIC SURGERY CLINICS, BY COUNTRY 2022 AND 2032(%)
- FIGURE 23. COMPARATIVE SHARE ANALYSIS OF CRANIOFACIAL IMPLANTS MARKET FOR AMBULATORY SURGICAL CENTERS, BY COUNTRY 2022 AND 2032(%)
- FIGURE 24. CRANIOFACIAL IMPLANTS MARKET BY REGION, 2022 AND 2032(%)
- FIGURE 25. U.S. CRANIOFACIAL IMPLANTS MARKET, 2022-2032 ($MILLION)
- FIGURE 26. CANADA CRANIOFACIAL IMPLANTS MARKET, 2022-2032 ($MILLION)
- FIGURE 27. MEXICO CRANIOFACIAL IMPLANTS MARKET, 2022-2032 ($MILLION)
- FIGURE 28. GERMANY CRANIOFACIAL IMPLANTS MARKET, 2022-2032 ($MILLION)
- FIGURE 29. FRANCE CRANIOFACIAL IMPLANTS MARKET, 2022-2032 ($MILLION)
- FIGURE 30. UK CRANIOFACIAL IMPLANTS MARKET, 2022-2032 ($MILLION)
- FIGURE 31. ITALY CRANIOFACIAL IMPLANTS MARKET, 2022-2032 ($MILLION)
- FIGURE 32. SPAIN CRANIOFACIAL IMPLANTS MARKET, 2022-2032 ($MILLION)
- FIGURE 33. REST OF EUROPE CRANIOFACIAL IMPLANTS MARKET, 2022-2032 ($MILLION)
- FIGURE 34. JAPAN CRANIOFACIAL IMPLANTS MARKET, 2022-2032 ($MILLION)
- FIGURE 35. CHINA CRANIOFACIAL IMPLANTS MARKET, 2022-2032 ($MILLION)
- FIGURE 36. INDIA CRANIOFACIAL IMPLANTS MARKET, 2022-2032 ($MILLION)
- FIGURE 37. AUSTRALIA CRANIOFACIAL IMPLANTS MARKET, 2022-2032 ($MILLION)
- FIGURE 38. SOUTH KOREA CRANIOFACIAL IMPLANTS MARKET, 2022-2032 ($MILLION)
- FIGURE 39. REST OF ASIA-PACIFIC CRANIOFACIAL IMPLANTS MARKET, 2022-2032 ($MILLION)
- FIGURE 40. BRAZIL CRANIOFACIAL IMPLANTS MARKET, 2022-2032 ($MILLION)
- FIGURE 41. COLOMBIA CRANIOFACIAL IMPLANTS MARKET, 2022-2032 ($MILLION)
- FIGURE 42. ARGENTINA CRANIOFACIAL IMPLANTS MARKET, 2022-2032 ($MILLION)
- FIGURE 43. REST OF LA CRANIOFACIAL IMPLANTS MARKET, 2022-2032 ($MILLION)
- FIGURE 44. GCC CRANIOFACIAL IMPLANTS MARKET, 2022-2032 ($MILLION)
- FIGURE 45. SOUTH AFRICA CRANIOFACIAL IMPLANTS MARKET, 2022-2032 ($MILLION)
- FIGURE 46. NORTH AFRICA CRANIOFACIAL IMPLANTS MARKET, 2022-2032 ($MILLION)
- FIGURE 47. REST OF MEA CRANIOFACIAL IMPLANTS MARKET, 2022-2032 ($MILLION)
- FIGURE 48. TOP WINNING STRATEGIES, BY YEAR
- FIGURE 49. TOP WINNING STRATEGIES, BY DEVELOPMENT
- FIGURE 50. TOP WINNING STRATEGIES, BY COMPANY
- FIGURE 51. PRODUCT MAPPING OF TOP 10 PLAYERS
- FIGURE 52. COMPETITIVE DASHBOARD
- FIGURE 53. COMPETITIVE HEATMAP: CRANIOFACIAL IMPLANTS MARKET
- FIGURE 54. TOP PLAYER POSITIONING, 2022
The global craniofacial implants market was valued at $53.4 million in 2022 and is projected to reach $118.2 million by 2032, growing at a CAGR of 8.3% from 2023 to 2032. Craniofacial implant is a specialized prosthetic device used to restore the appearance and function of facial structures, particularly in cases where individuals have experienced significant craniofacial trauma or congenital defects. These implants are surgically implanted into the skull or facial bones to replace missing or damaged tissue, providing support and symmetry to the face. They are made from biocompatible materials such as titanium or silicone, which integrate well with the surrounding bone and soft tissues, minimizing the risk of rejection or complications. Craniofacial implants come in various shapes and sizes to accommodate different facial contours and aesthetic needs. The surgical procedure for implantation involves precise planning and placement techniques to ensure optimal outcomes and natural-looking results.
The craniofacial implants market growth is attributed to an increase in incidence of trauma & accidents and technological advancements to develop new advanced implants. Traumatic injuries, ranging from vehicular accidents to falls, often result in severe craniofacial deformities that necessitate reconstructive surgery. For instance, according to Ministry of Road Transport and Highways (India), a total of 461,312 road accidents were reported by States and Union Territories (UTs) in 2022. These unfortunate incidents lead to severe craniofacial injuries, involving fractures, dislocations, and tissue damage, which often necessitate reconstructive surgery. Craniofacial implants emerge as indispensable solutions in such cases, offering a means to restore both functionality and aesthetics to the affected areas. Craniofacial implants, ranging from titanium plates to custom-made prosthetics, play a vital role in stabilizing fractured bones, supporting tissue regeneration and reconstructing facial features. Thus, a rise in the incidence of trauma and accidents are expected to drive the growth of the market.
Technological advancements in implant technology are expected to drive the growth of the craniofacial implants market. One of the key drivers of this market growth is the development of advanced materials and manufacturing techniques. Novel materials such as titanium alloys and biocompatible ceramics offer improved strength, durability, and compatibility with the human body, reducing the risk of rejection and complications associated with traditional materials.
In addition, advancements in 3D printing technology have enabled the fabrication of highly customized implants tailored to each patient's unique anatomy, leading to better functional and aesthetic outcomes. In April 2023, 3D Systems, Inc. announced that University Hospital of Salzburg (Austria) successfully applied the company's unique portfolio of point-of-care additive manufacturing technologies to design and produce its first 3D-printed PEEK cranial implant as a custom device for an individual patient need. However, high cost of craniofacial implants restrains the growth of the market. The intricate nature of craniofacial procedures necessitates the use of advanced materials and precise manufacturing techniques, driving up production costs. In addition, the expertise required for surgeons to be proficient in craniofacial reconstruction further contributes to the overall expense, as specialized training and skills command higher fees. Thus, the high cost of the craniofacial implants is expected to negatively affect widespread adoption of the craniofacial implants, thereby restraining the growth of the market.
The craniofacial implants market is segmented on the basis of material, product type, end user, and region. By material, the market is classified into metal, polymers and others. By product type, the market is divided into plate, mesh, paste and screws. By end user, it is segregated into hospitals, plastic surgery clinics, and ambulatory surgical centers. Region-wise, the market is analyzed across North America (the U.S., Canada, and Mexico), Europe (Germany, France, the UK, Italy, Spain, and rest of Europe), Asia-Pacific (Japan, China, Australia, India, South Korea, and rest of Asia-Pacific), LA (Brazil, Colombia, Argentina, and rest of LA), and MEA (GCC, South Africa, North Africa, and rest of MEA). Major key players that operate in the craniofacial implants market are Zimmer Biomet Holding, Inc, Stryker Corporation, Johnson and Johnson, Medtronic plc, KLS Martin Group, Bioplate Inc., OssDsign AB, Integra LifeSciences Holdings Corporation, B. Braun SE, and Anatomics Pty Ltd. Key players have adopted product launch as a key developmental strategy to improve the product portfolio of the craniofacial implants market
Key Benefits For Stakeholders
- This report provides a quantitative analysis of the market segments, current trends, estimations, and dynamics of the craniofacial implants market analysis from 2022 to 2032 to identify the prevailing craniofacial implants market opportunities.
- The market research is offered along with information related to key drivers, restraints, and opportunities.
- Porter's five forces analysis highlights the potency of buyers and suppliers to enable stakeholders make profit-oriented business decisions and strengthen their supplier-buyer network.
- In-depth analysis of the craniofacial implants market segmentation assists to determine the prevailing market opportunities.
- Major countries in each region are mapped according to their revenue contribution to the global market.
- Market player positioning facilitates benchmarking and provides a clear understanding of the present position of the market players.
- The report includes the analysis of the regional as well as global craniofacial implants market trends, key players, market segments, application areas, and market growth strategies.
Additional benefits you will get with this purchase are:
- Quarterly Update and* (only available with a corporate license, on listed price)
- 5 additional Company Profile of client Choice pre- or Post-purchase, as a free update.
- Free Upcoming Version on the Purchase of Five and Enterprise User License.
- 16 analyst hours of support* (post-purchase, if you find additional data requirements upon review of the report, you may receive support amounting to 16 analyst hours to solve questions, and post-sale queries)
- 15% Free Customization* (in case the scope or segment of the report does not match your requirements, 15% is equivalent to 3 working days of free work, applicable once)
- Free data Pack on the Five and Enterprise User License. (Excel version of the report)
- Free Updated report if the report is 6-12 months old or older.
- 24-hour priority response*
- Free Industry updates and white papers.
Possible Customization with this report (with additional cost and timeline, please talk to the sales executive to know more)
- Product Benchmarking / Product specification and applications
- Regulatory Guidelines
- Additional company profiles with specific to client's interest
- Additional country or region analysis- market size and forecast
- Expanded list for Company Profiles
- Historic market data
- Key player details (including location, contact details, supplier/vendor network etc. in excel format)
Key Market Segments
By Material
- Metal
- Polymers
- Other
By Product Type
- Plate
- Mesh
- Paste
- Screws
By End User
- Hospitals
- Plastic Surgery Clinics
- Ambulatory Surgical Centers
By Region
- North America
- U.S.
- Canada
- Mexico
- Europe
- Germany
- France
- UK
- Italy
- Spain
- Rest of Europe
- Asia-Pacific
- Japan
- China
- India
- Australia
- South Korea
- Rest of Asia-Pacific
- Latin America
- Brazil
- Colombia
- Argentina
- Rest Of La
- Middle East and Africa
- Gcc
- South Africa
- North Africa
- Rest Of Mea
Key Market Players:
- Zimmer Biomet Holding, Inc.
- Stryker Corporation.
- Johnson and Johnson (DePuy Synthes)
- Medtronic
- KLS Martin Group
- Anatomics Pty Ltd
- Bioplate Inc.
- Integra LifeSciences Holdings Corporation
- B. Braun SE
- OssDsign AB
TABLE OF CONTENTS
CHAPTER 1: INTRODUCTION
- 1.1. Report description
- 1.2. Key market segments
- 1.3. Key benefits to the stakeholders
- 1.4. Research methodology
- 1.4.1. Primary research
- 1.4.2. Secondary research
- 1.4.3. Analyst tools and models
CHAPTER 2: EXECUTIVE SUMMARY
- 2.1. CXO perspective
CHAPTER 3: MARKET OVERVIEW
- 3.1. Market definition and scope
- 3.2. Key findings
- 3.2.1. Top impacting factors
- 3.2.2. Top investment pockets
- 3.3. Porter's five forces analysis
- 3.4. Market dynamics
- 3.4.1. Drivers
- 3.4.2. Restraints
- 3.4.3. Opportunities
CHAPTER 4: CRANIOFACIAL IMPLANTS MARKET, BY MATERIAL
- 4.1. Overview
- 4.1.1. Market size and forecast
- 4.2. Metal
- 4.2.1. Key market trends, growth factors and opportunities
- 4.2.2. Market size and forecast, by region
- 4.2.3. Market share analysis by country
- 4.3. Polymers
- 4.3.1. Key market trends, growth factors and opportunities
- 4.3.2. Market size and forecast, by region
- 4.3.3. Market share analysis by country
- 4.4. Other
- 4.4.1. Key market trends, growth factors and opportunities
- 4.4.2. Market size and forecast, by region
- 4.4.3. Market share analysis by country
CHAPTER 5: CRANIOFACIAL IMPLANTS MARKET, BY PRODUCT TYPE
- 5.1. Overview
- 5.1.1. Market size and forecast
- 5.2. Plate
- 5.2.1. Key market trends, growth factors and opportunities
- 5.2.2. Market size and forecast, by region
- 5.2.3. Market share analysis by country
- 5.3. Mesh
- 5.3.1. Key market trends, growth factors and opportunities
- 5.3.2. Market size and forecast, by region
- 5.3.3. Market share analysis by country
- 5.4. Paste
- 5.4.1. Key market trends, growth factors and opportunities
- 5.4.2. Market size and forecast, by region
- 5.4.3. Market share analysis by country
- 5.5. Screws
- 5.5.1. Key market trends, growth factors and opportunities
- 5.5.2. Market size and forecast, by region
- 5.5.3. Market share analysis by country
CHAPTER 6: CRANIOFACIAL IMPLANTS MARKET, BY END USER
- 6.1. Overview
- 6.1.1. Market size and forecast
- 6.2. Hospitals
- 6.2.1. Key market trends, growth factors and opportunities
- 6.2.2. Market size and forecast, by region
- 6.2.3. Market share analysis by country
- 6.3. Plastic Surgery Clinics
- 6.3.1. Key market trends, growth factors and opportunities
- 6.3.2. Market size and forecast, by region
- 6.3.3. Market share analysis by country
- 6.4. Ambulatory Surgical Centers
- 6.4.1. Key market trends, growth factors and opportunities
- 6.4.2. Market size and forecast, by region
- 6.4.3. Market share analysis by country
CHAPTER 7: CRANIOFACIAL IMPLANTS MARKET, BY REGION
- 7.1. Overview
- 7.1.1. Market size and forecast By Region
- 7.2. North America
- 7.2.1. Key market trends, growth factors and opportunities
- 7.2.2. Market size and forecast, by Material
- 7.2.3. Market size and forecast, by Product Type
- 7.2.4. Market size and forecast, by End User
- 7.2.5. Market size and forecast, by country
- 7.2.5.1. U.S.
- 7.2.5.1.1. Market size and forecast, by Material
- 7.2.5.1.2. Market size and forecast, by Product Type
- 7.2.5.1.3. Market size and forecast, by End User
- 7.2.5.2. Canada
- 7.2.5.2.1. Market size and forecast, by Material
- 7.2.5.2.2. Market size and forecast, by Product Type
- 7.2.5.2.3. Market size and forecast, by End User
- 7.2.5.3. Mexico
- 7.2.5.3.1. Market size and forecast, by Material
- 7.2.5.3.2. Market size and forecast, by Product Type
- 7.2.5.3.3. Market size and forecast, by End User
- 7.3. Europe
- 7.3.1. Key market trends, growth factors and opportunities
- 7.3.2. Market size and forecast, by Material
- 7.3.3. Market size and forecast, by Product Type
- 7.3.4. Market size and forecast, by End User
- 7.3.5. Market size and forecast, by country
- 7.3.5.1. Germany
- 7.3.5.1.1. Market size and forecast, by Material
- 7.3.5.1.2. Market size and forecast, by Product Type
- 7.3.5.1.3. Market size and forecast, by End User
- 7.3.5.2. France
- 7.3.5.2.1. Market size and forecast, by Material
- 7.3.5.2.2. Market size and forecast, by Product Type
- 7.3.5.2.3. Market size and forecast, by End User
- 7.3.5.3. UK
- 7.3.5.3.1. Market size and forecast, by Material
- 7.3.5.3.2. Market size and forecast, by Product Type
- 7.3.5.3.3. Market size and forecast, by End User
- 7.3.5.4. Italy
- 7.3.5.4.1. Market size and forecast, by Material
- 7.3.5.4.2. Market size and forecast, by Product Type
- 7.3.5.4.3. Market size and forecast, by End User
- 7.3.5.5. Spain
- 7.3.5.5.1. Market size and forecast, by Material
- 7.3.5.5.2. Market size and forecast, by Product Type
- 7.3.5.5.3. Market size and forecast, by End User
- 7.3.5.6. Rest of Europe
- 7.3.5.6.1. Market size and forecast, by Material
- 7.3.5.6.2. Market size and forecast, by Product Type
- 7.3.5.6.3. Market size and forecast, by End User
- 7.4. Asia-Pacific
- 7.4.1. Key market trends, growth factors and opportunities
- 7.4.2. Market size and forecast, by Material
- 7.4.3. Market size and forecast, by Product Type
- 7.4.4. Market size and forecast, by End User
- 7.4.5. Market size and forecast, by country
- 7.4.5.1. Japan
- 7.4.5.1.1. Market size and forecast, by Material
- 7.4.5.1.2. Market size and forecast, by Product Type
- 7.4.5.1.3. Market size and forecast, by End User
- 7.4.5.2. China
- 7.4.5.2.1. Market size and forecast, by Material
- 7.4.5.2.2. Market size and forecast, by Product Type
- 7.4.5.2.3. Market size and forecast, by End User
- 7.4.5.3. India
- 7.4.5.3.1. Market size and forecast, by Material
- 7.4.5.3.2. Market size and forecast, by Product Type
- 7.4.5.3.3. Market size and forecast, by End User
- 7.4.5.4. Australia
- 7.4.5.4.1. Market size and forecast, by Material
- 7.4.5.4.2. Market size and forecast, by Product Type
- 7.4.5.4.3. Market size and forecast, by End User
- 7.4.5.5. South Korea
- 7.4.5.5.1. Market size and forecast, by Material
- 7.4.5.5.2. Market size and forecast, by Product Type
- 7.4.5.5.3. Market size and forecast, by End User
- 7.4.5.6. Rest of Asia-Pacific
- 7.4.5.6.1. Market size and forecast, by Material
- 7.4.5.6.2. Market size and forecast, by Product Type
- 7.4.5.6.3. Market size and forecast, by End User
- 7.5. Latin America
- 7.5.1. Key market trends, growth factors and opportunities
- 7.5.2. Market size and forecast, by Material
- 7.5.3. Market size and forecast, by Product Type
- 7.5.4. Market size and forecast, by End User
- 7.5.5. Market size and forecast, by country
- 7.5.5.1. Brazil
- 7.5.5.1.1. Market size and forecast, by Material
- 7.5.5.1.2. Market size and forecast, by Product Type
- 7.5.5.1.3. Market size and forecast, by End User
- 7.5.5.2. Colombia
- 7.5.5.2.1. Market size and forecast, by Material
- 7.5.5.2.2. Market size and forecast, by Product Type
- 7.5.5.2.3. Market size and forecast, by End User
- 7.5.5.3. Argentina
- 7.5.5.3.1. Market size and forecast, by Material
- 7.5.5.3.2. Market size and forecast, by Product Type
- 7.5.5.3.3. Market size and forecast, by End User
- 7.5.5.4. Rest Of La
- 7.5.5.4.1. Market size and forecast, by Material
- 7.5.5.4.2. Market size and forecast, by Product Type
- 7.5.5.4.3. Market size and forecast, by End User
- 7.6. Middle East and Africa
- 7.6.1. Key market trends, growth factors and opportunities
- 7.6.2. Market size and forecast, by Material
- 7.6.3. Market size and forecast, by Product Type
- 7.6.4. Market size and forecast, by End User
- 7.6.5. Market size and forecast, by country
- 7.6.5.1. Gcc
- 7.6.5.1.1. Market size and forecast, by Material
- 7.6.5.1.2. Market size and forecast, by Product Type
- 7.6.5.1.3. Market size and forecast, by End User
- 7.6.5.2. South Africa
- 7.6.5.2.1. Market size and forecast, by Material
- 7.6.5.2.2. Market size and forecast, by Product Type
- 7.6.5.2.3. Market size and forecast, by End User
- 7.6.5.3. North Africa
- 7.6.5.3.1. Market size and forecast, by Material
- 7.6.5.3.2. Market size and forecast, by Product Type
- 7.6.5.3.3. Market size and forecast, by End User
- 7.6.5.4. Rest Of Mea
- 7.6.5.4.1. Market size and forecast, by Material
- 7.6.5.4.2. Market size and forecast, by Product Type
- 7.6.5.4.3. Market size and forecast, by End User
CHAPTER 8: COMPETITIVE LANDSCAPE
- 8.1. Introduction
- 8.2. Top winning strategies
- 8.3. Product mapping of top 10 player
- 8.4. Competitive dashboard
- 8.5. Competitive heatmap
- 8.6. Top player positioning, 2022
CHAPTER 9: COMPANY PROFILES
- 9.1. Zimmer Biomet Holding, Inc.
- 9.1.1. Company overview
- 9.1.2. Key executives
- 9.1.3. Company snapshot
- 9.1.4. Operating business segments
- 9.1.5. Product portfolio
- 9.1.6. Business performance
- 9.1.7. Key strategic moves and developments
- 9.2. Stryker Corporation.
- 9.2.1. Company overview
- 9.2.2. Key executives
- 9.2.3. Company snapshot
- 9.2.4. Operating business segments
- 9.2.5. Product portfolio
- 9.2.6. Business performance
- 9.2.7. Key strategic moves and developments
- 9.3. Johnson and Johnson (DePuy Synthes)
- 9.3.1. Company overview
- 9.3.2. Key executives
- 9.3.3. Company snapshot
- 9.3.4. Operating business segments
- 9.3.5. Product portfolio
- 9.3.6. Business performance
- 9.3.7. Key strategic moves and developments
- 9.4. Medtronic
- 9.4.1. Company overview
- 9.4.2. Key executives
- 9.4.3. Company snapshot
- 9.4.4. Operating business segments
- 9.4.5. Product portfolio
- 9.4.6. Business performance
- 9.4.7. Key strategic moves and developments
- 9.5. KLS Martin Group
- 9.5.1. Company overview
- 9.5.2. Key executives
- 9.5.3. Company snapshot
- 9.5.4. Operating business segments
- 9.5.5. Product portfolio
- 9.5.6. Business performance
- 9.5.7. Key strategic moves and developments
- 9.6. Anatomics Pty Ltd
- 9.6.1. Company overview
- 9.6.2. Key executives
- 9.6.3. Company snapshot
- 9.6.4. Operating business segments
- 9.6.5. Product portfolio
- 9.6.6. Business performance
- 9.6.7. Key strategic moves and developments
- 9.7. Bioplate Inc.
- 9.7.1. Company overview
- 9.7.2. Key executives
- 9.7.3. Company snapshot
- 9.7.4. Operating business segments
- 9.7.5. Product portfolio
- 9.7.6. Business performance
- 9.7.7. Key strategic moves and developments
- 9.8. Integra LifeSciences Holdings Corporation
- 9.8.1. Company overview
- 9.8.2. Key executives
- 9.8.3. Company snapshot
- 9.8.4. Operating business segments
- 9.8.5. Product portfolio
- 9.8.6. Business performance
- 9.8.7. Key strategic moves and developments
- 9.9. B. Braun SE
- 9.9.1. Company overview
- 9.9.2. Key executives
- 9.9.3. Company snapshot
- 9.9.4. Operating business segments
- 9.9.5. Product portfolio
- 9.9.6. Business performance
- 9.9.7. Key strategic moves and developments
- 9.10. OssDsign AB
- 9.10.1. Company overview
- 9.10.2. Key executives
- 9.10.3. Company snapshot
- 9.10.4. Operating business segments
- 9.10.5. Product portfolio
- 9.10.6. Business performance
- 9.10.7. Key strategic moves and developments
