
|
市場調査レポート
商品コード
1472367
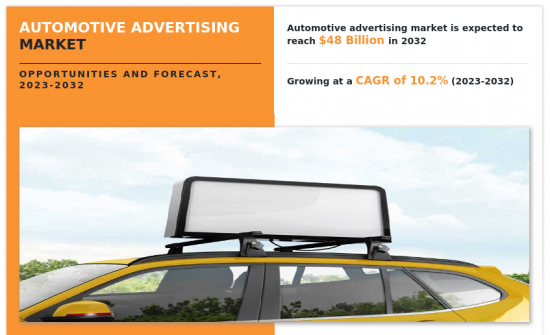
自動車広告の世界市場:タイプ別、製品別、エンドユーザー別:機会分析と産業予測(2023年~2032年)Automotive Advertising Market By Type, By Product, By End-User : Global Opportunity Analysis and Industry Forecast, 2023-2032 |
||||||
|
|||||||

| 自動車広告の世界市場:タイプ別、製品別、エンドユーザー別:機会分析と産業予測(2023年~2032年) |
|
出版日: 2024年03月01日
発行: Allied Market Research
ページ情報: 英文 250 Pages
納期: 2~3営業日
|

- 全表示
- 概要
- 図表
- 目次
自動車広告は、関連するコンポーネントや付属品と一緒に、自動車、トラック、およびその他の車両を促進するマーケティング戦略として定義されています。
広告のこのモードは、購入の意思決定を行うために、新車や中古車のためにこの市場で取引している個人を説得することを目指し、ニアマーケットオーディエンスとインマーケットショッパーの両方をターゲットにしています。ニアマーケットオーディエンスとは、自動車購入まで3~6ヶ月以内にいる買い物客のことであり、インマーケットショッパーとは、自動車購入まで3ヶ月以内の購買意欲の高い買い物客のことです。さらに、自動車広告活動は、主に自動車会社、ディーラー、関連企業が消費者に自社の製品やサービスを宣伝するために行うものです。自動車広告には、ブランドの認知度向上、販売促進、消費者の購買意思決定への影響を目的とした幅広い広告チャネルや戦略が含まれることが多くあります。
進化し続ける自動車業界の情勢において、デジタルトランスフォーメーションの継続的な成長は、イノベーション、効率性、消費者エンゲージメントの決定的な触媒となっています。デジタル・トランスフォーメーションによって、自動車ブランドはソーシャルメディア、検索エンジン、モバイル・アプリなど、複数のデジタル・チャネルを通じて多くのターゲット層にリーチできるようになりました。グーグルの情報によると、自動車購入者の約95%が情報源の一つとしてウェブを利用しており、そのうちの60%近くがモバイル端末からの検索です。このことは、シンプルなウェブサイトデザインが、顧客がオンラインソースを通じて入手可能な十分な情報を収集するのに役立つことを意味しています。さらに、自動車広告主は、ターゲット広告、リターゲティング、インフルエンサーとの提携といったデジタル・マーケティング戦術を活用し、オンラインで消費者を取り込んでいます。このように、オンラインソースを通じたデジタル化のレベルの上昇は、世界中の自動車広告市場の成長を促進すると予想されます。
さらに、相手先商標製品メーカー(OEM)の間で自動車広告の広範な採用は、世界中の自動車広告市場の成長機会を後押しするための主要な要因として浮上しています。広告は、自動車OEMがブランドのポジショニングを差別化し、製品の特徴やイノベーションを紹介し、混雑したマーケットプレースでターゲットオーディエンスとつながるための戦略的ツールとして機能しています。さらにOEMは、リーチ、エンゲージメント、コンバージョン、ブランドセンチメントなど、広告キャンペーンのパフォーマンスを追跡するために分析ツールや指標を採用しています。また、キャンペーン戦略の強化、効果的な予算配分、ターゲットオーディエンスの共感を得るためのメッセージング改善などに、これらの知見を活用することも多いです。こうした要因が、世界の自動車広告市場の成長を促進すると予測されています。
しかし、自動車分野の広告・マーケティングコストは有限であり、リソースの慎重な配分と優先順位付けが必要であるため、予算の制約が自動車広告市場の成長の主要な制限要因になると予想されます。コストを管理しながら投資収益率と効率性を高めることは、自動車広告主にとってかなりのリスクとなり、ひいては市場成長の妨げとなります。さらに、厳しい規制や広告基準へのコンプライアンスの問題が、特に世界市場における広告キャンペーンに複雑さをもたらし、結果として市場の成長を鈍化させています。
自動車広告市場は、タイプ、製品、エンドユーザー、地域に区分されます。タイプ別では、ロケーション非依存型広告とロケーションベース広告に分類されます。製品別では、オンライン広告、従来型メディア、プリロール広告、その他に分けられます。エンドユーザー別では、自動車グループ、自動車ディーラー、その他に細分化されます。地域別では、北米、欧州、アジア太平洋、ラテンアメリカ、中東・アフリカで市場を分析しています。
本レポートで可能なレポートカスタマイズ(追加費用とタイムラインに関しましては販売担当へご連絡ください)
- 投資機会
- 技術動向分析
- 製品/セグメント別の企業の市場シェア分析
- 規制ガイドライン
- 戦略的提言
- 顧客の関心に応じた追加企業プロファイル
- 国別または地域別の追加分析:市場規模と予測
- クリスクロスセグメント分析:市場規模と予測
- 企業プロファイルの拡張リスト
- SWOT分析
目次
第1章 イントロダクション
第2章 エグゼクティブサマリー
第3章 市場概要
- 市場の定義と範囲
- 主な調査結果
- 影響要因
- 主な投資機会
- ポーターのファイブフォース分析
- 市場力学
- 促進要因
- 抑制要因
- 機会
第4章 自動車広告市場:タイプ別
- 概要
- ロケーション非依存型広告
- ロケーションベース広告
第5章 自動車広告市場:製品別
- 概要
- オンライン広告
- 従来型メディア
- プリロール広告
- その他
第6章 自動車広告市場:エンドユーザー別
- 概要
- 自動車グループ
- 自動車ディーラー
- その他
第7章 自動車広告市場:地域別
- 概要
- 北米
- 米国
- カナダ
- メキシコ
- 欧州
- 英国
- ドイツ
- フランス
- イタリア
- その他
- アジア太平洋
- 中国
- 日本
- インド
- 韓国
- その他
- ラテンアメリカ
- ブラジル
- アルゼンチン
- コロンビア
- その他ラテンアメリカ
- 中東・アフリカ
- アラブ首長国連邦
- サウジアラビア
- 南アフリカ
- ナイジェリア
- その他中東・アフリカ
第8章 競合情勢
- イントロダクション
- 主要成功戦略
- 主要10社の製品マッピング
- 競合ダッシュボード
- 競合ヒートマップ
- 主要企業のポジショニング(2022年)
第9章 企業プロファイル
- Adpearance, Inc.
- CMB Automotive Marketing Limited
- Force Marketing
- Google LLC by Alphabet Inc.
- HigherVisibility
- Microsoft Corporation
- Meta Platforms, Inc.
- Omnicom Group Inc.
- Social Media 55
- Visarc
LIST OF TABLES
- TABLE 01. GLOBAL AUTOMOTIVE ADVERTISING MARKET, BY TYPE, 2022-2032 ($MILLION)
- TABLE 02. AUTOMOTIVE ADVERTISING MARKET FOR LOCATION INDEPENDENT ADVERTISING, BY REGION, 2022-2032 ($MILLION)
- TABLE 03. AUTOMOTIVE ADVERTISING MARKET FOR LOCATION-BASED ADVERTISING, BY REGION, 2022-2032 ($MILLION)
- TABLE 04. GLOBAL AUTOMOTIVE ADVERTISING MARKET, BY PRODUCT, 2022-2032 ($MILLION)
- TABLE 05. AUTOMOTIVE ADVERTISING MARKET FOR ONLINE ADVERTISING, BY REGION, 2022-2032 ($MILLION)
- TABLE 06. AUTOMOTIVE ADVERTISING MARKET FOR TRADITIONAL MEDIA, BY REGION, 2022-2032 ($MILLION)
- TABLE 07. AUTOMOTIVE ADVERTISING MARKET FOR PRE-ROLL ADVERTISEMENTS, BY REGION, 2022-2032 ($MILLION)
- TABLE 08. AUTOMOTIVE ADVERTISING MARKET FOR OTHERS, BY REGION, 2022-2032 ($MILLION)
- TABLE 09. GLOBAL AUTOMOTIVE ADVERTISING MARKET, BY END-USER, 2022-2032 ($MILLION)
- TABLE 10. AUTOMOTIVE ADVERTISING MARKET FOR AUTOMOTIVE GROUPS, BY REGION, 2022-2032 ($MILLION)
- TABLE 11. AUTOMOTIVE ADVERTISING MARKET FOR AUTOMOTIVE DEALERSHIPS, BY REGION, 2022-2032 ($MILLION)
- TABLE 12. AUTOMOTIVE ADVERTISING MARKET FOR OTHERS, BY REGION, 2022-2032 ($MILLION)
- TABLE 13. AUTOMOTIVE ADVERTISING MARKET, BY REGION, 2022-2032 ($MILLION)
- TABLE 14. NORTH AMERICA AUTOMOTIVE ADVERTISING MARKET, BY TYPE, 2022-2032 ($MILLION)
- TABLE 15. NORTH AMERICA AUTOMOTIVE ADVERTISING MARKET, BY PRODUCT, 2022-2032 ($MILLION)
- TABLE 16. NORTH AMERICA AUTOMOTIVE ADVERTISING MARKET, BY END-USER, 2022-2032 ($MILLION)
- TABLE 17. NORTH AMERICA AUTOMOTIVE ADVERTISING MARKET, BY COUNTRY, 2022-2032 ($MILLION)
- TABLE 18. U.S. AUTOMOTIVE ADVERTISING MARKET, BY TYPE, 2022-2032 ($MILLION)
- TABLE 19. U.S. AUTOMOTIVE ADVERTISING MARKET, BY PRODUCT, 2022-2032 ($MILLION)
- TABLE 20. U.S. AUTOMOTIVE ADVERTISING MARKET, BY END-USER, 2022-2032 ($MILLION)
- TABLE 21. CANADA AUTOMOTIVE ADVERTISING MARKET, BY TYPE, 2022-2032 ($MILLION)
- TABLE 22. CANADA AUTOMOTIVE ADVERTISING MARKET, BY PRODUCT, 2022-2032 ($MILLION)
- TABLE 23. CANADA AUTOMOTIVE ADVERTISING MARKET, BY END-USER, 2022-2032 ($MILLION)
- TABLE 24. MEXICO AUTOMOTIVE ADVERTISING MARKET, BY TYPE, 2022-2032 ($MILLION)
- TABLE 25. MEXICO AUTOMOTIVE ADVERTISING MARKET, BY PRODUCT, 2022-2032 ($MILLION)
- TABLE 26. MEXICO AUTOMOTIVE ADVERTISING MARKET, BY END-USER, 2022-2032 ($MILLION)
- TABLE 27. EUROPE AUTOMOTIVE ADVERTISING MARKET, BY TYPE, 2022-2032 ($MILLION)
- TABLE 28. EUROPE AUTOMOTIVE ADVERTISING MARKET, BY PRODUCT, 2022-2032 ($MILLION)
- TABLE 29. EUROPE AUTOMOTIVE ADVERTISING MARKET, BY END-USER, 2022-2032 ($MILLION)
- TABLE 30. EUROPE AUTOMOTIVE ADVERTISING MARKET, BY COUNTRY, 2022-2032 ($MILLION)
- TABLE 31. UK AUTOMOTIVE ADVERTISING MARKET, BY TYPE, 2022-2032 ($MILLION)
- TABLE 32. UK AUTOMOTIVE ADVERTISING MARKET, BY PRODUCT, 2022-2032 ($MILLION)
- TABLE 33. UK AUTOMOTIVE ADVERTISING MARKET, BY END-USER, 2022-2032 ($MILLION)
- TABLE 34. GERMANY AUTOMOTIVE ADVERTISING MARKET, BY TYPE, 2022-2032 ($MILLION)
- TABLE 35. GERMANY AUTOMOTIVE ADVERTISING MARKET, BY PRODUCT, 2022-2032 ($MILLION)
- TABLE 36. GERMANY AUTOMOTIVE ADVERTISING MARKET, BY END-USER, 2022-2032 ($MILLION)
- TABLE 37. FRANCE AUTOMOTIVE ADVERTISING MARKET, BY TYPE, 2022-2032 ($MILLION)
- TABLE 38. FRANCE AUTOMOTIVE ADVERTISING MARKET, BY PRODUCT, 2022-2032 ($MILLION)
- TABLE 39. FRANCE AUTOMOTIVE ADVERTISING MARKET, BY END-USER, 2022-2032 ($MILLION)
- TABLE 40. ITALY AUTOMOTIVE ADVERTISING MARKET, BY TYPE, 2022-2032 ($MILLION)
- TABLE 41. ITALY AUTOMOTIVE ADVERTISING MARKET, BY PRODUCT, 2022-2032 ($MILLION)
- TABLE 42. ITALY AUTOMOTIVE ADVERTISING MARKET, BY END-USER, 2022-2032 ($MILLION)
- TABLE 43. REST OF EUROPE AUTOMOTIVE ADVERTISING MARKET, BY TYPE, 2022-2032 ($MILLION)
- TABLE 44. REST OF EUROPE AUTOMOTIVE ADVERTISING MARKET, BY PRODUCT, 2022-2032 ($MILLION)
- TABLE 45. REST OF EUROPE AUTOMOTIVE ADVERTISING MARKET, BY END-USER, 2022-2032 ($MILLION)
- TABLE 46. ASIA-PACIFIC AUTOMOTIVE ADVERTISING MARKET, BY TYPE, 2022-2032 ($MILLION)
- TABLE 47. ASIA-PACIFIC AUTOMOTIVE ADVERTISING MARKET, BY PRODUCT, 2022-2032 ($MILLION)
- TABLE 48. ASIA-PACIFIC AUTOMOTIVE ADVERTISING MARKET, BY END-USER, 2022-2032 ($MILLION)
- TABLE 49. ASIA-PACIFIC AUTOMOTIVE ADVERTISING MARKET, BY COUNTRY, 2022-2032 ($MILLION)
- TABLE 50. CHINA AUTOMOTIVE ADVERTISING MARKET, BY TYPE, 2022-2032 ($MILLION)
- TABLE 51. CHINA AUTOMOTIVE ADVERTISING MARKET, BY PRODUCT, 2022-2032 ($MILLION)
- TABLE 52. CHINA AUTOMOTIVE ADVERTISING MARKET, BY END-USER, 2022-2032 ($MILLION)
- TABLE 53. JAPAN AUTOMOTIVE ADVERTISING MARKET, BY TYPE, 2022-2032 ($MILLION)
- TABLE 54. JAPAN AUTOMOTIVE ADVERTISING MARKET, BY PRODUCT, 2022-2032 ($MILLION)
- TABLE 55. JAPAN AUTOMOTIVE ADVERTISING MARKET, BY END-USER, 2022-2032 ($MILLION)
- TABLE 56. INDIA AUTOMOTIVE ADVERTISING MARKET, BY TYPE, 2022-2032 ($MILLION)
- TABLE 57. INDIA AUTOMOTIVE ADVERTISING MARKET, BY PRODUCT, 2022-2032 ($MILLION)
- TABLE 58. INDIA AUTOMOTIVE ADVERTISING MARKET, BY END-USER, 2022-2032 ($MILLION)
- TABLE 59. SOUTH KOREA AUTOMOTIVE ADVERTISING MARKET, BY TYPE, 2022-2032 ($MILLION)
- TABLE 60. SOUTH KOREA AUTOMOTIVE ADVERTISING MARKET, BY PRODUCT, 2022-2032 ($MILLION)
- TABLE 61. SOUTH KOREA AUTOMOTIVE ADVERTISING MARKET, BY END-USER, 2022-2032 ($MILLION)
- TABLE 62. REST OF ASIA-PACIFIC AUTOMOTIVE ADVERTISING MARKET, BY TYPE, 2022-2032 ($MILLION)
- TABLE 63. REST OF ASIA-PACIFIC AUTOMOTIVE ADVERTISING MARKET, BY PRODUCT, 2022-2032 ($MILLION)
- TABLE 64. REST OF ASIA-PACIFIC AUTOMOTIVE ADVERTISING MARKET, BY END-USER, 2022-2032 ($MILLION)
- TABLE 65. LATIN AMERICA AUTOMOTIVE ADVERTISING MARKET, BY TYPE, 2022-2032 ($MILLION)
- TABLE 66. LATIN AMERICA AUTOMOTIVE ADVERTISING MARKET, BY PRODUCT, 2022-2032 ($MILLION)
- TABLE 67. LATIN AMERICA AUTOMOTIVE ADVERTISING MARKET, BY END-USER, 2022-2032 ($MILLION)
- TABLE 68. LATIN AMERICA AUTOMOTIVE ADVERTISING MARKET, BY COUNTRY, 2022-2032 ($MILLION)
- TABLE 69. BRAZIL AUTOMOTIVE ADVERTISING MARKET, BY TYPE, 2022-2032 ($MILLION)
- TABLE 70. BRAZIL AUTOMOTIVE ADVERTISING MARKET, BY PRODUCT, 2022-2032 ($MILLION)
- TABLE 71. BRAZIL AUTOMOTIVE ADVERTISING MARKET, BY END-USER, 2022-2032 ($MILLION)
- TABLE 72. ARGENTINA AUTOMOTIVE ADVERTISING MARKET, BY TYPE, 2022-2032 ($MILLION)
- TABLE 73. ARGENTINA AUTOMOTIVE ADVERTISING MARKET, BY PRODUCT, 2022-2032 ($MILLION)
- TABLE 74. ARGENTINA AUTOMOTIVE ADVERTISING MARKET, BY END-USER, 2022-2032 ($MILLION)
- TABLE 75. COLOMBIA AUTOMOTIVE ADVERTISING MARKET, BY TYPE, 2022-2032 ($MILLION)
- TABLE 76. COLOMBIA AUTOMOTIVE ADVERTISING MARKET, BY PRODUCT, 2022-2032 ($MILLION)
- TABLE 77. COLOMBIA AUTOMOTIVE ADVERTISING MARKET, BY END-USER, 2022-2032 ($MILLION)
- TABLE 78. REST OF LATIN AMERICA AUTOMOTIVE ADVERTISING MARKET, BY TYPE, 2022-2032 ($MILLION)
- TABLE 79. REST OF LATIN AMERICA AUTOMOTIVE ADVERTISING MARKET, BY PRODUCT, 2022-2032 ($MILLION)
- TABLE 80. REST OF LATIN AMERICA AUTOMOTIVE ADVERTISING MARKET, BY END-USER, 2022-2032 ($MILLION)
- TABLE 81. MIDDLE EAST AND AFRICA AUTOMOTIVE ADVERTISING MARKET, BY TYPE, 2022-2032 ($MILLION)
- TABLE 82. MIDDLE EAST AND AFRICA AUTOMOTIVE ADVERTISING MARKET, BY PRODUCT, 2022-2032 ($MILLION)
- TABLE 83. MIDDLE EAST AND AFRICA AUTOMOTIVE ADVERTISING MARKET, BY END-USER, 2022-2032 ($MILLION)
- TABLE 84. MIDDLE EAST AND AFRICA AUTOMOTIVE ADVERTISING MARKET, BY COUNTRY, 2022-2032 ($MILLION)
- TABLE 85. UAE AUTOMOTIVE ADVERTISING MARKET, BY TYPE, 2022-2032 ($MILLION)
- TABLE 86. UAE AUTOMOTIVE ADVERTISING MARKET, BY PRODUCT, 2022-2032 ($MILLION)
- TABLE 87. UAE AUTOMOTIVE ADVERTISING MARKET, BY END-USER, 2022-2032 ($MILLION)
- TABLE 88. SAUDI ARABIA AUTOMOTIVE ADVERTISING MARKET, BY TYPE, 2022-2032 ($MILLION)
- TABLE 89. SAUDI ARABIA AUTOMOTIVE ADVERTISING MARKET, BY PRODUCT, 2022-2032 ($MILLION)
- TABLE 90. SAUDI ARABIA AUTOMOTIVE ADVERTISING MARKET, BY END-USER, 2022-2032 ($MILLION)
- TABLE 91. SOUTH AFRICA AUTOMOTIVE ADVERTISING MARKET, BY TYPE, 2022-2032 ($MILLION)
- TABLE 92. SOUTH AFRICA AUTOMOTIVE ADVERTISING MARKET, BY PRODUCT, 2022-2032 ($MILLION)
- TABLE 93. SOUTH AFRICA AUTOMOTIVE ADVERTISING MARKET, BY END-USER, 2022-2032 ($MILLION)
- TABLE 94. NIGERIA AUTOMOTIVE ADVERTISING MARKET, BY TYPE, 2022-2032 ($MILLION)
- TABLE 95. NIGERIA AUTOMOTIVE ADVERTISING MARKET, BY PRODUCT, 2022-2032 ($MILLION)
- TABLE 96. NIGERIA AUTOMOTIVE ADVERTISING MARKET, BY END-USER, 2022-2032 ($MILLION)
- TABLE 97. REST OF MIDDLE EAST & AFRICA AUTOMOTIVE ADVERTISING MARKET, BY TYPE, 2022-2032 ($MILLION)
- TABLE 98. REST OF MIDDLE EAST & AFRICA AUTOMOTIVE ADVERTISING MARKET, BY PRODUCT, 2022-2032 ($MILLION)
- TABLE 99. REST OF MIDDLE EAST & AFRICA AUTOMOTIVE ADVERTISING MARKET, BY END-USER, 2022-2032 ($MILLION)
- TABLE 100. ADPEARANCE, INC.: KEY EXECUTIVES
- TABLE 101. ADPEARANCE, INC.: COMPANY SNAPSHOT
- TABLE 102. ADPEARANCE, INC.: PRODUCT SEGMENTS
- TABLE 103. ADPEARANCE, INC.: SERVICE SEGMENTS
- TABLE 104. ADPEARANCE, INC.: PRODUCT PORTFOLIO
- TABLE 105. ADPEARANCE, INC.: KEY STRATERGIES
- TABLE 106. CMB AUTOMOTIVE MARKETING LIMITED: KEY EXECUTIVES
- TABLE 107. CMB AUTOMOTIVE MARKETING LIMITED: COMPANY SNAPSHOT
- TABLE 108. CMB AUTOMOTIVE MARKETING LIMITED: PRODUCT SEGMENTS
- TABLE 109. CMB AUTOMOTIVE MARKETING LIMITED: SERVICE SEGMENTS
- TABLE 110. CMB AUTOMOTIVE MARKETING LIMITED: PRODUCT PORTFOLIO
- TABLE 111. CMB AUTOMOTIVE MARKETING LIMITED: KEY STRATERGIES
- TABLE 112. FORCE MARKETING: KEY EXECUTIVES
- TABLE 113. FORCE MARKETING: COMPANY SNAPSHOT
- TABLE 114. FORCE MARKETING: PRODUCT SEGMENTS
- TABLE 115. FORCE MARKETING: SERVICE SEGMENTS
- TABLE 116. FORCE MARKETING: PRODUCT PORTFOLIO
- TABLE 117. FORCE MARKETING: KEY STRATERGIES
- TABLE 118. GOOGLE LLC BY ALPHABET INC.: KEY EXECUTIVES
- TABLE 119. GOOGLE LLC BY ALPHABET INC.: COMPANY SNAPSHOT
- TABLE 120. GOOGLE LLC BY ALPHABET INC.: PRODUCT SEGMENTS
- TABLE 121. GOOGLE LLC BY ALPHABET INC.: SERVICE SEGMENTS
- TABLE 122. GOOGLE LLC BY ALPHABET INC.: PRODUCT PORTFOLIO
- TABLE 123. GOOGLE LLC BY ALPHABET INC.: KEY STRATERGIES
- TABLE 124. HIGHERVISIBILITY: KEY EXECUTIVES
- TABLE 125. HIGHERVISIBILITY: COMPANY SNAPSHOT
- TABLE 126. HIGHERVISIBILITY: PRODUCT SEGMENTS
- TABLE 127. HIGHERVISIBILITY: SERVICE SEGMENTS
- TABLE 128. HIGHERVISIBILITY: PRODUCT PORTFOLIO
- TABLE 129. HIGHERVISIBILITY: KEY STRATERGIES
- TABLE 130. MICROSOFT CORPORATION: KEY EXECUTIVES
- TABLE 131. MICROSOFT CORPORATION: COMPANY SNAPSHOT
- TABLE 132. MICROSOFT CORPORATION: PRODUCT SEGMENTS
- TABLE 133. MICROSOFT CORPORATION: SERVICE SEGMENTS
- TABLE 134. MICROSOFT CORPORATION: PRODUCT PORTFOLIO
- TABLE 135. MICROSOFT CORPORATION: KEY STRATERGIES
- TABLE 136. META PLATFORMS, INC.: KEY EXECUTIVES
- TABLE 137. META PLATFORMS, INC.: COMPANY SNAPSHOT
- TABLE 138. META PLATFORMS, INC.: PRODUCT SEGMENTS
- TABLE 139. META PLATFORMS, INC.: SERVICE SEGMENTS
- TABLE 140. META PLATFORMS, INC.: PRODUCT PORTFOLIO
- TABLE 141. META PLATFORMS, INC.: KEY STRATERGIES
- TABLE 142. OMNICOM GROUP INC.: KEY EXECUTIVES
- TABLE 143. OMNICOM GROUP INC.: COMPANY SNAPSHOT
- TABLE 144. OMNICOM GROUP INC.: PRODUCT SEGMENTS
- TABLE 145. OMNICOM GROUP INC.: SERVICE SEGMENTS
- TABLE 146. OMNICOM GROUP INC.: PRODUCT PORTFOLIO
- TABLE 147. OMNICOM GROUP INC.: KEY STRATERGIES
- TABLE 148. SOCIAL MEDIA 55: KEY EXECUTIVES
- TABLE 149. SOCIAL MEDIA 55: COMPANY SNAPSHOT
- TABLE 150. SOCIAL MEDIA 55: PRODUCT SEGMENTS
- TABLE 151. SOCIAL MEDIA 55: SERVICE SEGMENTS
- TABLE 152. SOCIAL MEDIA 55: PRODUCT PORTFOLIO
- TABLE 153. SOCIAL MEDIA 55: KEY STRATERGIES
- TABLE 154. VISARC: KEY EXECUTIVES
- TABLE 155. VISARC: COMPANY SNAPSHOT
- TABLE 156. VISARC: PRODUCT SEGMENTS
- TABLE 157. VISARC: SERVICE SEGMENTS
- TABLE 158. VISARC: PRODUCT PORTFOLIO
- TABLE 159. VISARC: KEY STRATERGIES
LIST OF FIGURES
- FIGURE 01. AUTOMOTIVE ADVERTISING MARKET, 2022-2032
- FIGURE 02. SEGMENTATION OF AUTOMOTIVE ADVERTISING MARKET,2022-2032
- FIGURE 03. TOP IMPACTING FACTORS IN AUTOMOTIVE ADVERTISING MARKET
- FIGURE 04. TOP INVESTMENT POCKETS IN AUTOMOTIVE ADVERTISING MARKET (2023-2032)
- FIGURE 05. BARGAINING POWER OF SUPPLIERS
- FIGURE 06. BARGAINING POWER OF BUYERS
- FIGURE 07. THREAT OF SUBSTITUTION
- FIGURE 08. THREAT OF SUBSTITUTION
- FIGURE 09. COMPETITIVE RIVALRY
- FIGURE 10. GLOBAL AUTOMOTIVE ADVERTISING MARKET:DRIVERS, RESTRAINTS AND OPPORTUNITIES
- FIGURE 11. AUTOMOTIVE ADVERTISING MARKET, BY TYPE, 2022 AND 2032(%)
- FIGURE 12. COMPARATIVE SHARE ANALYSIS OF AUTOMOTIVE ADVERTISING MARKET FOR LOCATION INDEPENDENT ADVERTISING, BY COUNTRY 2022 AND 2032(%)
- FIGURE 13. COMPARATIVE SHARE ANALYSIS OF AUTOMOTIVE ADVERTISING MARKET FOR LOCATION-BASED ADVERTISING, BY COUNTRY 2022 AND 2032(%)
- FIGURE 14. AUTOMOTIVE ADVERTISING MARKET, BY PRODUCT, 2022 AND 2032(%)
- FIGURE 15. COMPARATIVE SHARE ANALYSIS OF AUTOMOTIVE ADVERTISING MARKET FOR ONLINE ADVERTISING, BY COUNTRY 2022 AND 2032(%)
- FIGURE 16. COMPARATIVE SHARE ANALYSIS OF AUTOMOTIVE ADVERTISING MARKET FOR TRADITIONAL MEDIA, BY COUNTRY 2022 AND 2032(%)
- FIGURE 17. COMPARATIVE SHARE ANALYSIS OF AUTOMOTIVE ADVERTISING MARKET FOR PRE-ROLL ADVERTISEMENTS, BY COUNTRY 2022 AND 2032(%)
- FIGURE 18. COMPARATIVE SHARE ANALYSIS OF AUTOMOTIVE ADVERTISING MARKET FOR OTHERS, BY COUNTRY 2022 AND 2032(%)
- FIGURE 19. AUTOMOTIVE ADVERTISING MARKET, BY END-USER, 2022 AND 2032(%)
- FIGURE 20. COMPARATIVE SHARE ANALYSIS OF AUTOMOTIVE ADVERTISING MARKET FOR AUTOMOTIVE GROUPS, BY COUNTRY 2022 AND 2032(%)
- FIGURE 21. COMPARATIVE SHARE ANALYSIS OF AUTOMOTIVE ADVERTISING MARKET FOR AUTOMOTIVE DEALERSHIPS, BY COUNTRY 2022 AND 2032(%)
- FIGURE 22. COMPARATIVE SHARE ANALYSIS OF AUTOMOTIVE ADVERTISING MARKET FOR OTHERS, BY COUNTRY 2022 AND 2032(%)
- FIGURE 23. AUTOMOTIVE ADVERTISING MARKET BY REGION, 2022 AND 2032(%)
- FIGURE 24. U.S. AUTOMOTIVE ADVERTISING MARKET, 2022-2032 ($MILLION)
- FIGURE 25. CANADA AUTOMOTIVE ADVERTISING MARKET, 2022-2032 ($MILLION)
- FIGURE 26. MEXICO AUTOMOTIVE ADVERTISING MARKET, 2022-2032 ($MILLION)
- FIGURE 27. UK AUTOMOTIVE ADVERTISING MARKET, 2022-2032 ($MILLION)
- FIGURE 28. GERMANY AUTOMOTIVE ADVERTISING MARKET, 2022-2032 ($MILLION)
- FIGURE 29. FRANCE AUTOMOTIVE ADVERTISING MARKET, 2022-2032 ($MILLION)
- FIGURE 30. ITALY AUTOMOTIVE ADVERTISING MARKET, 2022-2032 ($MILLION)
- FIGURE 31. REST OF EUROPE AUTOMOTIVE ADVERTISING MARKET, 2022-2032 ($MILLION)
- FIGURE 32. CHINA AUTOMOTIVE ADVERTISING MARKET, 2022-2032 ($MILLION)
- FIGURE 33. JAPAN AUTOMOTIVE ADVERTISING MARKET, 2022-2032 ($MILLION)
- FIGURE 34. INDIA AUTOMOTIVE ADVERTISING MARKET, 2022-2032 ($MILLION)
- FIGURE 35. SOUTH KOREA AUTOMOTIVE ADVERTISING MARKET, 2022-2032 ($MILLION)
- FIGURE 36. REST OF ASIA-PACIFIC AUTOMOTIVE ADVERTISING MARKET, 2022-2032 ($MILLION)
- FIGURE 37. BRAZIL AUTOMOTIVE ADVERTISING MARKET, 2022-2032 ($MILLION)
- FIGURE 38. ARGENTINA AUTOMOTIVE ADVERTISING MARKET, 2022-2032 ($MILLION)
- FIGURE 39. COLOMBIA AUTOMOTIVE ADVERTISING MARKET, 2022-2032 ($MILLION)
- FIGURE 40. REST OF LATIN AMERICA AUTOMOTIVE ADVERTISING MARKET, 2022-2032 ($MILLION)
- FIGURE 41. UAE AUTOMOTIVE ADVERTISING MARKET, 2022-2032 ($MILLION)
- FIGURE 42. SAUDI ARABIA AUTOMOTIVE ADVERTISING MARKET, 2022-2032 ($MILLION)
- FIGURE 43. SOUTH AFRICA AUTOMOTIVE ADVERTISING MARKET, 2022-2032 ($MILLION)
- FIGURE 44. NIGERIA AUTOMOTIVE ADVERTISING MARKET, 2022-2032 ($MILLION)
- FIGURE 45. REST OF MIDDLE EAST & AFRICA AUTOMOTIVE ADVERTISING MARKET, 2022-2032 ($MILLION)
- FIGURE 46. TOP WINNING STRATEGIES, BY YEAR
- FIGURE 47. TOP WINNING STRATEGIES, BY DEVELOPMENT
- FIGURE 48. TOP WINNING STRATEGIES, BY COMPANY
- FIGURE 49. PRODUCT MAPPING OF TOP 10 PLAYERS
- FIGURE 50. COMPETITIVE DASHBOARD
- FIGURE 51. COMPETITIVE HEATMAP: AUTOMOTIVE ADVERTISING MARKET
- FIGURE 52. TOP PLAYER POSITIONING, 2022
Automotive advertising is defined as a marketing strategy that promotes cars, trucks, and other vehicles, along with the related components and accessories. This mode of advertising aims to convince individuals who are dealing in this market for a new or used vehicle to make a purchase decision. It targets both near-market audiences and in-market shoppers. Near-market audiences are shoppers who might be 3-6 months out from purchasing a car, while in-market shoppers are high-intent shoppers who are less than 3 months from purchasing a car. Further, automotive advertising activities are primarily undertaken by automotive companies, dealerships, and related businesses to promote their products and services to consumers. It often includes a wide range of advertising channels and strategies aimed at increasing brand awareness, driving sales, and influencing consumer purchasing decisions within the automotive industry.
In the ever-evolving landscape of the automotive industry, the continual growth in digital transformation has become a defining catalyst for innovation, efficiency, and consumer engagement. It facilitates automotive brands to reach a large target audience across multiple digital channels, including social media, search engines, and mobile apps. According to information from Google, about 95% of vehicle buyers utilize the web as one of their sources of information, with almost 60% of those searches coming from mobile devices. This implies that a simple website design helps customers gather ample information available through online sources. Further, automotive advertisers leverage digital marketing tactics, such as targeted advertising, retargeting, and influencer partnerships to engage consumers online. Thus, the rise in the level of digitalization through online sources is expected to fuel the growth of automotive advertising market across the globe.
Moreover, the widespread adoption of automotive advertising among original equipment manufacturers (OEMs) has emerged as a prime factor for boosting the growth opportunities of the automotive advertising market across the globe. Advertising serves as a strategic tool for automotive OEMs to differentiate their brand positioning, showcase product features, and innovations, and connect with target audiences in a crowded marketplace. In addition, OEMs employ analytics tools and metrics to track the performance of their advertising campaigns, including reach, engagement, conversions, and brand sentiment. They often utilize these insights to enhance campaign strategies, distribute budgets effectively, and upgrade messaging to improve and resonate with target audiences. These factors are projected to fuel the growth of the global automotive advertising market.
However, the budget constraint is expected to be a prime limiting factor for the growth of the automotive advertising market, as advertising and marketing costs in the automotive sector are finite, requiring cautious allocation and prioritization of resources. Increase in return on investment and efficiency while managing costs presents a considerable risk for automotive advertisers, which in turn obstructs market growth. In addition, compliance issues with stringent regulations and advertising standards further add complexities to advertising campaigns, especially in the global market, resulting in slowed down market growth.
The automotive advertising market is segmented into type, product, end user, and region. Depending on the type, it is categorized into location-independent advertising and location-based advertising. On the basis of product, it is divided into online advertising, traditional media, pre-roll advertisements, and others. By end user, it is fragmented into automotive groups, automotive dealerships, and others. Region-wise, the market is analyzed across North America, Europe, Asia-Pacific, Latin America, and Middle East & Africa.
Key players covered in the report include Adpearance, Inc., CMB Automotive Marketing Limited, Force Marketing, Google LLC by Alphabet Inc., HigherVisibility, Microsoft Corporation, Meta Platforms, Inc., Omnicom Group Inc., Social Media 55, and Visarc. These companies have adopted strategies such as product launches, product development, and others to improve their market positioning.
Additional benefits you will get with this purchase are:
- Quarterly Update and* (only available with a corporate license, on listed price)
- 5 additional Company Profile of client Choice pre- or Post-purchase, as a free update.
- Free Upcoming Version on the Purchase of Five and Enterprise User License.
- 16 analyst hours of support* (post-purchase, if you find additional data requirements upon review of the report, you may receive support amounting to 16 analyst hours to solve questions, and post-sale queries)
- 15% Free Customization* (in case the scope or segment of the report does not match your requirements, 15% is equivalent to 3 working days of free work, applicable once)
- Free data Pack on the Five and Enterprise User License. (Excel version of the report)
- Free Updated report if the report is 6-12 months old or older.
- 24-hour priority response*
- Free Industry updates and white papers.
Possible Customization with this report (with additional cost and timeline, please talk to the sales executive to know more)
- Investment Opportunities
- Technology Trend Analysis
- Market share analysis of players by products/segments
- Regulatory Guidelines
- Strategic Recommendations
- Additional company profiles with specific to client's interest
- Additional country or region analysis- market size and forecast
- Criss-cross segment analysis- market size and forecast
- Expanded list for Company Profiles
- SWOT Analysis
Key Market Segments
By Type
- Location Independent Advertising
- Location-Based Advertising
By Product
- Online Advertising
- Traditional Media
- Pre-Roll Advertisements
- Others
By End-User
- Automotive Groups
- Automotive Dealerships
- Others
By Region
- North America
- U.S.
- Canada
- Mexico
- Europe
- UK
- Germany
- France
- Italy
- Rest of Europe
- Asia-Pacific
- China
- Japan
- India
- South Korea
- Rest of Asia-Pacific
- Latin America
- Brazil
- Argentina
- Colombia
- Rest of Latin America
- Middle East and Africa
- UAE
- Saudi Arabia
- South Africa
- Nigeria
- Rest Of Middle East Africa
Key Market Players:
- CMB Automotive Marketing Limited
- Force Marketing
- Google LLC by Alphabet Inc.
- HigherVisibility
- Microsoft Corporation
- Meta Platforms, Inc.
- Omnicom Group Inc.
- Social Media 55
- Visarc
- Adpearance, Inc.
TABLE OF CONTENTS
CHAPTER 1: INTRODUCTION
- 1.1. Report description
- 1.2. Key market segments
- 1.3. Key benefits to the stakeholders
- 1.4. Research methodology
- 1.4.1. Primary research
- 1.4.2. Secondary research
- 1.4.3. Analyst tools and models
CHAPTER 2: EXECUTIVE SUMMARY
- 2.1. CXO perspective
CHAPTER 3: MARKET OVERVIEW
- 3.1. Market definition and scope
- 3.2. Key findings
- 3.2.1. Top impacting factors
- 3.2.2. Top investment pockets
- 3.3. Porter's five forces analysis
- 3.4. Market dynamics
- 3.4.1. Drivers
- 3.4.2. Restraints
- 3.4.3. Opportunities
CHAPTER 4: AUTOMOTIVE ADVERTISING MARKET, BY TYPE
- 4.1. Overview
- 4.1.1. Market size and forecast
- 4.2. Location Independent Advertising
- 4.2.1. Key market trends, growth factors and opportunities
- 4.2.2. Market size and forecast, by region
- 4.2.3. Market share analysis by country
- 4.3. Location-Based Advertising
- 4.3.1. Key market trends, growth factors and opportunities
- 4.3.2. Market size and forecast, by region
- 4.3.3. Market share analysis by country
CHAPTER 5: AUTOMOTIVE ADVERTISING MARKET, BY PRODUCT
- 5.1. Overview
- 5.1.1. Market size and forecast
- 5.2. Online Advertising
- 5.2.1. Key market trends, growth factors and opportunities
- 5.2.2. Market size and forecast, by region
- 5.2.3. Market share analysis by country
- 5.3. Traditional Media
- 5.3.1. Key market trends, growth factors and opportunities
- 5.3.2. Market size and forecast, by region
- 5.3.3. Market share analysis by country
- 5.4. Pre-Roll Advertisements
- 5.4.1. Key market trends, growth factors and opportunities
- 5.4.2. Market size and forecast, by region
- 5.4.3. Market share analysis by country
- 5.5. Others
- 5.5.1. Key market trends, growth factors and opportunities
- 5.5.2. Market size and forecast, by region
- 5.5.3. Market share analysis by country
CHAPTER 6: AUTOMOTIVE ADVERTISING MARKET, BY END-USER
- 6.1. Overview
- 6.1.1. Market size and forecast
- 6.2. Automotive Groups
- 6.2.1. Key market trends, growth factors and opportunities
- 6.2.2. Market size and forecast, by region
- 6.2.3. Market share analysis by country
- 6.3. Automotive Dealerships
- 6.3.1. Key market trends, growth factors and opportunities
- 6.3.2. Market size and forecast, by region
- 6.3.3. Market share analysis by country
- 6.4. Others
- 6.4.1. Key market trends, growth factors and opportunities
- 6.4.2. Market size and forecast, by region
- 6.4.3. Market share analysis by country
CHAPTER 7: AUTOMOTIVE ADVERTISING MARKET, BY REGION
- 7.1. Overview
- 7.1.1. Market size and forecast By Region
- 7.2. North America
- 7.2.1. Key market trends, growth factors and opportunities
- 7.2.2. Market size and forecast, by Type
- 7.2.3. Market size and forecast, by Product
- 7.2.4. Market size and forecast, by End-User
- 7.2.5. Market size and forecast, by country
- 7.2.5.1. U.S.
- 7.2.5.1.1. Market size and forecast, by Type
- 7.2.5.1.2. Market size and forecast, by Product
- 7.2.5.1.3. Market size and forecast, by End-User
- 7.2.5.2. Canada
- 7.2.5.2.1. Market size and forecast, by Type
- 7.2.5.2.2. Market size and forecast, by Product
- 7.2.5.2.3. Market size and forecast, by End-User
- 7.2.5.3. Mexico
- 7.2.5.3.1. Market size and forecast, by Type
- 7.2.5.3.2. Market size and forecast, by Product
- 7.2.5.3.3. Market size and forecast, by End-User
- 7.3. Europe
- 7.3.1. Key market trends, growth factors and opportunities
- 7.3.2. Market size and forecast, by Type
- 7.3.3. Market size and forecast, by Product
- 7.3.4. Market size and forecast, by End-User
- 7.3.5. Market size and forecast, by country
- 7.3.5.1. UK
- 7.3.5.1.1. Market size and forecast, by Type
- 7.3.5.1.2. Market size and forecast, by Product
- 7.3.5.1.3. Market size and forecast, by End-User
- 7.3.5.2. Germany
- 7.3.5.2.1. Market size and forecast, by Type
- 7.3.5.2.2. Market size and forecast, by Product
- 7.3.5.2.3. Market size and forecast, by End-User
- 7.3.5.3. France
- 7.3.5.3.1. Market size and forecast, by Type
- 7.3.5.3.2. Market size and forecast, by Product
- 7.3.5.3.3. Market size and forecast, by End-User
- 7.3.5.4. Italy
- 7.3.5.4.1. Market size and forecast, by Type
- 7.3.5.4.2. Market size and forecast, by Product
- 7.3.5.4.3. Market size and forecast, by End-User
- 7.3.5.5. Rest of Europe
- 7.3.5.5.1. Market size and forecast, by Type
- 7.3.5.5.2. Market size and forecast, by Product
- 7.3.5.5.3. Market size and forecast, by End-User
- 7.4. Asia-Pacific
- 7.4.1. Key market trends, growth factors and opportunities
- 7.4.2. Market size and forecast, by Type
- 7.4.3. Market size and forecast, by Product
- 7.4.4. Market size and forecast, by End-User
- 7.4.5. Market size and forecast, by country
- 7.4.5.1. China
- 7.4.5.1.1. Market size and forecast, by Type
- 7.4.5.1.2. Market size and forecast, by Product
- 7.4.5.1.3. Market size and forecast, by End-User
- 7.4.5.2. Japan
- 7.4.5.2.1. Market size and forecast, by Type
- 7.4.5.2.2. Market size and forecast, by Product
- 7.4.5.2.3. Market size and forecast, by End-User
- 7.4.5.3. India
- 7.4.5.3.1. Market size and forecast, by Type
- 7.4.5.3.2. Market size and forecast, by Product
- 7.4.5.3.3. Market size and forecast, by End-User
- 7.4.5.4. South Korea
- 7.4.5.4.1. Market size and forecast, by Type
- 7.4.5.4.2. Market size and forecast, by Product
- 7.4.5.4.3. Market size and forecast, by End-User
- 7.4.5.5. Rest of Asia-Pacific
- 7.4.5.5.1. Market size and forecast, by Type
- 7.4.5.5.2. Market size and forecast, by Product
- 7.4.5.5.3. Market size and forecast, by End-User
- 7.5. Latin America
- 7.5.1. Key market trends, growth factors and opportunities
- 7.5.2. Market size and forecast, by Type
- 7.5.3. Market size and forecast, by Product
- 7.5.4. Market size and forecast, by End-User
- 7.5.5. Market size and forecast, by country
- 7.5.5.1. Brazil
- 7.5.5.1.1. Market size and forecast, by Type
- 7.5.5.1.2. Market size and forecast, by Product
- 7.5.5.1.3. Market size and forecast, by End-User
- 7.5.5.2. Argentina
- 7.5.5.2.1. Market size and forecast, by Type
- 7.5.5.2.2. Market size and forecast, by Product
- 7.5.5.2.3. Market size and forecast, by End-User
- 7.5.5.3. Colombia
- 7.5.5.3.1. Market size and forecast, by Type
- 7.5.5.3.2. Market size and forecast, by Product
- 7.5.5.3.3. Market size and forecast, by End-User
- 7.5.5.4. Rest of Latin America
- 7.5.5.4.1. Market size and forecast, by Type
- 7.5.5.4.2. Market size and forecast, by Product
- 7.5.5.4.3. Market size and forecast, by End-User
- 7.6. Middle East and Africa
- 7.6.1. Key market trends, growth factors and opportunities
- 7.6.2. Market size and forecast, by Type
- 7.6.3. Market size and forecast, by Product
- 7.6.4. Market size and forecast, by End-User
- 7.6.5. Market size and forecast, by country
- 7.6.5.1. UAE
- 7.6.5.1.1. Market size and forecast, by Type
- 7.6.5.1.2. Market size and forecast, by Product
- 7.6.5.1.3. Market size and forecast, by End-User
- 7.6.5.2. Saudi Arabia
- 7.6.5.2.1. Market size and forecast, by Type
- 7.6.5.2.2. Market size and forecast, by Product
- 7.6.5.2.3. Market size and forecast, by End-User
- 7.6.5.3. South Africa
- 7.6.5.3.1. Market size and forecast, by Type
- 7.6.5.3.2. Market size and forecast, by Product
- 7.6.5.3.3. Market size and forecast, by End-User
- 7.6.5.4. Nigeria
- 7.6.5.4.1. Market size and forecast, by Type
- 7.6.5.4.2. Market size and forecast, by Product
- 7.6.5.4.3. Market size and forecast, by End-User
- 7.6.5.5. Rest Of Middle East & Africa
- 7.6.5.5.1. Market size and forecast, by Type
- 7.6.5.5.2. Market size and forecast, by Product
- 7.6.5.5.3. Market size and forecast, by End-User
CHAPTER 8: COMPETITIVE LANDSCAPE
- 8.1. Introduction
- 8.2. Top winning strategies
- 8.3. Product mapping of top 10 player
- 8.4. Competitive dashboard
- 8.5. Competitive heatmap
- 8.6. Top player positioning, 2022
CHAPTER 9: COMPANY PROFILES
- 9.1. Adpearance, Inc.
- 9.1.1. Company overview
- 9.1.2. Key executives
- 9.1.3. Company snapshot
- 9.1.4. Operating business segments
- 9.1.5. Product portfolio
- 9.1.6. Business performance
- 9.1.7. Key strategic moves and developments
- 9.2. CMB Automotive Marketing Limited
- 9.2.1. Company overview
- 9.2.2. Key executives
- 9.2.3. Company snapshot
- 9.2.4. Operating business segments
- 9.2.5. Product portfolio
- 9.2.6. Business performance
- 9.2.7. Key strategic moves and developments
- 9.3. Force Marketing
- 9.3.1. Company overview
- 9.3.2. Key executives
- 9.3.3. Company snapshot
- 9.3.4. Operating business segments
- 9.3.5. Product portfolio
- 9.3.6. Business performance
- 9.3.7. Key strategic moves and developments
- 9.4. Google LLC by Alphabet Inc.
- 9.4.1. Company overview
- 9.4.2. Key executives
- 9.4.3. Company snapshot
- 9.4.4. Operating business segments
- 9.4.5. Product portfolio
- 9.4.6. Business performance
- 9.4.7. Key strategic moves and developments
- 9.5. HigherVisibility
- 9.5.1. Company overview
- 9.5.2. Key executives
- 9.5.3. Company snapshot
- 9.5.4. Operating business segments
- 9.5.5. Product portfolio
- 9.5.6. Business performance
- 9.5.7. Key strategic moves and developments
- 9.6. Microsoft Corporation
- 9.6.1. Company overview
- 9.6.2. Key executives
- 9.6.3. Company snapshot
- 9.6.4. Operating business segments
- 9.6.5. Product portfolio
- 9.6.6. Business performance
- 9.6.7. Key strategic moves and developments
- 9.7. Meta Platforms, Inc.
- 9.7.1. Company overview
- 9.7.2. Key executives
- 9.7.3. Company snapshot
- 9.7.4. Operating business segments
- 9.7.5. Product portfolio
- 9.7.6. Business performance
- 9.7.7. Key strategic moves and developments
- 9.8. Omnicom Group Inc.
- 9.8.1. Company overview
- 9.8.2. Key executives
- 9.8.3. Company snapshot
- 9.8.4. Operating business segments
- 9.8.5. Product portfolio
- 9.8.6. Business performance
- 9.8.7. Key strategic moves and developments
- 9.9. Social Media 55
- 9.9.1. Company overview
- 9.9.2. Key executives
- 9.9.3. Company snapshot
- 9.9.4. Operating business segments
- 9.9.5. Product portfolio
- 9.9.6. Business performance
- 9.9.7. Key strategic moves and developments
- 9.10. Visarc
- 9.10.1. Company overview
- 9.10.2. Key executives
- 9.10.3. Company snapshot
- 9.10.4. Operating business segments
- 9.10.5. Product portfolio
- 9.10.6. Business performance
- 9.10.7. Key strategic moves and developments
