
|
市場調査レポート
商品コード
1472366
3Dセキュアペイ認証の世界市場:コンポーネント別、用途別:機会分析と産業予測(2022年~2032年)3D Secure Pay Authentication Market By Component (Merchant Plug-In, Access Control Server, Others), By Application (Banks, Merchant and Payment Processors): Global Opportunity Analysis and Industry Forecast, 2022-2032 |
||||||
|
|||||||

| 3Dセキュアペイ認証の世界市場:コンポーネント別、用途別:機会分析と産業予測(2022年~2032年) |
|
出版日: 2024年03月01日
発行: Allied Market Research
ページ情報: 英文 400 Pages
納期: 2~3営業日
|

- 全表示
- 概要
- 図表
- 目次
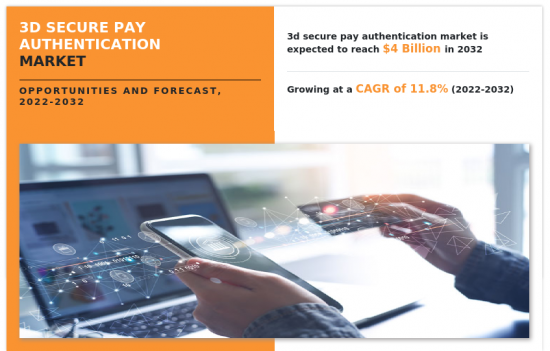
世界の3Dセキュアペイ認証の市場規模は、2022年に12億9,000万米ドルに達し、2023年~2032年にCAGR11.8%で成長し、2032年には39億6,000万米ドルに達すると予測されています。
3Dセキュアペイ認証は、オンライン・クレジットカードおよびデビットカード取引のセキュリティに追加レイヤーを提供します。3Dセキュアペイ認証は、オンライン購入時の不正カード利用や不正取引に関するリスクを軽減するために設計されています。さらに、消費者が3Dセキュア登録カードを使用してオンライン決済を行うと、通常、本人確認のためにカード発行会社の認証ページにリダイレクトされます。この認証プロセスでは、パスワードの入力、SMSや電子メールで送信されるワンタイムコード、または指紋認証や顔認証などの生体認証が行われます。顧客の身元が確認されると、取引が承認され、カード所有者と加盟店の両方のセキュリティが強化されます。3Dセキュアは、不正なカード使用を防止し、チャージバックを減らし、オンライン取引における信頼を築くのに役立ち、Eコマースに関わる消費者と企業の両方に利益をもたらします。
3Dセキュアペイ認証市場は、小売・Eコマース、銀行・金融サービス、旅行・ホスピタリティ、ゲーム・エンターテイメントなど、さまざまな業界別で利用されています。小売・Eコマースセグメントは、オンライン小売事業やEコマース・プラットフォームを対象としており、不正行為を防止し消費者の信頼を確保するために安全な決済認証方式を必要としています。銀行・金融サービスセグメントは、3Dセキュア認証ソリューションを決済処理システムに組み込む金融機関、銀行、決済処理業者を対象としています。旅行・ホスピタリティセグメントには、航空会社、ホテル、旅行代理店などが含まれ、予約や予約には安全なオンライン決済が不可欠です。ゲームおよびエンターテインメントセグメントでは、ゲーム内課金、サブスクリプション、デジタルコンテンツの安全な決済処理が求められます。
重要企業は、3Dセキュアペイメント認証業界で生き残り、競争するために様々な製品を発売しています。例えば、2023年12月、EntersektはModrium 3Dセキュアペイメント・ソリューションを買収し、世界展開を加速させています。Modirumは、25年の歴史を持つ、認証されたカードを提示しない決済を可能にするリーダー企業です。Modirumのクラウドベースの3Dセキュア(3DS)技術とサービスは、多数の決済システム、数百の発行体、数千の加盟店におけるデジタル決済トランザクションを世界に認証し、数億人のカード会員に対して3DSトランザクションを可能にしています。今回の買収により、エンターセクトは顧客基盤を拡大し、年間25億件以上の取引を保護することになり、魅力的な世界・フットプリントと、発行体、アクワイアラー、加盟店のデジタル、決済、データ・チャネルにまたがるソリューションという明確な技術的優位性を獲得することになります。さらに2023年12月、アメリカン・エキスプレス・カンパニーは、 Alexa/Siriでのショッピング体験をより安全にする保護ソリューションを発表しました。同社はSafeKey EMV 3-D Secure 2.3機能を開始しました。アメックスはSafeKey 2.3にアップグレードした最初のネットワークです。同社によると、この取り組みは、安全なチェックアウト体験を提供するという同社のコミットメントを強調するものだといいます。SafeKey 2.3を通じて、アメックスはゲーム機やスマートスピーカーなどのヘッドレスデバイスでの購入に対する保護を強化しています。また、生体認証のさらなるサポート、決済情報の強化、ユーザーインターフェースの改善も行っています。したがって、主要企業が採用するこうした戦略は、予測期間中の3Dセキュアペイ認証市場の成長を促進すると予想されます。
義務化された規制の増加と消費者の期待は、3Dセキュアペイ認証市場の成長を促進する主な要因です。決済プロセスにおける摩擦や互換性の問題の増加が、3Dセキュアペイ認証市場の成長を妨げ、Eコマース活動とデジタル取引の増加が、3Dセキュアペイ認証市場の成長に大きな機会を提供します。
世界の3Dセキュアペイ認証市場は、コンポーネント、用途、地域に区分されます。コンポーネント別では、マーチャントプラグイン、アクセスコントロールサーバー、その他に分けられます。用途別では、市場は銀行と加盟店・決済プロセッサーに分けられます。地域別では、3Dセキュアペイ認証市場は北米、欧州、アジア太平洋、ラテンアメリカ、中東・アフリカで調査されています。
利害関係者にとっての主なメリット
- 当レポートでは、2022年~2032年の3Dセキュアペイ認証市場分析の市場セグメント、現在の動向、推定・動向、力学を定量的に分析し、3Dセキュアペイ認証市場の有力な市場機会を特定します。
- 市場促進要因、市場抑制要因、市場機会に関連する情報とともに市場調査を提供します。
- ポーターのファイブフォース分析では、利害関係者が利益重視のビジネス決定を下し、サプライヤーとバイヤーのネットワークを強化できるよう、バイヤーとサプライヤーの潜在力を明らかにします。
- 3Dセキュアペイ認証市場のセグメンテーションを詳細に分析することで、市場機会を見極めることができます。
- 各地域の主要国は、世界市場への収益貢献度に応じてマッピングされています。
- 市場企業のポジショニングはベンチマーキングを容易にし、市場企業の現在のポジションを明確に理解することができます。
- 本レポートには、地域別および世界の3Dセキュアペイ認証市場動向、主要企業、市場セグメント、応用分野、市場成長戦略の分析が含まれています。
本レポートで可能なレポートカスタマイズ(追加費用とタイムラインに関しましては販売担当へご連絡ください)
- 投資機会
- 製品/セグメント別の企業の市場シェア分析
- 主な企業の新製品開発/製品マトリックス
- 規制ガイドライン
- 主要企業の詳細(所在地、連絡先、サプライヤー/ベンダーネットワークなどを含む、エクセル形式)
- 世界/地域/国別レベルでの企業の市場シェア分析
- SWOT分析
目次
第1章 イントロダクション
第2章 エグゼクティブサマリー
第3章 市場概要
- 市場の定義と範囲
- 主な調査結果
- 影響要因
- 主な投資機会
- ポーターのファイブフォース分析
- 市場力学
- 促進要因
- 抑制要因
- 機会
第4章 3Dセキュアペイ認証市場:コンポーネント別
- 概要
- マーチャントプラグイン
- アクセスコントロールサーバー
- その他
第5章 3Dセキュアペイ認証市場:用途別
- 概要
- 銀行
- 加盟店・決済プロセッサー
第6章 3Dセキュアペイ認証市場:地域別
- 概要
- 北米
- 米国
- カナダ
- 欧州
- 英国
- ドイツ
- フランス
- イタリア
- スペイン
- その他
- アジア太平洋
- 中国
- 日本
- インド
- オーストラリア
- 韓国
- その他
- ラテンアメリカ
- ブラジル
- アルゼンチン
- その他ラテンアメリカ
- 中東・アフリカ
- GCC諸国
- 南アフリカ
- その他中東・アフリカ
第7章 競合情勢
- イントロダクション
- 主要成功戦略
- 主要10社の製品マッピング
- 競合ダッシュボード
- 競合ヒートマップ
- 主要企業のポジショニング(2022年)
第8章 企業プロファイル
- Visa Inc.
- Mastercard, Inc.
- Broadcom, Inc.
- Fiserv, Inc.
- Marqeta, Inc.
- Modrium
- Entersekt
- PayU(Naspers)
- The American Express Company
- Discover Financial Services
LIST OF TABLES
- TABLE 01. GLOBAL 3D SECURE PAY AUTHENTICATION MARKET, BY COMPONENT, 2022-2032 ($MILLION)
- TABLE 02. 3D SECURE PAY AUTHENTICATION MARKET FOR MERCHANT PLUG-IN, BY REGION, 2022-2032 ($MILLION)
- TABLE 03. 3D SECURE PAY AUTHENTICATION MARKET FOR ACCESS CONTROL SERVER, BY REGION, 2022-2032 ($MILLION)
- TABLE 04. 3D SECURE PAY AUTHENTICATION MARKET FOR OTHERS, BY REGION, 2022-2032 ($MILLION)
- TABLE 05. GLOBAL 3D SECURE PAY AUTHENTICATION MARKET, BY APPLICATION, 2022-2032 ($MILLION)
- TABLE 06. 3D SECURE PAY AUTHENTICATION MARKET FOR BANKS, BY REGION, 2022-2032 ($MILLION)
- TABLE 07. 3D SECURE PAY AUTHENTICATION MARKET FOR MERCHANT AND PAYMENT PROCESSORS, BY REGION, 2022-2032 ($MILLION)
- TABLE 08. 3D SECURE PAY AUTHENTICATION MARKET, BY REGION, 2022-2032 ($MILLION)
- TABLE 09. NORTH AMERICA 3D SECURE PAY AUTHENTICATION MARKET, BY COMPONENT, 2022-2032 ($MILLION)
- TABLE 10. NORTH AMERICA 3D SECURE PAY AUTHENTICATION MARKET, BY APPLICATION, 2022-2032 ($MILLION)
- TABLE 11. NORTH AMERICA 3D SECURE PAY AUTHENTICATION MARKET, BY COUNTRY, 2022-2032 ($MILLION)
- TABLE 12. U.S. 3D SECURE PAY AUTHENTICATION MARKET, BY COMPONENT, 2022-2032 ($MILLION)
- TABLE 13. U.S. 3D SECURE PAY AUTHENTICATION MARKET, BY APPLICATION, 2022-2032 ($MILLION)
- TABLE 14. CANADA 3D SECURE PAY AUTHENTICATION MARKET, BY COMPONENT, 2022-2032 ($MILLION)
- TABLE 15. CANADA 3D SECURE PAY AUTHENTICATION MARKET, BY APPLICATION, 2022-2032 ($MILLION)
- TABLE 16. EUROPE 3D SECURE PAY AUTHENTICATION MARKET, BY COMPONENT, 2022-2032 ($MILLION)
- TABLE 17. EUROPE 3D SECURE PAY AUTHENTICATION MARKET, BY APPLICATION, 2022-2032 ($MILLION)
- TABLE 18. EUROPE 3D SECURE PAY AUTHENTICATION MARKET, BY COUNTRY, 2022-2032 ($MILLION)
- TABLE 19. UK 3D SECURE PAY AUTHENTICATION MARKET, BY COMPONENT, 2022-2032 ($MILLION)
- TABLE 20. UK 3D SECURE PAY AUTHENTICATION MARKET, BY APPLICATION, 2022-2032 ($MILLION)
- TABLE 21. GERMANY 3D SECURE PAY AUTHENTICATION MARKET, BY COMPONENT, 2022-2032 ($MILLION)
- TABLE 22. GERMANY 3D SECURE PAY AUTHENTICATION MARKET, BY APPLICATION, 2022-2032 ($MILLION)
- TABLE 23. FRANCE 3D SECURE PAY AUTHENTICATION MARKET, BY COMPONENT, 2022-2032 ($MILLION)
- TABLE 24. FRANCE 3D SECURE PAY AUTHENTICATION MARKET, BY APPLICATION, 2022-2032 ($MILLION)
- TABLE 25. ITALY 3D SECURE PAY AUTHENTICATION MARKET, BY COMPONENT, 2022-2032 ($MILLION)
- TABLE 26. ITALY 3D SECURE PAY AUTHENTICATION MARKET, BY APPLICATION, 2022-2032 ($MILLION)
- TABLE 27. SPAIN 3D SECURE PAY AUTHENTICATION MARKET, BY COMPONENT, 2022-2032 ($MILLION)
- TABLE 28. SPAIN 3D SECURE PAY AUTHENTICATION MARKET, BY APPLICATION, 2022-2032 ($MILLION)
- TABLE 29. REST OF EUROPE 3D SECURE PAY AUTHENTICATION MARKET, BY COMPONENT, 2022-2032 ($MILLION)
- TABLE 30. REST OF EUROPE 3D SECURE PAY AUTHENTICATION MARKET, BY APPLICATION, 2022-2032 ($MILLION)
- TABLE 31. ASIA-PACIFIC 3D SECURE PAY AUTHENTICATION MARKET, BY COMPONENT, 2022-2032 ($MILLION)
- TABLE 32. ASIA-PACIFIC 3D SECURE PAY AUTHENTICATION MARKET, BY APPLICATION, 2022-2032 ($MILLION)
- TABLE 33. ASIA-PACIFIC 3D SECURE PAY AUTHENTICATION MARKET, BY COUNTRY, 2022-2032 ($MILLION)
- TABLE 34. CHINA 3D SECURE PAY AUTHENTICATION MARKET, BY COMPONENT, 2022-2032 ($MILLION)
- TABLE 35. CHINA 3D SECURE PAY AUTHENTICATION MARKET, BY APPLICATION, 2022-2032 ($MILLION)
- TABLE 36. JAPAN 3D SECURE PAY AUTHENTICATION MARKET, BY COMPONENT, 2022-2032 ($MILLION)
- TABLE 37. JAPAN 3D SECURE PAY AUTHENTICATION MARKET, BY APPLICATION, 2022-2032 ($MILLION)
- TABLE 38. INDIA 3D SECURE PAY AUTHENTICATION MARKET, BY COMPONENT, 2022-2032 ($MILLION)
- TABLE 39. INDIA 3D SECURE PAY AUTHENTICATION MARKET, BY APPLICATION, 2022-2032 ($MILLION)
- TABLE 40. AUSTRALIA 3D SECURE PAY AUTHENTICATION MARKET, BY COMPONENT, 2022-2032 ($MILLION)
- TABLE 41. AUSTRALIA 3D SECURE PAY AUTHENTICATION MARKET, BY APPLICATION, 2022-2032 ($MILLION)
- TABLE 42. SOUTH KOREA 3D SECURE PAY AUTHENTICATION MARKET, BY COMPONENT, 2022-2032 ($MILLION)
- TABLE 43. SOUTH KOREA 3D SECURE PAY AUTHENTICATION MARKET, BY APPLICATION, 2022-2032 ($MILLION)
- TABLE 44. REST OF ASIA-PACIFIC 3D SECURE PAY AUTHENTICATION MARKET, BY COMPONENT, 2022-2032 ($MILLION)
- TABLE 45. REST OF ASIA-PACIFIC 3D SECURE PAY AUTHENTICATION MARKET, BY APPLICATION, 2022-2032 ($MILLION)
- TABLE 46. LATIN AMERICA 3D SECURE PAY AUTHENTICATION MARKET, BY COMPONENT, 2022-2032 ($MILLION)
- TABLE 47. LATIN AMERICA 3D SECURE PAY AUTHENTICATION MARKET, BY APPLICATION, 2022-2032 ($MILLION)
- TABLE 48. LATIN AMERICA 3D SECURE PAY AUTHENTICATION MARKET, BY COUNTRY, 2022-2032 ($MILLION)
- TABLE 49. BRAZIL 3D SECURE PAY AUTHENTICATION MARKET, BY COMPONENT, 2022-2032 ($MILLION)
- TABLE 50. BRAZIL 3D SECURE PAY AUTHENTICATION MARKET, BY APPLICATION, 2022-2032 ($MILLION)
- TABLE 51. ARGENTINA 3D SECURE PAY AUTHENTICATION MARKET, BY COMPONENT, 2022-2032 ($MILLION)
- TABLE 52. ARGENTINA 3D SECURE PAY AUTHENTICATION MARKET, BY APPLICATION, 2022-2032 ($MILLION)
- TABLE 53. REST OF LATIN AMERICA 3D SECURE PAY AUTHENTICATION MARKET, BY COMPONENT, 2022-2032 ($MILLION)
- TABLE 54. REST OF LATIN AMERICA 3D SECURE PAY AUTHENTICATION MARKET, BY APPLICATION, 2022-2032 ($MILLION)
- TABLE 55. MIDDLE EAST AND AFRICA 3D SECURE PAY AUTHENTICATION MARKET, BY COMPONENT, 2022-2032 ($MILLION)
- TABLE 56. MIDDLE EAST AND AFRICA 3D SECURE PAY AUTHENTICATION MARKET, BY APPLICATION, 2022-2032 ($MILLION)
- TABLE 57. MIDDLE EAST AND AFRICA 3D SECURE PAY AUTHENTICATION MARKET, BY COUNTRY, 2022-2032 ($MILLION)
- TABLE 58. GCC COUNTRIES 3D SECURE PAY AUTHENTICATION MARKET, BY COMPONENT, 2022-2032 ($MILLION)
- TABLE 59. GCC COUNTRIES 3D SECURE PAY AUTHENTICATION MARKET, BY APPLICATION, 2022-2032 ($MILLION)
- TABLE 60. SOUTH AFRICA 3D SECURE PAY AUTHENTICATION MARKET, BY COMPONENT, 2022-2032 ($MILLION)
- TABLE 61. SOUTH AFRICA 3D SECURE PAY AUTHENTICATION MARKET, BY APPLICATION, 2022-2032 ($MILLION)
- TABLE 62. REST OF MIDDLE EAST AND AFRICA 3D SECURE PAY AUTHENTICATION MARKET, BY COMPONENT, 2022-2032 ($MILLION)
- TABLE 63. REST OF MIDDLE EAST AND AFRICA 3D SECURE PAY AUTHENTICATION MARKET, BY APPLICATION, 2022-2032 ($MILLION)
- TABLE 64. VISA INC.: KEY EXECUTIVES
- TABLE 65. VISA INC.: COMPANY SNAPSHOT
- TABLE 66. VISA INC.: PRODUCT SEGMENTS
- TABLE 67. VISA INC.: SERVICE SEGMENTS
- TABLE 68. VISA INC.: PRODUCT PORTFOLIO
- TABLE 69. VISA INC.: KEY STRATERGIES
- TABLE 70. MASTERCARD, INC.: KEY EXECUTIVES
- TABLE 71. MASTERCARD, INC.: COMPANY SNAPSHOT
- TABLE 72. MASTERCARD, INC.: PRODUCT SEGMENTS
- TABLE 73. MASTERCARD, INC.: SERVICE SEGMENTS
- TABLE 74. MASTERCARD, INC.: PRODUCT PORTFOLIO
- TABLE 75. MASTERCARD, INC.: KEY STRATERGIES
- TABLE 76. BROADCOM, INC.: KEY EXECUTIVES
- TABLE 77. BROADCOM, INC.: COMPANY SNAPSHOT
- TABLE 78. BROADCOM, INC.: PRODUCT SEGMENTS
- TABLE 79. BROADCOM, INC.: SERVICE SEGMENTS
- TABLE 80. BROADCOM, INC.: PRODUCT PORTFOLIO
- TABLE 81. BROADCOM, INC.: KEY STRATERGIES
- TABLE 82. FISERV, INC.: KEY EXECUTIVES
- TABLE 83. FISERV, INC.: COMPANY SNAPSHOT
- TABLE 84. FISERV, INC.: PRODUCT SEGMENTS
- TABLE 85. FISERV, INC.: SERVICE SEGMENTS
- TABLE 86. FISERV, INC.: PRODUCT PORTFOLIO
- TABLE 87. FISERV, INC.: KEY STRATERGIES
- TABLE 88. MARQETA, INC.: KEY EXECUTIVES
- TABLE 89. MARQETA, INC.: COMPANY SNAPSHOT
- TABLE 90. MARQETA, INC.: PRODUCT SEGMENTS
- TABLE 91. MARQETA, INC.: SERVICE SEGMENTS
- TABLE 92. MARQETA, INC.: PRODUCT PORTFOLIO
- TABLE 93. MARQETA, INC.: KEY STRATERGIES
- TABLE 94. MODRIUM: KEY EXECUTIVES
- TABLE 95. MODRIUM: COMPANY SNAPSHOT
- TABLE 96. MODRIUM: PRODUCT SEGMENTS
- TABLE 97. MODRIUM: SERVICE SEGMENTS
- TABLE 98. MODRIUM: PRODUCT PORTFOLIO
- TABLE 99. MODRIUM: KEY STRATERGIES
- TABLE 100. ENTERSEKT: KEY EXECUTIVES
- TABLE 101. ENTERSEKT: COMPANY SNAPSHOT
- TABLE 102. ENTERSEKT: PRODUCT SEGMENTS
- TABLE 103. ENTERSEKT: SERVICE SEGMENTS
- TABLE 104. ENTERSEKT: PRODUCT PORTFOLIO
- TABLE 105. ENTERSEKT: KEY STRATERGIES
- TABLE 106. PAYU (NASPERS): KEY EXECUTIVES
- TABLE 107. PAYU (NASPERS): COMPANY SNAPSHOT
- TABLE 108. PAYU (NASPERS): PRODUCT SEGMENTS
- TABLE 109. PAYU (NASPERS): SERVICE SEGMENTS
- TABLE 110. PAYU (NASPERS): PRODUCT PORTFOLIO
- TABLE 111. PAYU (NASPERS): KEY STRATERGIES
- TABLE 112. THE AMERICAN EXPRESS COMPANY: KEY EXECUTIVES
- TABLE 113. THE AMERICAN EXPRESS COMPANY: COMPANY SNAPSHOT
- TABLE 114. THE AMERICAN EXPRESS COMPANY: PRODUCT SEGMENTS
- TABLE 115. THE AMERICAN EXPRESS COMPANY: SERVICE SEGMENTS
- TABLE 116. THE AMERICAN EXPRESS COMPANY: PRODUCT PORTFOLIO
- TABLE 117. THE AMERICAN EXPRESS COMPANY: KEY STRATERGIES
- TABLE 118. DISCOVER FINANCIAL SERVICES: KEY EXECUTIVES
- TABLE 119. DISCOVER FINANCIAL SERVICES: COMPANY SNAPSHOT
- TABLE 120. DISCOVER FINANCIAL SERVICES: PRODUCT SEGMENTS
- TABLE 121. DISCOVER FINANCIAL SERVICES: SERVICE SEGMENTS
- TABLE 122. DISCOVER FINANCIAL SERVICES: PRODUCT PORTFOLIO
- TABLE 123. DISCOVER FINANCIAL SERVICES: KEY STRATERGIES
LIST OF FIGURES
- FIGURE 01. 3D SECURE PAY AUTHENTICATION MARKET, 2022-2032
- FIGURE 02. SEGMENTATION OF 3D SECURE PAY AUTHENTICATION MARKET,2022-2032
- FIGURE 03. TOP IMPACTING FACTORS IN 3D SECURE PAY AUTHENTICATION MARKET
- FIGURE 04. TOP INVESTMENT POCKETS IN 3D SECURE PAY AUTHENTICATION MARKET (2022-2032)
- FIGURE 05. BARGAINING POWER OF SUPPLIERS
- FIGURE 06. BARGAINING POWER OF BUYERS
- FIGURE 07. THREAT OF SUBSTITUTION
- FIGURE 08. THREAT OF SUBSTITUTION
- FIGURE 09. COMPETITIVE RIVALRY
- FIGURE 10. GLOBAL 3D SECURE PAY AUTHENTICATION MARKET:DRIVERS, RESTRAINTS AND OPPORTUNITIES
- FIGURE 11. 3D SECURE PAY AUTHENTICATION MARKET, BY COMPONENT, 2022 AND 2032(%)
- FIGURE 12. COMPARATIVE SHARE ANALYSIS OF 3D SECURE PAY AUTHENTICATION MARKET FOR MERCHANT PLUG-IN, BY COUNTRY 2022 AND 2032(%)
- FIGURE 13. COMPARATIVE SHARE ANALYSIS OF 3D SECURE PAY AUTHENTICATION MARKET FOR ACCESS CONTROL SERVER, BY COUNTRY 2022 AND 2032(%)
- FIGURE 14. COMPARATIVE SHARE ANALYSIS OF 3D SECURE PAY AUTHENTICATION MARKET FOR OTHERS, BY COUNTRY 2022 AND 2032(%)
- FIGURE 15. 3D SECURE PAY AUTHENTICATION MARKET, BY APPLICATION, 2022 AND 2032(%)
- FIGURE 16. COMPARATIVE SHARE ANALYSIS OF 3D SECURE PAY AUTHENTICATION MARKET FOR BANKS, BY COUNTRY 2022 AND 2032(%)
- FIGURE 17. COMPARATIVE SHARE ANALYSIS OF 3D SECURE PAY AUTHENTICATION MARKET FOR MERCHANT AND PAYMENT PROCESSORS, BY COUNTRY 2022 AND 2032(%)
- FIGURE 18. 3D SECURE PAY AUTHENTICATION MARKET BY REGION, 2022 AND 2032(%)
- FIGURE 19. U.S. 3D SECURE PAY AUTHENTICATION MARKET, 2022-2032 ($MILLION)
- FIGURE 20. CANADA 3D SECURE PAY AUTHENTICATION MARKET, 2022-2032 ($MILLION)
- FIGURE 21. UK 3D SECURE PAY AUTHENTICATION MARKET, 2022-2032 ($MILLION)
- FIGURE 22. GERMANY 3D SECURE PAY AUTHENTICATION MARKET, 2022-2032 ($MILLION)
- FIGURE 23. FRANCE 3D SECURE PAY AUTHENTICATION MARKET, 2022-2032 ($MILLION)
- FIGURE 24. ITALY 3D SECURE PAY AUTHENTICATION MARKET, 2022-2032 ($MILLION)
- FIGURE 25. SPAIN 3D SECURE PAY AUTHENTICATION MARKET, 2022-2032 ($MILLION)
- FIGURE 26. REST OF EUROPE 3D SECURE PAY AUTHENTICATION MARKET, 2022-2032 ($MILLION)
- FIGURE 27. CHINA 3D SECURE PAY AUTHENTICATION MARKET, 2022-2032 ($MILLION)
- FIGURE 28. JAPAN 3D SECURE PAY AUTHENTICATION MARKET, 2022-2032 ($MILLION)
- FIGURE 29. INDIA 3D SECURE PAY AUTHENTICATION MARKET, 2022-2032 ($MILLION)
- FIGURE 30. AUSTRALIA 3D SECURE PAY AUTHENTICATION MARKET, 2022-2032 ($MILLION)
- FIGURE 31. SOUTH KOREA 3D SECURE PAY AUTHENTICATION MARKET, 2022-2032 ($MILLION)
- FIGURE 32. REST OF ASIA-PACIFIC 3D SECURE PAY AUTHENTICATION MARKET, 2022-2032 ($MILLION)
- FIGURE 33. BRAZIL 3D SECURE PAY AUTHENTICATION MARKET, 2022-2032 ($MILLION)
- FIGURE 34. ARGENTINA 3D SECURE PAY AUTHENTICATION MARKET, 2022-2032 ($MILLION)
- FIGURE 35. REST OF LATIN AMERICA 3D SECURE PAY AUTHENTICATION MARKET, 2022-2032 ($MILLION)
- FIGURE 36. GCC COUNTRIES 3D SECURE PAY AUTHENTICATION MARKET, 2022-2032 ($MILLION)
- FIGURE 37. SOUTH AFRICA 3D SECURE PAY AUTHENTICATION MARKET, 2022-2032 ($MILLION)
- FIGURE 38. REST OF MIDDLE EAST AND AFRICA 3D SECURE PAY AUTHENTICATION MARKET, 2022-2032 ($MILLION)
- FIGURE 39. TOP WINNING STRATEGIES, BY YEAR
- FIGURE 40. TOP WINNING STRATEGIES, BY DEVELOPMENT
- FIGURE 41. TOP WINNING STRATEGIES, BY COMPANY
- FIGURE 42. PRODUCT MAPPING OF TOP 10 PLAYERS
- FIGURE 43. COMPETITIVE DASHBOARD
- FIGURE 44. COMPETITIVE HEATMAP: 3D SECURE PAY AUTHENTICATION MARKET
- FIGURE 45. TOP PLAYER POSITIONING, 2022
The 3D secure pay authentication market size was valued at $1.29 billion in 2022 and is projected to reach $3.96 billion by 2032, growing at a CAGR of 11.8% from 2023 to 2032.
3D secure pay authentication provides an additional layer for the security of online credit and debit card transactions. The 3D secure pay authentication is designed for reducing risk in relation to utilization of unauthorized card and fraud transactions during the online purchase. In addition, when a consumer makes an online payment by using a 3D secure enrolled card, that is typically redirected for card issuer's authentication page for identity verification. The verification process involves the password entry, one time code sent via SMS or email, or biometric authentication such as fingerprint or facial recognition. Once the customer's identity is confirmed, the transaction is authorized, providing increased security for both the cardholder and the merchant. 3D secure helps to prevent unauthorized card usage, reduce chargebacks, and build trust in online transactions, benefiting both consumers and businesses involved in e-commerce.
3D secure pay authentication market serves various industry verticals such as retail and e-commerce, banking and financial services, travel and hospitality, gaming and entertainment. Retail & e-commerce segment involves online retail businesses and e-commerce platforms that require secure payment authentication method for preventing fraud and ensuring consumer trust. Banking and Financial Services segment targets financial institutions, banks, and payment processors integrating 3D secure authentication solutions into their payment processing systems. Travel and hospitality segment includes airlines, hotels, and travel agencies, where secure online payments are essential for booking and reservations. Gaming and entertainment segment requires secure payment processing for in-game purchases, subscriptions, and digital content.
Important players are launching various products to survive and compete in 3D secure pay authentication industry. For instance, in December 2023, Entersekt acquired Modrium 3D secure payment solutions to accelerate global expansion. Modirum is a leader in enabling authenticated, card-not-present payments with a history dating back 25 years. Modirum's cloud-based 3-D secure (3DS) technologies and services authenticate digital payment transactions globally in numerous payment systems, hundreds of issuers, and thousands of merchants, as well as enable 3DS transactions for hundreds of millions of cardholders. With this acquisition, Entersekt will expand its customer base and will secure over 2.5 billion transactions per year, giving it a compelling global footprint and a clear technology advantage of a solution spanning across digital, payment and data channels of issuers, acquirers, and merchants. Furthermore, in December 2023, The American Express Company launched protection solutions making shopping experience on Alexa/ Siri more safer. The company launched SafeKey EMV 3-D Secure 2.3 capabilities. Amex is the first network to upgrade to SafeKey 2.3. It says that the initiative underscores its commitment to providing a secure checkout experience. Through SafeKey 2.3, Amex is offering enhanced protection for purchases on gaming consoles and headless devices, such as smart speakers. It is also offering further biometric support, enhanced payment information, and user interface improvements. Therefore, such strategies adopted by key players are expected to propel the growth of 3D secure pay authentication market for the forecast period.
Growing mandatory regulations and consumer expectations are the main significant factors driving the growth of 3D secure pay authentication market. Rising friction and compatibility issues during the payment process to hamper the 3D secure pay authentication market growth. Increasing e-commerce activities and digital transactions to provide significant opportunity for 3D secure pay authentication market growth.
The global 3D secure pay authentication market is segmented into component, application, and region. By component, the market is divided into merchant plug-in, access control server, and others. By application, the market is divided into banks and merchant & payment processors. Region-wise, the 3D secure pay authentication market is studied across North America, Europe, Asia-Pacific, Latin America, Middle East and Africa.
Competitive analysis and profiles of the major players in the 3D secure pay authentication market include Visa Inc., Mastercard Inc., Broadcom Inc., Fiserv Inc., Marqeta Inc., Modrium, Entersekt, PayU (Naspers), The American Express Company, and Discover Financial Services. These players have adopted various strategies to increase their market penetration and strengthen their position in the 3D secure pay authentication industry.
Key Benefits For Stakeholders
- This report provides a quantitative analysis of the market segments, current trends, estimations, and dynamics of the 3D secure pay authentication market analysis from 2022 to 2032 to identify the prevailing 3D secure pay authentication market opportunities.
- The market research is offered along with information related to key drivers, restraints, and opportunities.
- Porter's five forces analysis highlights the potency of buyers and suppliers to enable stakeholders make profit-oriented business decisions and strengthen their supplier-buyer network.
- In-depth analysis of the 3D secure pay authentication market segmentation assists to determine the prevailing market opportunities.
- Major countries in each region are mapped according to their revenue contribution to the global market.
- Market player positioning facilitates benchmarking and provides a clear understanding of the present position of the market players.
- The report includes the analysis of the regional as well as global 3D secure pay authentication market trends, key players, market segments, application areas, and market growth strategies.
Additional benefits you will get with this purchase are:
- Quarterly Update and* (only available with a corporate license, on listed price)
- 5 additional Company Profile of client Choice pre- or Post-purchase, as a free update.
- Free Upcoming Version on the Purchase of Five and Enterprise User License.
- 16 analyst hours of support* (post-purchase, if you find additional data requirements upon review of the report, you may receive support amounting to 16 analyst hours to solve questions, and post-sale queries)
- 15% Free Customization* (in case the scope or segment of the report does not match your requirements, 15% is equivalent to 3 working days of free work, applicable once)
- Free data Pack on the Five and Enterprise User License. (Excel version of the report)
- Free Updated report if the report is 6-12 months old or older.
- 24-hour priority response*
- Free Industry updates and white papers.
Possible Customization with this report (with additional cost and timeline, please talk to the sales executive to know more)
- Investment Opportunities
- Market share analysis of players by products/segments
- New Product Development/ Product Matrix of Key Players
- Regulatory Guidelines
- Key player details (including location, contact details, supplier/vendor network etc. in excel format)
- Market share analysis of players at global/region/country level
- SWOT Analysis
Key Market Segments
By Component
- Merchant Plug-In
- Access Control Server
- Others
By Application
- Banks
- Merchant and Payment Processors
By Region
- North America
- U.S.
- Canada
- Europe
- UK
- Germany
- France
- Italy
- Spain
- Rest of Europe
- Asia-Pacific
- China
- Japan
- India
- Australia
- South Korea
- Rest of Asia-Pacific
- Latin America
- Brazil
- Argentina
- Rest of Latin America
- Middle East and Africa
- Gcc Countries
- South Africa
- Rest of Middle East And Africa
Key Market Players:
- Visa Inc.
- Mastercard, Inc.
- Broadcom, Inc.
- Fiserv, Inc.
- Marqeta, Inc.
- Modrium
- Entersekt
- PayU (Naspers)
- The American Express Company
- Discover Financial Services
TABLE OF CONTENTS
CHAPTER 1: INTRODUCTION
- 1.1. Report description
- 1.2. Key market segments
- 1.3. Key benefits to the stakeholders
- 1.4. Research methodology
- 1.4.1. Primary research
- 1.4.2. Secondary research
- 1.4.3. Analyst tools and models
CHAPTER 2: EXECUTIVE SUMMARY
- 2.1. CXO perspective
CHAPTER 3: MARKET OVERVIEW
- 3.1. Market definition and scope
- 3.2. Key findings
- 3.2.1. Top impacting factors
- 3.2.2. Top investment pockets
- 3.3. Porter's five forces analysis
- 3.4. Market dynamics
- 3.4.1. Drivers
- 3.4.2. Restraints
- 3.4.3. Opportunities
CHAPTER 4: 3D SECURE PAY AUTHENTICATION MARKET, BY COMPONENT
- 4.1. Overview
- 4.1.1. Market size and forecast
- 4.2. Merchant Plug-In
- 4.2.1. Key market trends, growth factors and opportunities
- 4.2.2. Market size and forecast, by region
- 4.2.3. Market share analysis by country
- 4.3. Access Control Server
- 4.3.1. Key market trends, growth factors and opportunities
- 4.3.2. Market size and forecast, by region
- 4.3.3. Market share analysis by country
- 4.4. Others
- 4.4.1. Key market trends, growth factors and opportunities
- 4.4.2. Market size and forecast, by region
- 4.4.3. Market share analysis by country
CHAPTER 5: 3D SECURE PAY AUTHENTICATION MARKET, BY APPLICATION
- 5.1. Overview
- 5.1.1. Market size and forecast
- 5.2. Banks
- 5.2.1. Key market trends, growth factors and opportunities
- 5.2.2. Market size and forecast, by region
- 5.2.3. Market share analysis by country
- 5.3. Merchant and Payment Processors
- 5.3.1. Key market trends, growth factors and opportunities
- 5.3.2. Market size and forecast, by region
- 5.3.3. Market share analysis by country
CHAPTER 6: 3D SECURE PAY AUTHENTICATION MARKET, BY REGION
- 6.1. Overview
- 6.1.1. Market size and forecast By Region
- 6.2. North America
- 6.2.1. Key market trends, growth factors and opportunities
- 6.2.2. Market size and forecast, by Component
- 6.2.3. Market size and forecast, by Application
- 6.2.4. Market size and forecast, by country
- 6.2.4.1. U.S.
- 6.2.4.1.1. Market size and forecast, by Component
- 6.2.4.1.2. Market size and forecast, by Application
- 6.2.4.2. Canada
- 6.2.4.2.1. Market size and forecast, by Component
- 6.2.4.2.2. Market size and forecast, by Application
- 6.3. Europe
- 6.3.1. Key market trends, growth factors and opportunities
- 6.3.2. Market size and forecast, by Component
- 6.3.3. Market size and forecast, by Application
- 6.3.4. Market size and forecast, by country
- 6.3.4.1. UK
- 6.3.4.1.1. Market size and forecast, by Component
- 6.3.4.1.2. Market size and forecast, by Application
- 6.3.4.2. Germany
- 6.3.4.2.1. Market size and forecast, by Component
- 6.3.4.2.2. Market size and forecast, by Application
- 6.3.4.3. France
- 6.3.4.3.1. Market size and forecast, by Component
- 6.3.4.3.2. Market size and forecast, by Application
- 6.3.4.4. Italy
- 6.3.4.4.1. Market size and forecast, by Component
- 6.3.4.4.2. Market size and forecast, by Application
- 6.3.4.5. Spain
- 6.3.4.5.1. Market size and forecast, by Component
- 6.3.4.5.2. Market size and forecast, by Application
- 6.3.4.6. Rest of Europe
- 6.3.4.6.1. Market size and forecast, by Component
- 6.3.4.6.2. Market size and forecast, by Application
- 6.4. Asia-Pacific
- 6.4.1. Key market trends, growth factors and opportunities
- 6.4.2. Market size and forecast, by Component
- 6.4.3. Market size and forecast, by Application
- 6.4.4. Market size and forecast, by country
- 6.4.4.1. China
- 6.4.4.1.1. Market size and forecast, by Component
- 6.4.4.1.2. Market size and forecast, by Application
- 6.4.4.2. Japan
- 6.4.4.2.1. Market size and forecast, by Component
- 6.4.4.2.2. Market size and forecast, by Application
- 6.4.4.3. India
- 6.4.4.3.1. Market size and forecast, by Component
- 6.4.4.3.2. Market size and forecast, by Application
- 6.4.4.4. Australia
- 6.4.4.4.1. Market size and forecast, by Component
- 6.4.4.4.2. Market size and forecast, by Application
- 6.4.4.5. South Korea
- 6.4.4.5.1. Market size and forecast, by Component
- 6.4.4.5.2. Market size and forecast, by Application
- 6.4.4.6. Rest of Asia-Pacific
- 6.4.4.6.1. Market size and forecast, by Component
- 6.4.4.6.2. Market size and forecast, by Application
- 6.5. Latin America
- 6.5.1. Key market trends, growth factors and opportunities
- 6.5.2. Market size and forecast, by Component
- 6.5.3. Market size and forecast, by Application
- 6.5.4. Market size and forecast, by country
- 6.5.4.1. Brazil
- 6.5.4.1.1. Market size and forecast, by Component
- 6.5.4.1.2. Market size and forecast, by Application
- 6.5.4.2. Argentina
- 6.5.4.2.1. Market size and forecast, by Component
- 6.5.4.2.2. Market size and forecast, by Application
- 6.5.4.3. Rest of Latin America
- 6.5.4.3.1. Market size and forecast, by Component
- 6.5.4.3.2. Market size and forecast, by Application
- 6.6. Middle East and Africa
- 6.6.1. Key market trends, growth factors and opportunities
- 6.6.2. Market size and forecast, by Component
- 6.6.3. Market size and forecast, by Application
- 6.6.4. Market size and forecast, by country
- 6.6.4.1. Gcc Countries
- 6.6.4.1.1. Market size and forecast, by Component
- 6.6.4.1.2. Market size and forecast, by Application
- 6.6.4.2. South Africa
- 6.6.4.2.1. Market size and forecast, by Component
- 6.6.4.2.2. Market size and forecast, by Application
- 6.6.4.3. Rest of Middle East And Africa
- 6.6.4.3.1. Market size and forecast, by Component
- 6.6.4.3.2. Market size and forecast, by Application
CHAPTER 7: COMPETITIVE LANDSCAPE
- 7.1. Introduction
- 7.2. Top winning strategies
- 7.3. Product mapping of top 10 player
- 7.4. Competitive dashboard
- 7.5. Competitive heatmap
- 7.6. Top player positioning, 2022
CHAPTER 8: COMPANY PROFILES
- 8.1. Visa Inc.
- 8.1.1. Company overview
- 8.1.2. Key executives
- 8.1.3. Company snapshot
- 8.1.4. Operating business segments
- 8.1.5. Product portfolio
- 8.1.6. Business performance
- 8.1.7. Key strategic moves and developments
- 8.2. Mastercard, Inc.
- 8.2.1. Company overview
- 8.2.2. Key executives
- 8.2.3. Company snapshot
- 8.2.4. Operating business segments
- 8.2.5. Product portfolio
- 8.2.6. Business performance
- 8.2.7. Key strategic moves and developments
- 8.3. Broadcom, Inc.
- 8.3.1. Company overview
- 8.3.2. Key executives
- 8.3.3. Company snapshot
- 8.3.4. Operating business segments
- 8.3.5. Product portfolio
- 8.3.6. Business performance
- 8.3.7. Key strategic moves and developments
- 8.4. Fiserv, Inc.
- 8.4.1. Company overview
- 8.4.2. Key executives
- 8.4.3. Company snapshot
- 8.4.4. Operating business segments
- 8.4.5. Product portfolio
- 8.4.6. Business performance
- 8.4.7. Key strategic moves and developments
- 8.5. Marqeta, Inc.
- 8.5.1. Company overview
- 8.5.2. Key executives
- 8.5.3. Company snapshot
- 8.5.4. Operating business segments
- 8.5.5. Product portfolio
- 8.5.6. Business performance
- 8.5.7. Key strategic moves and developments
- 8.6. Modrium
- 8.6.1. Company overview
- 8.6.2. Key executives
- 8.6.3. Company snapshot
- 8.6.4. Operating business segments
- 8.6.5. Product portfolio
- 8.6.6. Business performance
- 8.6.7. Key strategic moves and developments
- 8.7. Entersekt
- 8.7.1. Company overview
- 8.7.2. Key executives
- 8.7.3. Company snapshot
- 8.7.4. Operating business segments
- 8.7.5. Product portfolio
- 8.7.6. Business performance
- 8.7.7. Key strategic moves and developments
- 8.8. PayU (Naspers)
- 8.8.1. Company overview
- 8.8.2. Key executives
- 8.8.3. Company snapshot
- 8.8.4. Operating business segments
- 8.8.5. Product portfolio
- 8.8.6. Business performance
- 8.8.7. Key strategic moves and developments
- 8.9. The American Express Company
- 8.9.1. Company overview
- 8.9.2. Key executives
- 8.9.3. Company snapshot
- 8.9.4. Operating business segments
- 8.9.5. Product portfolio
- 8.9.6. Business performance
- 8.9.7. Key strategic moves and developments
- 8.10. Discover Financial Services
- 8.10.1. Company overview
- 8.10.2. Key executives
- 8.10.3. Company snapshot
- 8.10.4. Operating business segments
- 8.10.5. Product portfolio
- 8.10.6. Business performance
- 8.10.7. Key strategic moves and developments
