|
|
市場調査レポート
商品コード
1472325
ワイヤレス接続の世界市場:技術別、用途別:機会分析と産業予測(2023年~2032年)Wireless Connectivity Market By Technology, By Application : Global Opportunity Analysis and Industry Forecast, 2023-2032 |
||||||
|
|
|||||||
|
|||||||


| ワイヤレス接続の世界市場:技術別、用途別:機会分析と産業予測(2023年~2032年) |
|
出版日: 2024年03月01日
発行: Allied Market Research
ページ情報: 英文 250 Pages
納期: 2~3営業日
|

- 全表示
- 概要
- 図表
- 目次
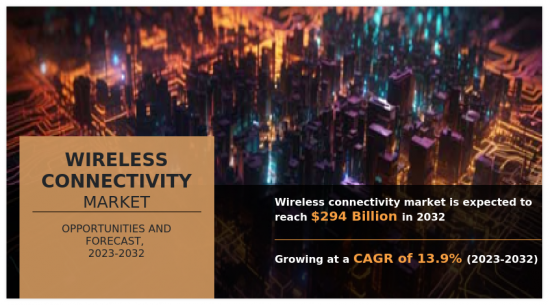
世界のワイヤレス接続の市場規模は、2022年に804億米ドルに達し、2023年~2032年にCAGR13.89%で成長し、2032年には2,940億米ドルに達すると予測されています。
ワイヤレス接続は、物理的な配線の制約を受けずにシームレスな通信とデータ交換を可能にする能力により、現代生活において極めて重要です。ワイヤレス接続は移動性を可能にし、ユーザーは移動中でも接続を維持できます。ワイヤレス技術は、通信、ヘルスケア、輸送、エンターテインメントなど、さまざまな分野で重要な役割を果たしています。デバイス間の接続を可能にすることで、IoTデバイス、スマートホーム、産業オートメーションに力を与えます。さらに、ワイヤレス接続は、スマートフォンでのインターネット閲覧から遠隔ヘルスケア環境でのバイタルサインのモニタリングまで、日常業務の生産性、効率性、利便性を向上させています。
ワイヤレス接続は、さまざまな分野で幅広く応用されています。家電は重要なエンドユーザーであり、スマートフォン、タブレット、ノートパソコン、スマートホームデバイスは、シームレスなインターネットアクセスとデータ交換のためにワイヤレス接続に大きく依存しています。ヘルスケアでは、医療用ウェアラブル、遠隔患者モニタリングシステム、遠隔医療ソリューションが、リアルタイムの健康モニタリングと通信にワイヤレス接続を活用しています。自動車産業では、インフォテインメント・システム、GPSナビゲーション、テレマティックス、車車間通信などの機能で、コネクテッドカーにワイヤレス接続を活用しています。産業オートメーションでは、ワイヤレスセンサー、アクチュエーター、制御システムによって遠隔監視と自動化が可能になり、製造業や産業環境の効率が向上します。さらに、ワイヤレス接続はスマートシティの発展に貢献し、公共インフラや公益事業におけるスマート照明、交通管理、環境モニタリングなどの用途を促進します。
ワイヤレス技術の進歩がワイヤレス接続市場の拡大を後押ししています。こうした進歩は絶えず限界を押し広げ、データ速度の高速化、通信距離の拡大、信頼性の向上、エネルギー効率の改善を実現しています。例えば、Wi-Fi 6(802.11ax)のようなWi-Fi規格の進歩は、帯域幅ニーズの高まりに対応するため、より高速で堅牢なワイヤレス接続を提供します。同様に、ブルートゥース・ロー・エナジー(BLE)の強化は、IoTデバイス、ウェアラブル、スマートホーム用途向けのワイヤレス通信機能を拡張し、業界全体への採用を促進しています。さらに、5Gなどの新技術は、超高速通信、最小限の待ち時間、広範なデバイス接続を提供し、ワイヤレス接続分野の革新と成長の道を開くことで、ワイヤレス接続の変革を約束します。
しかし、ワイヤレス接続市場の成長には、セキュリティ上の懸念が大きな障害となっています。ワイヤレスネットワークは、データ漏洩や不正アクセスといったサイバー脅威の影響を受けやすいため、その利用に対する信頼が損なわれています。組織は、機密データやインフラが危険にさらされることを恐れ、ワイヤレスソリューションの採用をためらっています。さらに、ワイヤレスネットワークのセキュリティ確保は複雑さを増し、運用コストを増大させます。その結果、企業や消費者は有線の代替手段を選んだり、ワイヤレス技術の利用を制限したりして、市場の拡大を妨げています。こうした懸念に対処するには、ワイヤレス通信を保護するための強固な暗号化、認証プロトコル、セキュリティ対策を導入する必要があります。こうした障害を克服することは、信頼を築き、普及を促進し、ワイヤレス接続の可能性を最大限に実現する上で極めて重要です。
ワイヤレス接続市場の主な目的は、物理的なケーブルの制約を受けずに、機器間のスムーズな通信とデータ転送を可能にすることです。この市場は、家電、ヘルスケア、自動車、産業オートメーション、スマートシティなど、さまざまな分野で信頼性が高く効果的な接続ソリューションを提供することに努めています。ワイヤレス接続を促進することで、移動性、柔軟性、ユーザーの利便性が向上し、多様な環境での接続と生産性の維持が可能になります。さらに、ワイヤレス接続市場は、ワイヤレス技術の革新を推進し、より高速なデータ速度、信頼性の向上、高度なセキュリティ機能を提供することで、進化するユーザーとビジネスの要件を満たすことを目指しています。最終的には、シームレスな相互作用とデータ共有を促進する相互接続エコシステムを構築し、コミュニケーション、コラボレーション、業務効率の改善の道を開くことを目的としています。
ワイヤレス接続市場は、技術、用途、地域によって区分されます。技術別では、市場はWifi、Bluetooth、Zigbee、NFC、セルラー、その他に区分されます。用途別では、家電、自動車、航空宇宙・防衛、ヘルスケア、IT・通信、その他に分類されます。
地域別では、北米(米国、カナダ、メキシコ)、欧州(英国、ドイツ、フランス、その他欧州)、アジア太平洋(中国、日本、インド、韓国、東南アジア、その他アジア太平洋)、ラテンアメリカ(ブラジル、アルゼンチン、その他ラテンアメリカ)、中東・アフリカ(アラブ首長国連邦、サウジアラビア、その他中東・アフリカ)で分析しています。
本レポートで可能なレポートカスタマイズ(追加費用とタイムラインに関しましては販売担当へご連絡ください)
- 製品ライフサイクル
- 消費者の嗜好と製品仕様
- 主要企業の新製品開発/製品マトリックス
- 顧客の関心に応じた追加企業プロファイル
- 主要企業の詳細(所在地、連絡先、サプライヤー/ベンダーネットワークなどを含む、エクセル形式)
- SWOT分析
目次
第1章 イントロダクション
第2章 エグゼクティブサマリー
第3章 市場概要
- 市場の定義と範囲
- 主な調査結果
- 影響要因
- 主な投資機会
- ポーターのファイブフォース分析
- 市場力学
- 促進要因
- 抑制要因
- 機会
第4章 ワイヤレス接続市場:技術別
- 概要
- Wi-Fi
- Bluetooth
- Zigbee
- NFC
- セルラー
- その他
第5章 ワイヤレス接続市場:用途別
- 概要
- 家電
- 自動車
- 航空宇宙・防衛
- ヘルスケア
- IT・通信
- その他
第6章 ワイヤレス接続市場:地域別
- 概要
- 北米
- 米国
- カナダ
- メキシコ
- 欧州
- 英国
- ドイツ
- フランス
- その他欧州
- アジア太平洋
- 中国
- 日本
- インド
- 韓国
- 東南アジア
- その他アジア太平洋
- ラテンアメリカ
- ブラジル
- アルゼンチン
- その他ラテンアメリカ
- 中東・アフリカ
- アラブ首長国連邦
- サウジアラビア
- その他中東・アフリカ
第7章 競合情勢
- イントロダクション
- 主要成功戦略
- 主要10社の製品マッピング
- 競合ダッシュボード
- 競合ヒートマップ
- 主要企業のポジショニング(2022年)
第8章 企業プロファイル
- Qualcomm Incorporated.
- Broadcom Inc.
- Intel Corporation
- MediaTek Inc.
- Texas Instruments Incorporated
- Infineon Technologies AG
- NXP Semiconductors N.V.
- Murata Manufacturing Co., Ltd.
- Microchip Technology Inc.
- STMicroelectronics N.V.
LIST OF TABLES
- TABLE 01. GLOBAL WIRELESS CONNECTIVITY MARKET, BY TECHNOLOGY, 2022-2032 ($MILLION)
- TABLE 02. WIRELESS CONNECTIVITY MARKET FOR WI-FI, BY REGION, 2022-2032 ($MILLION)
- TABLE 03. WIRELESS CONNECTIVITY MARKET FOR BLUETOOTH, BY REGION, 2022-2032 ($MILLION)
- TABLE 04. WIRELESS CONNECTIVITY MARKET FOR ZIGBEE, BY REGION, 2022-2032 ($MILLION)
- TABLE 05. WIRELESS CONNECTIVITY MARKET FOR NFC, BY REGION, 2022-2032 ($MILLION)
- TABLE 06. WIRELESS CONNECTIVITY MARKET FOR CELLULAR, BY REGION, 2022-2032 ($MILLION)
- TABLE 07. WIRELESS CONNECTIVITY MARKET FOR OTHERS, BY REGION, 2022-2032 ($MILLION)
- TABLE 08. GLOBAL WIRELESS CONNECTIVITY MARKET, BY APPLICATION, 2022-2032 ($MILLION)
- TABLE 09. WIRELESS CONNECTIVITY MARKET FOR CONSUMER ELECTRONICS, BY REGION, 2022-2032 ($MILLION)
- TABLE 10. WIRELESS CONNECTIVITY MARKET FOR AUTOMOTIVE, BY REGION, 2022-2032 ($MILLION)
- TABLE 11. WIRELESS CONNECTIVITY MARKET FOR AEROSPACE AND DEFENSE, BY REGION, 2022-2032 ($MILLION)
- TABLE 12. WIRELESS CONNECTIVITY MARKET FOR HEALTHCARE, BY REGION, 2022-2032 ($MILLION)
- TABLE 13. WIRELESS CONNECTIVITY MARKET FOR IT AND TELECOM, BY REGION, 2022-2032 ($MILLION)
- TABLE 14. WIRELESS CONNECTIVITY MARKET FOR OTHERS, BY REGION, 2022-2032 ($MILLION)
- TABLE 15. WIRELESS CONNECTIVITY MARKET, BY REGION, 2022-2032 ($MILLION)
- TABLE 16. NORTH AMERICA WIRELESS CONNECTIVITY MARKET, BY TECHNOLOGY, 2022-2032 ($MILLION)
- TABLE 17. NORTH AMERICA WIRELESS CONNECTIVITY MARKET, BY APPLICATION, 2022-2032 ($MILLION)
- TABLE 18. NORTH AMERICA WIRELESS CONNECTIVITY MARKET, BY COUNTRY, 2022-2032 ($MILLION)
- TABLE 19. U.S. WIRELESS CONNECTIVITY MARKET, BY TECHNOLOGY, 2022-2032 ($MILLION)
- TABLE 20. U.S. WIRELESS CONNECTIVITY MARKET, BY APPLICATION, 2022-2032 ($MILLION)
- TABLE 21. CANADA WIRELESS CONNECTIVITY MARKET, BY TECHNOLOGY, 2022-2032 ($MILLION)
- TABLE 22. CANADA WIRELESS CONNECTIVITY MARKET, BY APPLICATION, 2022-2032 ($MILLION)
- TABLE 23. MEXICO WIRELESS CONNECTIVITY MARKET, BY TECHNOLOGY, 2022-2032 ($MILLION)
- TABLE 24. MEXICO WIRELESS CONNECTIVITY MARKET, BY APPLICATION, 2022-2032 ($MILLION)
- TABLE 25. EUROPE WIRELESS CONNECTIVITY MARKET, BY TECHNOLOGY, 2022-2032 ($MILLION)
- TABLE 26. EUROPE WIRELESS CONNECTIVITY MARKET, BY APPLICATION, 2022-2032 ($MILLION)
- TABLE 27. EUROPE WIRELESS CONNECTIVITY MARKET, BY COUNTRY, 2022-2032 ($MILLION)
- TABLE 28. UK WIRELESS CONNECTIVITY MARKET, BY TECHNOLOGY, 2022-2032 ($MILLION)
- TABLE 29. UK WIRELESS CONNECTIVITY MARKET, BY APPLICATION, 2022-2032 ($MILLION)
- TABLE 30. GERMANY WIRELESS CONNECTIVITY MARKET, BY TECHNOLOGY, 2022-2032 ($MILLION)
- TABLE 31. GERMANY WIRELESS CONNECTIVITY MARKET, BY APPLICATION, 2022-2032 ($MILLION)
- TABLE 32. FRANCE WIRELESS CONNECTIVITY MARKET, BY TECHNOLOGY, 2022-2032 ($MILLION)
- TABLE 33. FRANCE WIRELESS CONNECTIVITY MARKET, BY APPLICATION, 2022-2032 ($MILLION)
- TABLE 34. REST OF EUROPE WIRELESS CONNECTIVITY MARKET, BY TECHNOLOGY, 2022-2032 ($MILLION)
- TABLE 35. REST OF EUROPE WIRELESS CONNECTIVITY MARKET, BY APPLICATION, 2022-2032 ($MILLION)
- TABLE 36. ASIA-PACIFIC WIRELESS CONNECTIVITY MARKET, BY TECHNOLOGY, 2022-2032 ($MILLION)
- TABLE 37. ASIA-PACIFIC WIRELESS CONNECTIVITY MARKET, BY APPLICATION, 2022-2032 ($MILLION)
- TABLE 38. ASIA-PACIFIC WIRELESS CONNECTIVITY MARKET, BY COUNTRY, 2022-2032 ($MILLION)
- TABLE 39. CHINA WIRELESS CONNECTIVITY MARKET, BY TECHNOLOGY, 2022-2032 ($MILLION)
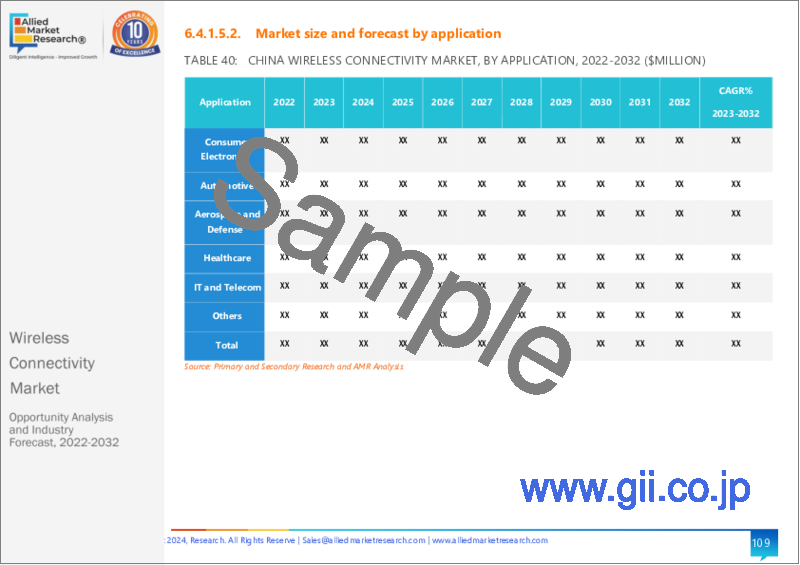
- TABLE 40. CHINA WIRELESS CONNECTIVITY MARKET, BY APPLICATION, 2022-2032 ($MILLION)
- TABLE 41. JAPAN WIRELESS CONNECTIVITY MARKET, BY TECHNOLOGY, 2022-2032 ($MILLION)
- TABLE 42. JAPAN WIRELESS CONNECTIVITY MARKET, BY APPLICATION, 2022-2032 ($MILLION)
- TABLE 43. INDIA WIRELESS CONNECTIVITY MARKET, BY TECHNOLOGY, 2022-2032 ($MILLION)
- TABLE 44. INDIA WIRELESS CONNECTIVITY MARKET, BY APPLICATION, 2022-2032 ($MILLION)
- TABLE 45. SOUTH KOREA WIRELESS CONNECTIVITY MARKET, BY TECHNOLOGY, 2022-2032 ($MILLION)
- TABLE 46. SOUTH KOREA WIRELESS CONNECTIVITY MARKET, BY APPLICATION, 2022-2032 ($MILLION)
- TABLE 47. SOUTHEAST ASIA WIRELESS CONNECTIVITY MARKET, BY TECHNOLOGY, 2022-2032 ($MILLION)
- TABLE 48. SOUTHEAST ASIA WIRELESS CONNECTIVITY MARKET, BY APPLICATION, 2022-2032 ($MILLION)
- TABLE 49. REST OF ASIA-PACIFIC WIRELESS CONNECTIVITY MARKET, BY TECHNOLOGY, 2022-2032 ($MILLION)
- TABLE 50. REST OF ASIA-PACIFIC WIRELESS CONNECTIVITY MARKET, BY APPLICATION, 2022-2032 ($MILLION)
- TABLE 51. LATIN AMERICA WIRELESS CONNECTIVITY MARKET, BY TECHNOLOGY, 2022-2032 ($MILLION)
- TABLE 52. LATIN AMERICA WIRELESS CONNECTIVITY MARKET, BY APPLICATION, 2022-2032 ($MILLION)
- TABLE 53. LATIN AMERICA WIRELESS CONNECTIVITY MARKET, BY COUNTRY, 2022-2032 ($MILLION)
- TABLE 54. BRAZIL WIRELESS CONNECTIVITY MARKET, BY TECHNOLOGY, 2022-2032 ($MILLION)
- TABLE 55. BRAZIL WIRELESS CONNECTIVITY MARKET, BY APPLICATION, 2022-2032 ($MILLION)
- TABLE 56. ARGENTINA WIRELESS CONNECTIVITY MARKET, BY TECHNOLOGY, 2022-2032 ($MILLION)
- TABLE 57. ARGENTINA WIRELESS CONNECTIVITY MARKET, BY APPLICATION, 2022-2032 ($MILLION)
- TABLE 58. REST OF LATIN AMERICA WIRELESS CONNECTIVITY MARKET, BY TECHNOLOGY, 2022-2032 ($MILLION)
- TABLE 59. REST OF LATIN AMERICA WIRELESS CONNECTIVITY MARKET, BY APPLICATION, 2022-2032 ($MILLION)
- TABLE 60. MIDDLE EAST AND AFRICA WIRELESS CONNECTIVITY MARKET, BY TECHNOLOGY, 2022-2032 ($MILLION)
- TABLE 61. MIDDLE EAST AND AFRICA WIRELESS CONNECTIVITY MARKET, BY APPLICATION, 2022-2032 ($MILLION)
- TABLE 62. MIDDLE EAST AND AFRICA WIRELESS CONNECTIVITY MARKET, BY COUNTRY, 2022-2032 ($MILLION)
- TABLE 63. UAE WIRELESS CONNECTIVITY MARKET, BY TECHNOLOGY, 2022-2032 ($MILLION)
- TABLE 64. UAE WIRELESS CONNECTIVITY MARKET, BY APPLICATION, 2022-2032 ($MILLION)
- TABLE 65. SAUDI ARABIA WIRELESS CONNECTIVITY MARKET, BY TECHNOLOGY, 2022-2032 ($MILLION)
- TABLE 66. SAUDI ARABIA WIRELESS CONNECTIVITY MARKET, BY APPLICATION, 2022-2032 ($MILLION)
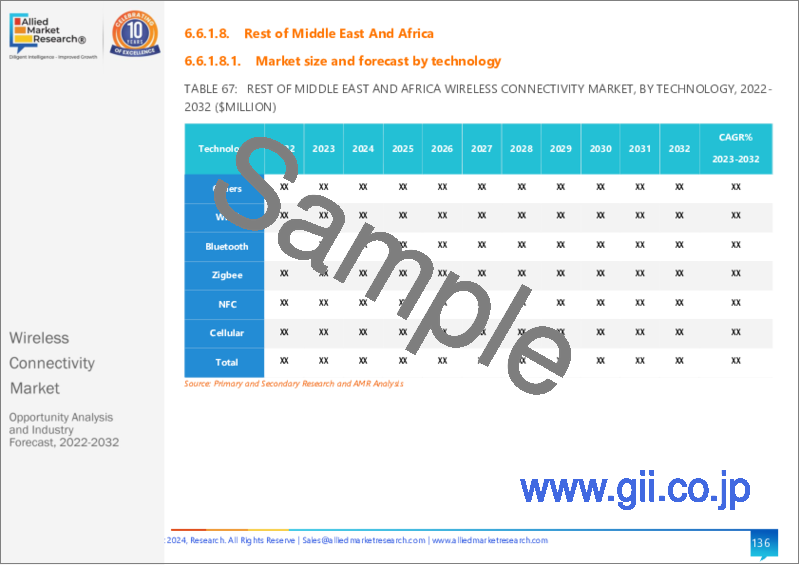
- TABLE 67. REST OF MIDDLE EAST AND AFRICA WIRELESS CONNECTIVITY MARKET, BY TECHNOLOGY, 2022-2032 ($MILLION)
- TABLE 68. REST OF MIDDLE EAST AND AFRICA WIRELESS CONNECTIVITY MARKET, BY APPLICATION, 2022-2032 ($MILLION)
- TABLE 69. QUALCOMM INCORPORATED.: KEY EXECUTIVES
- TABLE 70. QUALCOMM INCORPORATED.: COMPANY SNAPSHOT
- TABLE 71. QUALCOMM INCORPORATED.: PRODUCT SEGMENTS
- TABLE 72. QUALCOMM INCORPORATED.: SERVICE SEGMENTS
- TABLE 73. QUALCOMM INCORPORATED.: PRODUCT PORTFOLIO
- TABLE 74. QUALCOMM INCORPORATED.: KEY STRATERGIES
- TABLE 75. BROADCOM INC.: KEY EXECUTIVES
- TABLE 76. BROADCOM INC.: COMPANY SNAPSHOT
- TABLE 77. BROADCOM INC.: PRODUCT SEGMENTS
- TABLE 78. BROADCOM INC.: SERVICE SEGMENTS
- TABLE 79. BROADCOM INC.: PRODUCT PORTFOLIO
- TABLE 80. BROADCOM INC.: KEY STRATERGIES
- TABLE 81. INTEL CORPORATION: KEY EXECUTIVES
- TABLE 82. INTEL CORPORATION: COMPANY SNAPSHOT
- TABLE 83. INTEL CORPORATION: PRODUCT SEGMENTS
- TABLE 84. INTEL CORPORATION: SERVICE SEGMENTS
- TABLE 85. INTEL CORPORATION: PRODUCT PORTFOLIO
- TABLE 86. INTEL CORPORATION: KEY STRATERGIES
- TABLE 87. MEDIATEK INC.: KEY EXECUTIVES
- TABLE 88. MEDIATEK INC.: COMPANY SNAPSHOT
- TABLE 89. MEDIATEK INC.: PRODUCT SEGMENTS
- TABLE 90. MEDIATEK INC.: SERVICE SEGMENTS
- TABLE 91. MEDIATEK INC.: PRODUCT PORTFOLIO
- TABLE 92. MEDIATEK INC.: KEY STRATERGIES
- TABLE 93. TEXAS INSTRUMENTS INCORPORATED: KEY EXECUTIVES
- TABLE 94. TEXAS INSTRUMENTS INCORPORATED: COMPANY SNAPSHOT
- TABLE 95. TEXAS INSTRUMENTS INCORPORATED: PRODUCT SEGMENTS
- TABLE 96. TEXAS INSTRUMENTS INCORPORATED: SERVICE SEGMENTS
- TABLE 97. TEXAS INSTRUMENTS INCORPORATED: PRODUCT PORTFOLIO
- TABLE 98. TEXAS INSTRUMENTS INCORPORATED: KEY STRATERGIES
- TABLE 99. INFINEON TECHNOLOGIES AG: KEY EXECUTIVES
- TABLE 100. INFINEON TECHNOLOGIES AG: COMPANY SNAPSHOT
- TABLE 101. INFINEON TECHNOLOGIES AG: PRODUCT SEGMENTS
- TABLE 102. INFINEON TECHNOLOGIES AG: SERVICE SEGMENTS
- TABLE 103. INFINEON TECHNOLOGIES AG: PRODUCT PORTFOLIO
- TABLE 104. INFINEON TECHNOLOGIES AG: KEY STRATERGIES
- TABLE 105. NXP SEMICONDUCTORS N.V.: KEY EXECUTIVES
- TABLE 106. NXP SEMICONDUCTORS N.V.: COMPANY SNAPSHOT
- TABLE 107. NXP SEMICONDUCTORS N.V.: PRODUCT SEGMENTS
- TABLE 108. NXP SEMICONDUCTORS N.V.: SERVICE SEGMENTS
- TABLE 109. NXP SEMICONDUCTORS N.V.: PRODUCT PORTFOLIO
- TABLE 110. NXP SEMICONDUCTORS N.V.: KEY STRATERGIES
- TABLE 111. MURATA MANUFACTURING CO., LTD.: KEY EXECUTIVES
- TABLE 112. MURATA MANUFACTURING CO., LTD.: COMPANY SNAPSHOT
- TABLE 113. MURATA MANUFACTURING CO., LTD.: PRODUCT SEGMENTS
- TABLE 114. MURATA MANUFACTURING CO., LTD.: SERVICE SEGMENTS
- TABLE 115. MURATA MANUFACTURING CO., LTD.: PRODUCT PORTFOLIO
- TABLE 116. MURATA MANUFACTURING CO., LTD.: KEY STRATERGIES
- TABLE 117. MICROCHIP TECHNOLOGY INC.: KEY EXECUTIVES
- TABLE 118. MICROCHIP TECHNOLOGY INC.: COMPANY SNAPSHOT
- TABLE 119. MICROCHIP TECHNOLOGY INC.: PRODUCT SEGMENTS
- TABLE 120. MICROCHIP TECHNOLOGY INC.: SERVICE SEGMENTS
- TABLE 121. MICROCHIP TECHNOLOGY INC.: PRODUCT PORTFOLIO
- TABLE 122. MICROCHIP TECHNOLOGY INC.: KEY STRATERGIES
- TABLE 123. STMICROELECTRONICS N.V.: KEY EXECUTIVES
- TABLE 124. STMICROELECTRONICS N.V.: COMPANY SNAPSHOT
- TABLE 125. STMICROELECTRONICS N.V.: PRODUCT SEGMENTS
- TABLE 126. STMICROELECTRONICS N.V.: SERVICE SEGMENTS
- TABLE 127. STMICROELECTRONICS N.V.: PRODUCT PORTFOLIO
- TABLE 128. STMICROELECTRONICS N.V.: KEY STRATERGIES
LIST OF FIGURES
- FIGURE 01. WIRELESS CONNECTIVITY MARKET, 2022-2032
- FIGURE 02. SEGMENTATION OF WIRELESS CONNECTIVITY MARKET,2022-2032
- FIGURE 03. TOP IMPACTING FACTORS IN WIRELESS CONNECTIVITY MARKET
- FIGURE 04. TOP INVESTMENT POCKETS IN WIRELESS CONNECTIVITY MARKET (2023-2032)
- FIGURE 05. BARGAINING POWER OF SUPPLIERS
- FIGURE 06. BARGAINING POWER OF BUYERS
- FIGURE 07. THREAT OF SUBSTITUTION
- FIGURE 08. THREAT OF SUBSTITUTION
- FIGURE 09. COMPETITIVE RIVALRY
- FIGURE 10. GLOBAL WIRELESS CONNECTIVITY MARKET:DRIVERS, RESTRAINTS AND OPPORTUNITIES
- FIGURE 11. WIRELESS CONNECTIVITY MARKET, BY TECHNOLOGY, 2022 AND 2032(%)
- FIGURE 12. COMPARATIVE SHARE ANALYSIS OF WIRELESS CONNECTIVITY MARKET FOR WI-FI, BY COUNTRY 2022 AND 2032(%)
- FIGURE 13. COMPARATIVE SHARE ANALYSIS OF WIRELESS CONNECTIVITY MARKET FOR BLUETOOTH, BY COUNTRY 2022 AND 2032(%)
- FIGURE 14. COMPARATIVE SHARE ANALYSIS OF WIRELESS CONNECTIVITY MARKET FOR ZIGBEE, BY COUNTRY 2022 AND 2032(%)
- FIGURE 15. COMPARATIVE SHARE ANALYSIS OF WIRELESS CONNECTIVITY MARKET FOR NFC, BY COUNTRY 2022 AND 2032(%)
- FIGURE 16. COMPARATIVE SHARE ANALYSIS OF WIRELESS CONNECTIVITY MARKET FOR CELLULAR, BY COUNTRY 2022 AND 2032(%)
- FIGURE 17. COMPARATIVE SHARE ANALYSIS OF WIRELESS CONNECTIVITY MARKET FOR OTHERS, BY COUNTRY 2022 AND 2032(%)
- FIGURE 18. WIRELESS CONNECTIVITY MARKET, BY APPLICATION, 2022 AND 2032(%)
- FIGURE 19. COMPARATIVE SHARE ANALYSIS OF WIRELESS CONNECTIVITY MARKET FOR CONSUMER ELECTRONICS, BY COUNTRY 2022 AND 2032(%)
- FIGURE 20. COMPARATIVE SHARE ANALYSIS OF WIRELESS CONNECTIVITY MARKET FOR AUTOMOTIVE, BY COUNTRY 2022 AND 2032(%)
- FIGURE 21. COMPARATIVE SHARE ANALYSIS OF WIRELESS CONNECTIVITY MARKET FOR AEROSPACE AND DEFENSE, BY COUNTRY 2022 AND 2032(%)
- FIGURE 22. COMPARATIVE SHARE ANALYSIS OF WIRELESS CONNECTIVITY MARKET FOR HEALTHCARE, BY COUNTRY 2022 AND 2032(%)
- FIGURE 23. COMPARATIVE SHARE ANALYSIS OF WIRELESS CONNECTIVITY MARKET FOR IT AND TELECOM, BY COUNTRY 2022 AND 2032(%)
- FIGURE 24. COMPARATIVE SHARE ANALYSIS OF WIRELESS CONNECTIVITY MARKET FOR OTHERS, BY COUNTRY 2022 AND 2032(%)
- FIGURE 25. WIRELESS CONNECTIVITY MARKET BY REGION, 2022 AND 2032(%)
- FIGURE 26. U.S. WIRELESS CONNECTIVITY MARKET, 2022-2032 ($MILLION)
- FIGURE 27. CANADA WIRELESS CONNECTIVITY MARKET, 2022-2032 ($MILLION)
- FIGURE 28. MEXICO WIRELESS CONNECTIVITY MARKET, 2022-2032 ($MILLION)
- FIGURE 29. UK WIRELESS CONNECTIVITY MARKET, 2022-2032 ($MILLION)
- FIGURE 30. GERMANY WIRELESS CONNECTIVITY MARKET, 2022-2032 ($MILLION)
- FIGURE 31. FRANCE WIRELESS CONNECTIVITY MARKET, 2022-2032 ($MILLION)
- FIGURE 32. REST OF EUROPE WIRELESS CONNECTIVITY MARKET, 2022-2032 ($MILLION)
- FIGURE 33. CHINA WIRELESS CONNECTIVITY MARKET, 2022-2032 ($MILLION)
- FIGURE 34. JAPAN WIRELESS CONNECTIVITY MARKET, 2022-2032 ($MILLION)
- FIGURE 35. INDIA WIRELESS CONNECTIVITY MARKET, 2022-2032 ($MILLION)
- FIGURE 36. SOUTH KOREA WIRELESS CONNECTIVITY MARKET, 2022-2032 ($MILLION)
- FIGURE 37. SOUTHEAST ASIA WIRELESS CONNECTIVITY MARKET, 2022-2032 ($MILLION)
- FIGURE 38. REST OF ASIA-PACIFIC WIRELESS CONNECTIVITY MARKET, 2022-2032 ($MILLION)
- FIGURE 39. BRAZIL WIRELESS CONNECTIVITY MARKET, 2022-2032 ($MILLION)
- FIGURE 40. ARGENTINA WIRELESS CONNECTIVITY MARKET, 2022-2032 ($MILLION)
- FIGURE 41. REST OF LATIN AMERICA WIRELESS CONNECTIVITY MARKET, 2022-2032 ($MILLION)
- FIGURE 42. UAE WIRELESS CONNECTIVITY MARKET, 2022-2032 ($MILLION)
- FIGURE 43. SAUDI ARABIA WIRELESS CONNECTIVITY MARKET, 2022-2032 ($MILLION)
- FIGURE 44. REST OF MIDDLE EAST AND AFRICA WIRELESS CONNECTIVITY MARKET, 2022-2032 ($MILLION)
- FIGURE 45. TOP WINNING STRATEGIES, BY YEAR
- FIGURE 46. TOP WINNING STRATEGIES, BY DEVELOPMENT
- FIGURE 47. TOP WINNING STRATEGIES, BY COMPANY
- FIGURE 48. PRODUCT MAPPING OF TOP 10 PLAYERS
- FIGURE 49. COMPETITIVE DASHBOARD
- FIGURE 50. COMPETITIVE HEATMAP: WIRELESS CONNECTIVITY MARKET
- FIGURE 51. TOP PLAYER POSITIONING, 2022
The Wireless Connectivity Market was valued for $80.4 billion in 2022 and is estimated to reach $294 billion by 2032, exhibiting a CAGR of 13.89% from 2023 to 2032.
Wireless connectivity is crucial in modern life due to its ability to facilitate seamless communication and data exchange without the constraints of physical wires. It enables mobility, allowing users to stay connected while on the move. Wireless technology plays a vital role in various sectors, including telecommunications, healthcare, transportation, and entertainment. It empowers IoT devices, smart homes, and industrial automation by enabling connectivity between devices. Moreover, wireless connectivity enhances productivity, efficiency, and convenience in everyday tasks, from browsing the internet on smartphones to monitoring vital signs in remote healthcare settings.
Wireless connectivity finds extensive application across diverse sectors. Consumer electronics represents a significant end user, with smartphones, tablets, laptops, and smart home devices relying heavily on wireless connectivity for seamless internet access and data exchange. In Healthcare, medical wearables, remote patient monitoring systems, and telemedicine solutions leverage wireless connectivity for real-time health monitoring and communication. Automotive industries utilize wireless connectivity in connected cars for functions like infotainment systems, GPS navigation, telematics, and vehicle-to-vehicle communication. In Industrial Automation, wireless sensors, actuators, and control systems enable remote monitoring and automation, enhancing efficiency in manufacturing and industrial settings. Additionally, wireless connectivity contributes to the development of Smart Cities, facilitating applications like smart lighting, traffic management, and environmental monitoring within public infrastructure and utilities.
Progress in wireless technologies is propelling the expansion of the wireless connectivity market. These advancements continually push boundaries, delivering higher data speeds, expanded range, improved reliability, and enhanced energy efficiency. For instance, the progression of Wi-Fi standards, like Wi-Fi 6 (802.11ax), offers swifter and more robust wireless connections to meet escalating bandwidth needs. Similarly, enhancements in Bluetooth Low Energy (BLE) extend wireless communication capabilities for IoT devices, wearables, and smart home applications, fostering adoption across industries. Additionally, emerging technologies such as 5G promise to transform wireless connectivity, providing ultra-fast speeds, minimal latency, and extensive device connectivity, paving the way for innovation and growth in the wireless connectivity sector.
However, security concerns pose significant obstacles to the growth of the wireless connectivity market. The susceptibility of wireless networks to cyber threats, such as data breaches and unauthorized access, undermines confidence in their use. Organizations are hesitant to adopt wireless solutions due to fears of compromising sensitive data and infrastructure. Additionally, securing wireless networks adds complexity and increases operational costs. Consequently, businesses and consumers may opt for wired alternatives or limit wireless technology usage, hampering market expansion. Addressing these concerns entails implementing robust encryption, authentication protocols, and security measures to protect wireless communications. Overcoming these obstacles is crucial for building trust, driving adoption, and realizing the full potential of wireless connectivity.
The primary objective of the wireless connectivity market is to enable smooth communication and data transfer between devices without the limitations of physical cables. This market endeavors to deliver dependable and effective connectivity solutions across various sectors such as consumer electronics, healthcare, automotive, industrial automation, and smart cities. By facilitating wireless connections, it enhances mobility, flexibility, and user convenience, empowering individuals to stay connected and productive in diverse settings. Moreover, the wireless connectivity market aims to drive innovation in wireless technologies, offering faster data speeds, enhanced reliability, and advanced security features to meet evolving user and business requirements. Ultimately, its aim is to create interconnected ecosystems that facilitate seamless interaction and data sharing, opening avenues for improved communication, collaboration, and operational efficiency.
The wireless connectivity market is segmented on the basis of technology, application, and region. By technology, the market is segmented into Wifi, Bluetooth, Zigbee, NFC, Cellular, and Others. As per application, the market is classified into consumer electronics, automotive, aerospace & defense, healthcare, IT & telecom, and others.
By region, it is analyzed across North America (the U.S., Canada, and Mexico), Europe (UK, Germany, France, and rest of Europe), Asia-Pacific (China, Japan, India, South Korea, South-East Asia and rest of Asia-Pacific), and Latin America (Brazil, Argentina, and rest of Latin America) and Middle East & Africa (UAE, Saudi Arabia, and Rest of MEA).
Competitive analysis and profiles of the major wireless connectivity market players, such as Qualcomm Incorporated, Broadcom Inc., Intel Corporation, MediaTek Inc., Texas Instruments Incorporated, Infineon Technologies AG, NXP Semiconductors N.V., Murata Manufacturing Co., Ltd., Microchip Technology Inc., and STMicroelectronics N.V. are provided in this report. Business strategies such as product launch, collaboration and acquisition were adopted by the major market players in 2022.
Additional benefits you will get with this purchase are:
- Quarterly Update and* (only available with a corporate license, on listed price)
- 5 additional Company Profile of client Choice pre- or Post-purchase, as a free update.
- Free Upcoming Version on the Purchase of Five and Enterprise User License.
- 16 analyst hours of support* (post-purchase, if you find additional data requirements upon review of the report, you may receive support amounting to 16 analyst hours to solve questions, and post-sale queries)
- 15% Free Customization* (in case the scope or segment of the report does not match your requirements, 15% is equivalent to 3 working days of free work, applicable once)
- Free data Pack on the Five and Enterprise User License. (Excel version of the report)
- Free Updated report if the report is 6-12 months old or older.
- 24-hour priority response*
- Free Industry updates and white papers.
Possible Customization with this report (with additional cost and timeline, please talk to the sales executive to know more)
- Product Life Cycles
- Consumer Preference and Product Specifications
- New Product Development/ Product Matrix of Key Players
- Additional company profiles with specific to client's interest
- Key player details (including location, contact details, supplier/vendor network etc. in excel format)
- SWOT Analysis
Key Market Segments
By Technology
- Others
- Wi-Fi
- Bluetooth
- Zigbee
- NFC
- Cellular
By Application
- Consumer Electronics
- Automotive
- Aerospace and Defense
- Healthcare
- IT and Telecom
- Others
By Region
- North America
- U.S.
- Canada
- Mexico
- Europe
- UK
- Germany
- France
- Rest of Europe
- Asia-Pacific
- China
- Japan
- India
- South Korea
- Southeast Asia
- Rest of Asia-Pacific
- Latin America
- Brazil
- Argentina
- Rest of Latin America
- Middle East and Africa
- UAE
- Saudi Arabia
- Rest of Middle East And Africa
Key Market Players:
- Qualcomm Incorporated.
- Broadcom Inc.
- Intel Corporation
- MediaTek Inc.
- Texas Instruments Incorporated
- Infineon Technologies AG
- NXP Semiconductors N.V.
- Murata Manufacturing Co., Ltd.
- Microchip Technology Inc.
- STMicroelectronics N.V.
TABLE OF CONTENTS
CHAPTER 1: INTRODUCTION
- 1.1. Report description
- 1.2. Key market segments
- 1.3. Key benefits to the stakeholders
- 1.4. Research methodology
- 1.4.1. Primary research
- 1.4.2. Secondary research
- 1.4.3. Analyst tools and models
CHAPTER 2: EXECUTIVE SUMMARY
- 2.1. CXO perspective
CHAPTER 3: MARKET OVERVIEW
- 3.1. Market definition and scope
- 3.2. Key findings
- 3.2.1. Top impacting factors
- 3.2.2. Top investment pockets
- 3.3. Porter's five forces analysis
- 3.4. Market dynamics
- 3.4.1. Drivers
- 3.4.2. Restraints
- 3.4.3. Opportunities
CHAPTER 4: WIRELESS CONNECTIVITY MARKET, BY TECHNOLOGY
- 4.1. Overview
- 4.1.1. Market size and forecast
- 4.2. Wi-Fi
- 4.2.1. Key market trends, growth factors and opportunities
- 4.2.2. Market size and forecast, by region
- 4.2.3. Market share analysis by country
- 4.3. Bluetooth
- 4.3.1. Key market trends, growth factors and opportunities
- 4.3.2. Market size and forecast, by region
- 4.3.3. Market share analysis by country
- 4.4. Zigbee
- 4.4.1. Key market trends, growth factors and opportunities
- 4.4.2. Market size and forecast, by region
- 4.4.3. Market share analysis by country
- 4.5. NFC
- 4.5.1. Key market trends, growth factors and opportunities
- 4.5.2. Market size and forecast, by region
- 4.5.3. Market share analysis by country
- 4.6. Cellular
- 4.6.1. Key market trends, growth factors and opportunities
- 4.6.2. Market size and forecast, by region
- 4.6.3. Market share analysis by country
- 4.7. Others
- 4.7.1. Key market trends, growth factors and opportunities
- 4.7.2. Market size and forecast, by region
- 4.7.3. Market share analysis by country
CHAPTER 5: WIRELESS CONNECTIVITY MARKET, BY APPLICATION
- 5.1. Overview
- 5.1.1. Market size and forecast
- 5.2. Consumer Electronics
- 5.2.1. Key market trends, growth factors and opportunities
- 5.2.2. Market size and forecast, by region
- 5.2.3. Market share analysis by country
- 5.3. Automotive
- 5.3.1. Key market trends, growth factors and opportunities
- 5.3.2. Market size and forecast, by region
- 5.3.3. Market share analysis by country
- 5.4. Aerospace and Defense
- 5.4.1. Key market trends, growth factors and opportunities
- 5.4.2. Market size and forecast, by region
- 5.4.3. Market share analysis by country
- 5.5. Healthcare
- 5.5.1. Key market trends, growth factors and opportunities
- 5.5.2. Market size and forecast, by region
- 5.5.3. Market share analysis by country
- 5.6. IT and Telecom
- 5.6.1. Key market trends, growth factors and opportunities
- 5.6.2. Market size and forecast, by region
- 5.6.3. Market share analysis by country
- 5.7. Others
- 5.7.1. Key market trends, growth factors and opportunities
- 5.7.2. Market size and forecast, by region
- 5.7.3. Market share analysis by country
CHAPTER 6: WIRELESS CONNECTIVITY MARKET, BY REGION
- 6.1. Overview
- 6.1.1. Market size and forecast By Region
- 6.2. North America
- 6.2.1. Key market trends, growth factors and opportunities
- 6.2.2. Market size and forecast, by Technology
- 6.2.3. Market size and forecast, by Application
- 6.2.4. Market size and forecast, by country
- 6.2.4.1. U.S.
- 6.2.4.1.1. Market size and forecast, by Technology
- 6.2.4.1.2. Market size and forecast, by Application
- 6.2.4.2. Canada
- 6.2.4.2.1. Market size and forecast, by Technology
- 6.2.4.2.2. Market size and forecast, by Application
- 6.2.4.3. Mexico
- 6.2.4.3.1. Market size and forecast, by Technology
- 6.2.4.3.2. Market size and forecast, by Application
- 6.3. Europe
- 6.3.1. Key market trends, growth factors and opportunities
- 6.3.2. Market size and forecast, by Technology
- 6.3.3. Market size and forecast, by Application
- 6.3.4. Market size and forecast, by country
- 6.3.4.1. UK
- 6.3.4.1.1. Market size and forecast, by Technology
- 6.3.4.1.2. Market size and forecast, by Application
- 6.3.4.2. Germany
- 6.3.4.2.1. Market size and forecast, by Technology
- 6.3.4.2.2. Market size and forecast, by Application
- 6.3.4.3. France
- 6.3.4.3.1. Market size and forecast, by Technology
- 6.3.4.3.2. Market size and forecast, by Application
- 6.3.4.4. Rest of Europe
- 6.3.4.4.1. Market size and forecast, by Technology
- 6.3.4.4.2. Market size and forecast, by Application
- 6.4. Asia-Pacific
- 6.4.1. Key market trends, growth factors and opportunities
- 6.4.2. Market size and forecast, by Technology
- 6.4.3. Market size and forecast, by Application
- 6.4.4. Market size and forecast, by country
- 6.4.4.1. China
- 6.4.4.1.1. Market size and forecast, by Technology
- 6.4.4.1.2. Market size and forecast, by Application
- 6.4.4.2. Japan
- 6.4.4.2.1. Market size and forecast, by Technology
- 6.4.4.2.2. Market size and forecast, by Application
- 6.4.4.3. India
- 6.4.4.3.1. Market size and forecast, by Technology
- 6.4.4.3.2. Market size and forecast, by Application
- 6.4.4.4. South Korea
- 6.4.4.4.1. Market size and forecast, by Technology
- 6.4.4.4.2. Market size and forecast, by Application
- 6.4.4.5. Southeast Asia
- 6.4.4.5.1. Market size and forecast, by Technology
- 6.4.4.5.2. Market size and forecast, by Application
- 6.4.4.6. Rest of Asia-Pacific
- 6.4.4.6.1. Market size and forecast, by Technology
- 6.4.4.6.2. Market size and forecast, by Application
- 6.5. Latin America
- 6.5.1. Key market trends, growth factors and opportunities
- 6.5.2. Market size and forecast, by Technology
- 6.5.3. Market size and forecast, by Application
- 6.5.4. Market size and forecast, by country
- 6.5.4.1. Brazil
- 6.5.4.1.1. Market size and forecast, by Technology
- 6.5.4.1.2. Market size and forecast, by Application
- 6.5.4.2. Argentina
- 6.5.4.2.1. Market size and forecast, by Technology
- 6.5.4.2.2. Market size and forecast, by Application
- 6.5.4.3. Rest of Latin America
- 6.5.4.3.1. Market size and forecast, by Technology
- 6.5.4.3.2. Market size and forecast, by Application
- 6.6. Middle East and Africa
- 6.6.1. Key market trends, growth factors and opportunities
- 6.6.2. Market size and forecast, by Technology
- 6.6.3. Market size and forecast, by Application
- 6.6.4. Market size and forecast, by country
- 6.6.4.1. UAE
- 6.6.4.1.1. Market size and forecast, by Technology
- 6.6.4.1.2. Market size and forecast, by Application
- 6.6.4.2. Saudi Arabia
- 6.6.4.2.1. Market size and forecast, by Technology
- 6.6.4.2.2. Market size and forecast, by Application
- 6.6.4.3. Rest of Middle East And Africa
- 6.6.4.3.1. Market size and forecast, by Technology
- 6.6.4.3.2. Market size and forecast, by Application
CHAPTER 7: COMPETITIVE LANDSCAPE
- 7.1. Introduction
- 7.2. Top winning strategies
- 7.3. Product mapping of top 10 player
- 7.4. Competitive dashboard
- 7.5. Competitive heatmap
- 7.6. Top player positioning, 2022
CHAPTER 8: COMPANY PROFILES
- 8.1. Qualcomm Incorporated.
- 8.1.1. Company overview
- 8.1.2. Key executives
- 8.1.3. Company snapshot
- 8.1.4. Operating business segments
- 8.1.5. Product portfolio
- 8.1.6. Business performance
- 8.1.7. Key strategic moves and developments
- 8.2. Broadcom Inc.
- 8.2.1. Company overview
- 8.2.2. Key executives
- 8.2.3. Company snapshot
- 8.2.4. Operating business segments
- 8.2.5. Product portfolio
- 8.2.6. Business performance
- 8.2.7. Key strategic moves and developments
- 8.3. Intel Corporation
- 8.3.1. Company overview
- 8.3.2. Key executives
- 8.3.3. Company snapshot
- 8.3.4. Operating business segments
- 8.3.5. Product portfolio
- 8.3.6. Business performance
- 8.3.7. Key strategic moves and developments
- 8.4. MediaTek Inc.
- 8.4.1. Company overview
- 8.4.2. Key executives
- 8.4.3. Company snapshot
- 8.4.4. Operating business segments
- 8.4.5. Product portfolio
- 8.4.6. Business performance
- 8.4.7. Key strategic moves and developments
- 8.5. Texas Instruments Incorporated
- 8.5.1. Company overview
- 8.5.2. Key executives
- 8.5.3. Company snapshot
- 8.5.4. Operating business segments
- 8.5.5. Product portfolio
- 8.5.6. Business performance
- 8.5.7. Key strategic moves and developments
- 8.6. Infineon Technologies AG
- 8.6.1. Company overview
- 8.6.2. Key executives
- 8.6.3. Company snapshot
- 8.6.4. Operating business segments
- 8.6.5. Product portfolio
- 8.6.6. Business performance
- 8.6.7. Key strategic moves and developments
- 8.7. NXP Semiconductors N.V.
- 8.7.1. Company overview
- 8.7.2. Key executives
- 8.7.3. Company snapshot
- 8.7.4. Operating business segments
- 8.7.5. Product portfolio
- 8.7.6. Business performance
- 8.7.7. Key strategic moves and developments
- 8.8. Murata Manufacturing Co., Ltd.
- 8.8.1. Company overview
- 8.8.2. Key executives
- 8.8.3. Company snapshot
- 8.8.4. Operating business segments
- 8.8.5. Product portfolio
- 8.8.6. Business performance
- 8.8.7. Key strategic moves and developments
- 8.9. Microchip Technology Inc.
- 8.9.1. Company overview
- 8.9.2. Key executives
- 8.9.3. Company snapshot
- 8.9.4. Operating business segments
- 8.9.5. Product portfolio
- 8.9.6. Business performance
- 8.9.7. Key strategic moves and developments
- 8.10. STMicroelectronics N.V.
- 8.10.1. Company overview
- 8.10.2. Key executives
- 8.10.3. Company snapshot
- 8.10.4. Operating business segments
- 8.10.5. Product portfolio
- 8.10.6. Business performance
- 8.10.7. Key strategic moves and developments
