|
|
市場調査レポート
商品コード
1472300
自動車用複合材料の市場:繊維タイプ別、樹脂タイプ別、用途別:世界の機会分析と産業予測、2023~2032年Automotive Composites Market By Fiber Type (Glass Fiber, Carbon Fiber, Others), By Resin Type (Thermoset, Thermoplastic), By Application (Exterior, Interior, Others): Global Opportunity Analysis and Industry Forecast, 2023-2032 |
||||||
|
|
|||||||
|
|||||||


| 自動車用複合材料の市場:繊維タイプ別、樹脂タイプ別、用途別:世界の機会分析と産業予測、2023~2032年 |
|
出版日: 2024年03月01日
発行: Allied Market Research
ページ情報: 英文 710 Pages
納期: 2~3営業日
|

- 全表示
- 概要
- 図表
- 目次
世界の自動車用複合材料市場は、2022年に74億米ドルと評価され、2023~2032年のCAGRは8.3%を示し、2032年には164億米ドルに達すると推定されています。
自動車用複合材料は、炭素繊維やガラス繊維などの様々な成分を樹脂マトリックスとブレンドした、自動車に使用される先端材料です。これらの複合材料は、鉄やアルミニウムといった従来の材料と比較して、優れた強度対重量比を記載しています。ボディパネル、シャーシ、構造要素に採用され、性能、耐久性、安全性を向上させる。軽量化と剛性の向上により、自動車用複合材料は燃費の改善と排出ガスの低減に貢献し、持続可能性と環境責任に関する業界の目標に合致しています。その汎用性により革新的な設計ソリューションが可能となり、競争が激化する自動車業界において、効率性、安全性、環境適合性を優先した次世代自動車の開発が促進されます。
持続可能性は、ウェアラブルセグメントにおける材料の選択と開発に影響を与える主要原動力として浮上してきました。技術的進歩と材料の革新は、自動車用複合材料の能力と適用性を拡大する上で極めて重要な役割を果たしてきました。継続的な研究開発を通じて、エンジニアと科学者は複合材料の限界を押し広げ、その機械的特性、耐久性、製造性を向上させてきました。自動積層技術や積層造形などの先進的な製造プロセスにより、製造工程が合理化され、コストが削減されたため、複合材料は自動車メーカーにとってより身近なものとなりました。さらに、ナノ技術とスマート材料の統合は、自動車用複合材料の新たな機能性と性能の向上を解き放つ大きな可能性を秘めています。技術革新が複合材料の進化を促進し続けるにつれて、多様な自動車用途での複合材料の採用が加速する展望です。
さらに、設計の柔軟性と美観は、自動車用複合材料にとって重要な差別化要因であり、設計者に、視覚的に印象的で空気力学的に効率的な自動車を作るためのかつてない自由を記載しています。複合材料を複雑な形態に成形し、ユニークなデザイン要素を統合する能力により、自動車メーカーは製品を差別化し、ブランド・ID確認を高めることができます。さらに、複合材料は、デザインの美しさを損なうことなく、空力強化や構造強化などの機能的特徴を統合することを可能にします。消費者の嗜好が個性的でパーソナライズされた自動車に引き寄せられる中、複合材料が提供するデザインの柔軟性は、将来の自動車デザイン動向を形成する上で極めて重要な役割を果たすと考えられます。
しかし、複合材料は金属に比べて優れた設計上の柔軟性を提供する一方で、設計やエンジニアリングの面では独自の課題も存在します。複合材料を自動車構造に組み込むには、材料の使用量を最適化し、構造的完全性を確保するための高度な設計とシミュレーション・ツールが必要です。さらに、複合材料は様々な荷重条件下で金属とは異なる挙動を示すため、効果的な設計ソリューションのためには専門的なエンジニアリングの知識が必要となります。自動車用複合材料の標準化された設計ガイドラインや試験プロトコルがないことが、設計プロセスをさらに複雑にし、開発リードタイムを長くしています。
一方、新興経済諸国は、可処分所得の増加、都市化、インフラ整備を背景に、自動車用複合材料市場にとって未開拓の可能性を秘めています。これらの地域では自動車需要が伸びているため、自動車製造工程に軽量複合材料を導入する大きな機会が存在します。現地の自動車メーカーと協力し、インフラ開拓に投資することで、複合材料サプライヤーは新興国市場に参入し、これらの地域で急成長する自動車産業を活用することができます。
自動車用複合材料の製造に携わるその他の主要企業には、Magna、Mar-Bal、Plasan、UFP Technologies、Base Group、3B Fiberglass、Delphi Autoなどがあります。自動車用複合材料の世界市場レポートは、これらの主要企業のプロファイルだけでなく、詳細な競合分析を記載しています。
利害関係者にとっての主要メリット
- 本レポートは、2022~2032年までの自動車用複合材市場分析の市場セグメント、現在の動向、推定・動向、力学を定量的に分析し、自動車用複合材市場の有力な機会を特定します。
- 市場促進要因、市場抑制要因、市場機会に関連する情報とともに市場調査を記載しています。
- ポーターのファイブフォース分析では、利害関係者が利益重視のビジネス決定を下し、サプライヤーとバイヤーのネットワークを強化できるよう、バイヤーとサプライヤーの潜在力を明らかにします。
- 自動車用複合材料の市場セグメンテーションを詳細に分析することで、市場機会を見極めることができます。
- 各地域の主要国は、世界市場への収益貢献度に応じてマッピングされています。
- 市場参入企業のポジショニングはベンチマーキングを容易にし、市場参入企業の現在のポジションを明確に理解することができます。
- 本レポートには、地域別と世界の自動車用複合材料の市場動向、主要企業、市場セグメント、用途セグメント、市場成長戦略の分析が含まれています。
本レポートで可能なカスタマイズ(追加費用とスケジュールがあります。)
- 製造能力
- 地域別の新規参入企業
- 技術動向分析
- 製品/セグメント別参入企業の市場セグメンテーション分析
- 主要企業の新製品開発/製品マトリックス
- 国、地域、世界レベルでの患者/疫学データ
- 規制ガイドライン
- 顧客の関心に応じた追加の企業プロファイル
- 国別または地域別追加分析-市場規模と予測
- 平均販売価格分析/プライスポイント分析
- 企業プロファイルの拡大リスト
- 過去の市場データ
- 輸出入分析/データ
- 主要参入企業の詳細(所在地、連絡先、サプライヤー/ベンダーネットワークなどを含む、エクセル形式)
- 顧客/消費者/原料サプライヤー一覧-バリューチェーン分析
- 世界/地域/国別レベルでの参入企業の市場シェア分析
- SWOT分析
- 数量市場規模と予測
目次
第1章 イントロダクション
第2章 エグゼクティブサマリー
第3章 市場概要
- 市場の定義と範囲
- 主要調査結果
- 影響要因
- 主要投資機会
- ポーターのファイブフォース分析
- 市場力学
- 促進要因
- 抑制要因
- 機会
- バリューチェーン分析
- 価格分析
- 主要規制分析
- 特許情勢
第4章 自動車用複合材料市場:繊維タイプ別
- 概要
- ガラス繊維
- 炭素繊維
- その他
第5章 自動車用複合材料市場:樹脂タイプ別
- 概要
- 熱硬化性樹脂
- 熱可塑性樹脂
第6章 自動車用複合材料市場:用途別
- 概要
- 外装
- 内装
- その他
第7章 自動車用複合材料市場:地域別
- 概要
- 北米
- 米国
- カナダ
- メキシコ
- 欧州
- ドイツ
- 英国
- フランス
- スペイン
- イタリア
- その他
- アジア太平洋
- 中国
- インド
- 日本
- 韓国
- オーストラリア
- その他
- ラテンアメリカ・中東・アフリカ
- ブラジル
- サウジアラビア
- 南アフリカ
- その他
第8章 競争情勢
- イントロダクション
- 主要成功戦略
- 主要10社の製品マッピング
- 競合ダッシュボード
- 競合ヒートマップ
- 主要企業のポジショニング、2022年
第9章 企業プロファイル
- TORAY INDUSTRIES, INC.
- SGL Carbon SE
- Teijin Limited
- TEIJIN LIMITED.
- Hexcel Corporation
- Owens Corning
- Mitsubishi Chemical Holdings Corporation
- Gurit Holding AG
- Solvay S.A.
- TenCate Advanced Composites
- Huntsman Corporation
LIST OF TABLES
- TABLE 01. GLOBAL AUTOMOTIVE COMPOSITES MARKET, BY FIBER TYPE, 2022-2032 ($MILLION)
- TABLE 02. AUTOMOTIVE COMPOSITES MARKET FOR GLASS FIBER, BY REGION, 2022-2032 ($MILLION)
- TABLE 03. AUTOMOTIVE COMPOSITES MARKET FOR CARBON FIBER, BY REGION, 2022-2032 ($MILLION)
- TABLE 04. AUTOMOTIVE COMPOSITES MARKET FOR OTHERS, BY REGION, 2022-2032 ($MILLION)
- TABLE 05. GLOBAL AUTOMOTIVE COMPOSITES MARKET, BY RESIN TYPE, 2022-2032 ($MILLION)
- TABLE 06. AUTOMOTIVE COMPOSITES MARKET FOR THERMOSET, BY REGION, 2022-2032 ($MILLION)
- TABLE 07. AUTOMOTIVE COMPOSITES MARKET FOR THERMOPLASTIC, BY REGION, 2022-2032 ($MILLION)
- TABLE 08. GLOBAL AUTOMOTIVE COMPOSITES MARKET, BY APPLICATION, 2022-2032 ($MILLION)
- TABLE 09. AUTOMOTIVE COMPOSITES MARKET FOR EXTERIOR, BY REGION, 2022-2032 ($MILLION)
- TABLE 10. AUTOMOTIVE COMPOSITES MARKET FOR INTERIOR, BY REGION, 2022-2032 ($MILLION)
- TABLE 11. AUTOMOTIVE COMPOSITES MARKET FOR OTHERS, BY REGION, 2022-2032 ($MILLION)
- TABLE 12. AUTOMOTIVE COMPOSITES MARKET, BY REGION, 2022-2032 ($MILLION)
- TABLE 13. NORTH AMERICA AUTOMOTIVE COMPOSITES MARKET, BY FIBER TYPE, 2022-2032 ($MILLION)
- TABLE 14. NORTH AMERICA AUTOMOTIVE COMPOSITES MARKET, BY RESIN TYPE, 2022-2032 ($MILLION)
- TABLE 15. NORTH AMERICA AUTOMOTIVE COMPOSITES MARKET, BY APPLICATION, 2022-2032 ($MILLION)
- TABLE 16. NORTH AMERICA AUTOMOTIVE COMPOSITES MARKET, BY COUNTRY, 2022-2032 ($MILLION)
- TABLE 17. U.S. AUTOMOTIVE COMPOSITES MARKET, BY FIBER TYPE, 2022-2032 ($MILLION)
- TABLE 18. U.S. AUTOMOTIVE COMPOSITES MARKET, BY RESIN TYPE, 2022-2032 ($MILLION)
- TABLE 19. U.S. AUTOMOTIVE COMPOSITES MARKET, BY APPLICATION, 2022-2032 ($MILLION)
- TABLE 20. CANADA AUTOMOTIVE COMPOSITES MARKET, BY FIBER TYPE, 2022-2032 ($MILLION)
- TABLE 21. CANADA AUTOMOTIVE COMPOSITES MARKET, BY RESIN TYPE, 2022-2032 ($MILLION)
- TABLE 22. CANADA AUTOMOTIVE COMPOSITES MARKET, BY APPLICATION, 2022-2032 ($MILLION)
- TABLE 23. MEXICO AUTOMOTIVE COMPOSITES MARKET, BY FIBER TYPE, 2022-2032 ($MILLION)
- TABLE 24. MEXICO AUTOMOTIVE COMPOSITES MARKET, BY RESIN TYPE, 2022-2032 ($MILLION)
- TABLE 25. MEXICO AUTOMOTIVE COMPOSITES MARKET, BY APPLICATION, 2022-2032 ($MILLION)
- TABLE 26. EUROPE AUTOMOTIVE COMPOSITES MARKET, BY FIBER TYPE, 2022-2032 ($MILLION)
- TABLE 27. EUROPE AUTOMOTIVE COMPOSITES MARKET, BY RESIN TYPE, 2022-2032 ($MILLION)
- TABLE 28. EUROPE AUTOMOTIVE COMPOSITES MARKET, BY APPLICATION, 2022-2032 ($MILLION)
- TABLE 29. EUROPE AUTOMOTIVE COMPOSITES MARKET, BY COUNTRY, 2022-2032 ($MILLION)
- TABLE 30. GERMANY AUTOMOTIVE COMPOSITES MARKET, BY FIBER TYPE, 2022-2032 ($MILLION)
- TABLE 31. GERMANY AUTOMOTIVE COMPOSITES MARKET, BY RESIN TYPE, 2022-2032 ($MILLION)
- TABLE 32. GERMANY AUTOMOTIVE COMPOSITES MARKET, BY APPLICATION, 2022-2032 ($MILLION)
- TABLE 33. UK AUTOMOTIVE COMPOSITES MARKET, BY FIBER TYPE, 2022-2032 ($MILLION)
- TABLE 34. UK AUTOMOTIVE COMPOSITES MARKET, BY RESIN TYPE, 2022-2032 ($MILLION)
- TABLE 35. UK AUTOMOTIVE COMPOSITES MARKET, BY APPLICATION, 2022-2032 ($MILLION)
- TABLE 36. FRANCE AUTOMOTIVE COMPOSITES MARKET, BY FIBER TYPE, 2022-2032 ($MILLION)
- TABLE 37. FRANCE AUTOMOTIVE COMPOSITES MARKET, BY RESIN TYPE, 2022-2032 ($MILLION)
- TABLE 38. FRANCE AUTOMOTIVE COMPOSITES MARKET, BY APPLICATION, 2022-2032 ($MILLION)
- TABLE 39. SPAIN AUTOMOTIVE COMPOSITES MARKET, BY FIBER TYPE, 2022-2032 ($MILLION)
- TABLE 40. SPAIN AUTOMOTIVE COMPOSITES MARKET, BY RESIN TYPE, 2022-2032 ($MILLION)
- TABLE 41. SPAIN AUTOMOTIVE COMPOSITES MARKET, BY APPLICATION, 2022-2032 ($MILLION)
- TABLE 42. ITALY AUTOMOTIVE COMPOSITES MARKET, BY FIBER TYPE, 2022-2032 ($MILLION)
- TABLE 43. ITALY AUTOMOTIVE COMPOSITES MARKET, BY RESIN TYPE, 2022-2032 ($MILLION)
- TABLE 44. ITALY AUTOMOTIVE COMPOSITES MARKET, BY APPLICATION, 2022-2032 ($MILLION)
- TABLE 45. REST OF EUROPE AUTOMOTIVE COMPOSITES MARKET, BY FIBER TYPE, 2022-2032 ($MILLION)
- TABLE 46. REST OF EUROPE AUTOMOTIVE COMPOSITES MARKET, BY RESIN TYPE, 2022-2032 ($MILLION)
- TABLE 47. REST OF EUROPE AUTOMOTIVE COMPOSITES MARKET, BY APPLICATION, 2022-2032 ($MILLION)
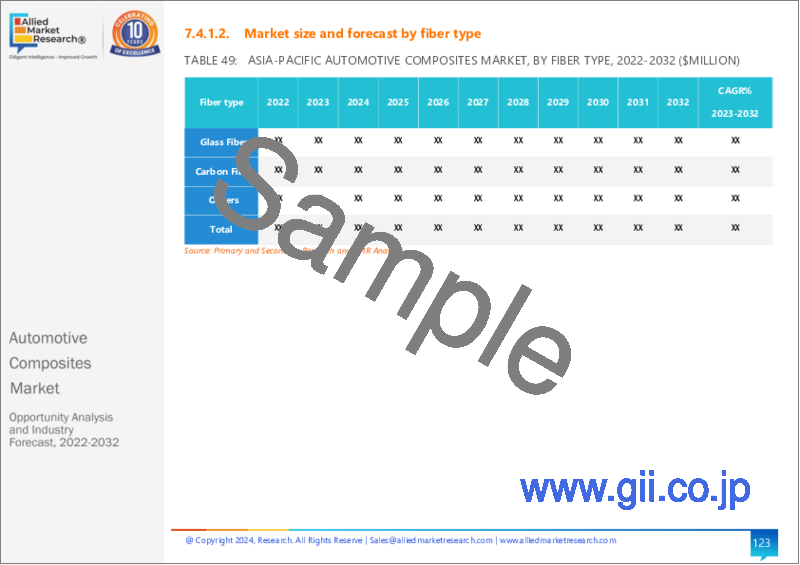
- TABLE 48. ASIA-PACIFIC AUTOMOTIVE COMPOSITES MARKET, BY FIBER TYPE, 2022-2032 ($MILLION)
- TABLE 49. ASIA-PACIFIC AUTOMOTIVE COMPOSITES MARKET, BY RESIN TYPE, 2022-2032 ($MILLION)
- TABLE 50. ASIA-PACIFIC AUTOMOTIVE COMPOSITES MARKET, BY APPLICATION, 2022-2032 ($MILLION)
- TABLE 51. ASIA-PACIFIC AUTOMOTIVE COMPOSITES MARKET, BY COUNTRY, 2022-2032 ($MILLION)
- TABLE 52. CHINA AUTOMOTIVE COMPOSITES MARKET, BY FIBER TYPE, 2022-2032 ($MILLION)
- TABLE 53. CHINA AUTOMOTIVE COMPOSITES MARKET, BY RESIN TYPE, 2022-2032 ($MILLION)
- TABLE 54. CHINA AUTOMOTIVE COMPOSITES MARKET, BY APPLICATION, 2022-2032 ($MILLION)
- TABLE 55. INDIA AUTOMOTIVE COMPOSITES MARKET, BY FIBER TYPE, 2022-2032 ($MILLION)
- TABLE 56. INDIA AUTOMOTIVE COMPOSITES MARKET, BY RESIN TYPE, 2022-2032 ($MILLION)
- TABLE 57. INDIA AUTOMOTIVE COMPOSITES MARKET, BY APPLICATION, 2022-2032 ($MILLION)
- TABLE 58. JAPAN AUTOMOTIVE COMPOSITES MARKET, BY FIBER TYPE, 2022-2032 ($MILLION)
- TABLE 59. JAPAN AUTOMOTIVE COMPOSITES MARKET, BY RESIN TYPE, 2022-2032 ($MILLION)
- TABLE 60. JAPAN AUTOMOTIVE COMPOSITES MARKET, BY APPLICATION, 2022-2032 ($MILLION)
- TABLE 61. SOUTH KOREA AUTOMOTIVE COMPOSITES MARKET, BY FIBER TYPE, 2022-2032 ($MILLION)
- TABLE 62. SOUTH KOREA AUTOMOTIVE COMPOSITES MARKET, BY RESIN TYPE, 2022-2032 ($MILLION)
- TABLE 63. SOUTH KOREA AUTOMOTIVE COMPOSITES MARKET, BY APPLICATION, 2022-2032 ($MILLION)
- TABLE 64. AUSTRALIA AUTOMOTIVE COMPOSITES MARKET, BY FIBER TYPE, 2022-2032 ($MILLION)
- TABLE 65. AUSTRALIA AUTOMOTIVE COMPOSITES MARKET, BY RESIN TYPE, 2022-2032 ($MILLION)
- TABLE 66. AUSTRALIA AUTOMOTIVE COMPOSITES MARKET, BY APPLICATION, 2022-2032 ($MILLION)
- TABLE 67. REST OF ASIA-PACIFIC AUTOMOTIVE COMPOSITES MARKET, BY FIBER TYPE, 2022-2032 ($MILLION)
- TABLE 68. REST OF ASIA-PACIFIC AUTOMOTIVE COMPOSITES MARKET, BY RESIN TYPE, 2022-2032 ($MILLION)
- TABLE 69. REST OF ASIA-PACIFIC AUTOMOTIVE COMPOSITES MARKET, BY APPLICATION, 2022-2032 ($MILLION)
- TABLE 70. LAMEA AUTOMOTIVE COMPOSITES MARKET, BY FIBER TYPE, 2022-2032 ($MILLION)
- TABLE 71. LAMEA AUTOMOTIVE COMPOSITES MARKET, BY RESIN TYPE, 2022-2032 ($MILLION)
- TABLE 72. LAMEA AUTOMOTIVE COMPOSITES MARKET, BY APPLICATION, 2022-2032 ($MILLION)
- TABLE 73. LAMEA AUTOMOTIVE COMPOSITES MARKET, BY COUNTRY, 2022-2032 ($MILLION)
- TABLE 74. BRAZIL AUTOMOTIVE COMPOSITES MARKET, BY FIBER TYPE, 2022-2032 ($MILLION)
- TABLE 75. BRAZIL AUTOMOTIVE COMPOSITES MARKET, BY RESIN TYPE, 2022-2032 ($MILLION)
- TABLE 76. BRAZIL AUTOMOTIVE COMPOSITES MARKET, BY APPLICATION, 2022-2032 ($MILLION)
- TABLE 77. SAUDI ARABIA AUTOMOTIVE COMPOSITES MARKET, BY FIBER TYPE, 2022-2032 ($MILLION)
- TABLE 78. SAUDI ARABIA AUTOMOTIVE COMPOSITES MARKET, BY RESIN TYPE, 2022-2032 ($MILLION)
- TABLE 79. SAUDI ARABIA AUTOMOTIVE COMPOSITES MARKET, BY APPLICATION, 2022-2032 ($MILLION)
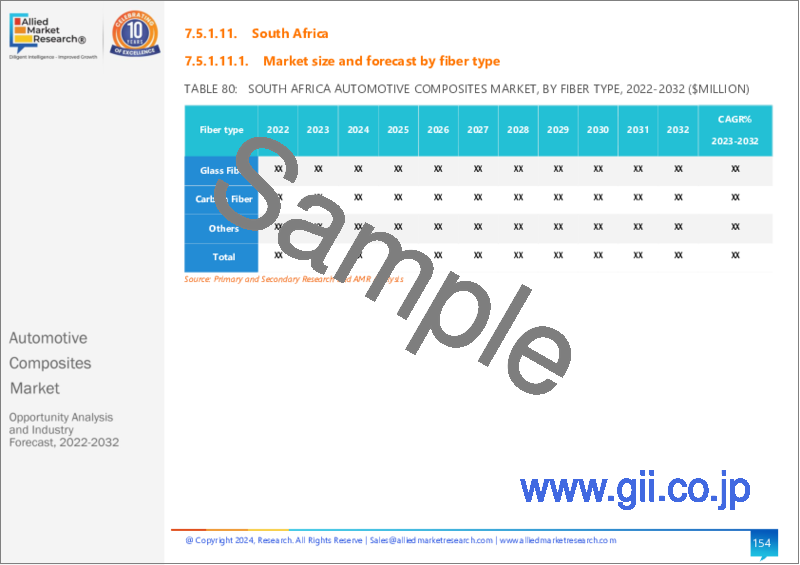
- TABLE 80. SOUTH AFRICA AUTOMOTIVE COMPOSITES MARKET, BY FIBER TYPE, 2022-2032 ($MILLION)
- TABLE 81. SOUTH AFRICA AUTOMOTIVE COMPOSITES MARKET, BY RESIN TYPE, 2022-2032 ($MILLION)
- TABLE 82. SOUTH AFRICA AUTOMOTIVE COMPOSITES MARKET, BY APPLICATION, 2022-2032 ($MILLION)
- TABLE 83. REST OF LAMEA AUTOMOTIVE COMPOSITES MARKET, BY FIBER TYPE, 2022-2032 ($MILLION)
- TABLE 84. REST OF LAMEA AUTOMOTIVE COMPOSITES MARKET, BY RESIN TYPE, 2022-2032 ($MILLION)
- TABLE 85. REST OF LAMEA AUTOMOTIVE COMPOSITES MARKET, BY APPLICATION, 2022-2032 ($MILLION)
- TABLE 86. TORAY INDUSTRIES, INC.: KEY EXECUTIVES
- TABLE 87. TORAY INDUSTRIES, INC.: COMPANY SNAPSHOT
- TABLE 88. TORAY INDUSTRIES, INC.: PRODUCT SEGMENTS
- TABLE 89. TORAY INDUSTRIES, INC.: SERVICE SEGMENTS
- TABLE 90. TORAY INDUSTRIES, INC.: PRODUCT PORTFOLIO
- TABLE 91. TORAY INDUSTRIES, INC.: KEY STRATERGIES
- TABLE 92. SGL CARBON SE: KEY EXECUTIVES
- TABLE 93. SGL CARBON SE: COMPANY SNAPSHOT
- TABLE 94. SGL CARBON SE: PRODUCT SEGMENTS
- TABLE 95. SGL CARBON SE: SERVICE SEGMENTS
- TABLE 96. SGL CARBON SE: PRODUCT PORTFOLIO
- TABLE 97. SGL CARBON SE: KEY STRATERGIES
- TABLE 98. TEIJIN LIMITED: KEY EXECUTIVES
- TABLE 99. TEIJIN LIMITED: COMPANY SNAPSHOT
- TABLE 100. TEIJIN LIMITED: PRODUCT SEGMENTS
- TABLE 101. TEIJIN LIMITED: SERVICE SEGMENTS
- TABLE 102. TEIJIN LIMITED: PRODUCT PORTFOLIO
- TABLE 103. TEIJIN LIMITED: KEY STRATERGIES
- TABLE 104. TEIJIN LIMITED.: KEY EXECUTIVES
- TABLE 105. TEIJIN LIMITED.: COMPANY SNAPSHOT
- TABLE 106. TEIJIN LIMITED.: PRODUCT SEGMENTS
- TABLE 107. TEIJIN LIMITED.: SERVICE SEGMENTS
- TABLE 108. TEIJIN LIMITED.: PRODUCT PORTFOLIO
- TABLE 109. TEIJIN LIMITED.: KEY STRATERGIES
- TABLE 110. HEXCEL CORPORATION: KEY EXECUTIVES
- TABLE 111. HEXCEL CORPORATION: COMPANY SNAPSHOT
- TABLE 112. HEXCEL CORPORATION: PRODUCT SEGMENTS
- TABLE 113. HEXCEL CORPORATION: SERVICE SEGMENTS
- TABLE 114. HEXCEL CORPORATION: PRODUCT PORTFOLIO
- TABLE 115. HEXCEL CORPORATION: KEY STRATERGIES
- TABLE 116. OWENS CORNING: KEY EXECUTIVES
- TABLE 117. OWENS CORNING: COMPANY SNAPSHOT
- TABLE 118. OWENS CORNING: PRODUCT SEGMENTS
- TABLE 119. OWENS CORNING: SERVICE SEGMENTS
- TABLE 120. OWENS CORNING: PRODUCT PORTFOLIO
- TABLE 121. OWENS CORNING: KEY STRATERGIES
- TABLE 122. MITSUBISHI CHEMICAL HOLDINGS CORPORATION: KEY EXECUTIVES
- TABLE 123. MITSUBISHI CHEMICAL HOLDINGS CORPORATION: COMPANY SNAPSHOT
- TABLE 124. MITSUBISHI CHEMICAL HOLDINGS CORPORATION: PRODUCT SEGMENTS
- TABLE 125. MITSUBISHI CHEMICAL HOLDINGS CORPORATION: SERVICE SEGMENTS
- TABLE 126. MITSUBISHI CHEMICAL HOLDINGS CORPORATION: PRODUCT PORTFOLIO
- TABLE 127. MITSUBISHI CHEMICAL HOLDINGS CORPORATION: KEY STRATERGIES
- TABLE 128. GURIT HOLDING AG: KEY EXECUTIVES
- TABLE 129. GURIT HOLDING AG: COMPANY SNAPSHOT
- TABLE 130. GURIT HOLDING AG: PRODUCT SEGMENTS
- TABLE 131. GURIT HOLDING AG: SERVICE SEGMENTS
- TABLE 132. GURIT HOLDING AG: PRODUCT PORTFOLIO
- TABLE 133. GURIT HOLDING AG: KEY STRATERGIES
- TABLE 134. SOLVAY S.A.: KEY EXECUTIVES
- TABLE 135. SOLVAY S.A.: COMPANY SNAPSHOT
- TABLE 136. SOLVAY S.A.: PRODUCT SEGMENTS
- TABLE 137. SOLVAY S.A.: SERVICE SEGMENTS
- TABLE 138. SOLVAY S.A.: PRODUCT PORTFOLIO
- TABLE 139. SOLVAY S.A.: KEY STRATERGIES
- TABLE 140. TENCATE ADVANCED COMPOSITES: KEY EXECUTIVES
- TABLE 141. TENCATE ADVANCED COMPOSITES: COMPANY SNAPSHOT
- TABLE 142. TENCATE ADVANCED COMPOSITES: PRODUCT SEGMENTS
- TABLE 143. TENCATE ADVANCED COMPOSITES: SERVICE SEGMENTS
- TABLE 144. TENCATE ADVANCED COMPOSITES: PRODUCT PORTFOLIO
- TABLE 145. TENCATE ADVANCED COMPOSITES: KEY STRATERGIES
- TABLE 146. HUNTSMAN CORPORATION: KEY EXECUTIVES
- TABLE 147. HUNTSMAN CORPORATION: COMPANY SNAPSHOT
- TABLE 148. HUNTSMAN CORPORATION: PRODUCT SEGMENTS
- TABLE 149. HUNTSMAN CORPORATION: SERVICE SEGMENTS
- TABLE 150. HUNTSMAN CORPORATION: PRODUCT PORTFOLIO
- TABLE 151. HUNTSMAN CORPORATION: KEY STRATERGIES
LIST OF FIGURES
- FIGURE 01. AUTOMOTIVE COMPOSITES MARKET, 2022-2032
- FIGURE 02. SEGMENTATION OF AUTOMOTIVE COMPOSITES MARKET,2022-2032
- FIGURE 03. TOP IMPACTING FACTORS IN AUTOMOTIVE COMPOSITES MARKET
- FIGURE 04. TOP INVESTMENT POCKETS IN AUTOMOTIVE COMPOSITES MARKET (2023-2032)
- FIGURE 05. BARGAINING POWER OF SUPPLIERS
- FIGURE 06. BARGAINING POWER OF BUYERS
- FIGURE 07. THREAT OF SUBSTITUTION
- FIGURE 08. THREAT OF SUBSTITUTION
- FIGURE 09. COMPETITIVE RIVALRY
- FIGURE 10. GLOBAL AUTOMOTIVE COMPOSITES MARKET:DRIVERS, RESTRAINTS AND OPPORTUNITIES
- FIGURE 11. PRICING ANALYSIS: AUTOMOTIVE COMPOSITES MARKET 2022 AND 2032
- FIGURE 12. IMPACT OF KEY REGULATION: AUTOMOTIVE COMPOSITES MARKET
- FIGURE 13. PATENT ANALYSIS BY COMPANY
- FIGURE 14. PATENT ANALYSIS BY COUNTRY
- FIGURE 15. AUTOMOTIVE COMPOSITES MARKET, BY FIBER TYPE, 2022 AND 2032(%)
- FIGURE 16. COMPARATIVE SHARE ANALYSIS OF AUTOMOTIVE COMPOSITES MARKET FOR GLASS FIBER, BY COUNTRY 2022 AND 2032(%)
- FIGURE 17. COMPARATIVE SHARE ANALYSIS OF AUTOMOTIVE COMPOSITES MARKET FOR CARBON FIBER, BY COUNTRY 2022 AND 2032(%)
- FIGURE 18. COMPARATIVE SHARE ANALYSIS OF AUTOMOTIVE COMPOSITES MARKET FOR OTHERS, BY COUNTRY 2022 AND 2032(%)
- FIGURE 19. AUTOMOTIVE COMPOSITES MARKET, BY RESIN TYPE, 2022 AND 2032(%)
- FIGURE 20. COMPARATIVE SHARE ANALYSIS OF AUTOMOTIVE COMPOSITES MARKET FOR THERMOSET, BY COUNTRY 2022 AND 2032(%)
- FIGURE 21. COMPARATIVE SHARE ANALYSIS OF AUTOMOTIVE COMPOSITES MARKET FOR THERMOPLASTIC, BY COUNTRY 2022 AND 2032(%)
- FIGURE 22. AUTOMOTIVE COMPOSITES MARKET, BY APPLICATION, 2022 AND 2032(%)
- FIGURE 23. COMPARATIVE SHARE ANALYSIS OF AUTOMOTIVE COMPOSITES MARKET FOR EXTERIOR, BY COUNTRY 2022 AND 2032(%)
- FIGURE 24. COMPARATIVE SHARE ANALYSIS OF AUTOMOTIVE COMPOSITES MARKET FOR INTERIOR, BY COUNTRY 2022 AND 2032(%)
- FIGURE 25. COMPARATIVE SHARE ANALYSIS OF AUTOMOTIVE COMPOSITES MARKET FOR OTHERS, BY COUNTRY 2022 AND 2032(%)
- FIGURE 26. AUTOMOTIVE COMPOSITES MARKET BY REGION, 2022 AND 2032(%)
- FIGURE 27. U.S. AUTOMOTIVE COMPOSITES MARKET, 2022-2032 ($MILLION)
- FIGURE 28. CANADA AUTOMOTIVE COMPOSITES MARKET, 2022-2032 ($MILLION)
- FIGURE 29. MEXICO AUTOMOTIVE COMPOSITES MARKET, 2022-2032 ($MILLION)
- FIGURE 30. GERMANY AUTOMOTIVE COMPOSITES MARKET, 2022-2032 ($MILLION)
- FIGURE 31. UK AUTOMOTIVE COMPOSITES MARKET, 2022-2032 ($MILLION)
- FIGURE 32. FRANCE AUTOMOTIVE COMPOSITES MARKET, 2022-2032 ($MILLION)
- FIGURE 33. SPAIN AUTOMOTIVE COMPOSITES MARKET, 2022-2032 ($MILLION)
- FIGURE 34. ITALY AUTOMOTIVE COMPOSITES MARKET, 2022-2032 ($MILLION)
- FIGURE 35. REST OF EUROPE AUTOMOTIVE COMPOSITES MARKET, 2022-2032 ($MILLION)
- FIGURE 36. CHINA AUTOMOTIVE COMPOSITES MARKET, 2022-2032 ($MILLION)
- FIGURE 37. INDIA AUTOMOTIVE COMPOSITES MARKET, 2022-2032 ($MILLION)
- FIGURE 38. JAPAN AUTOMOTIVE COMPOSITES MARKET, 2022-2032 ($MILLION)
- FIGURE 39. SOUTH KOREA AUTOMOTIVE COMPOSITES MARKET, 2022-2032 ($MILLION)
- FIGURE 40. AUSTRALIA AUTOMOTIVE COMPOSITES MARKET, 2022-2032 ($MILLION)
- FIGURE 41. REST OF ASIA-PACIFIC AUTOMOTIVE COMPOSITES MARKET, 2022-2032 ($MILLION)
- FIGURE 42. BRAZIL AUTOMOTIVE COMPOSITES MARKET, 2022-2032 ($MILLION)
- FIGURE 43. SAUDI ARABIA AUTOMOTIVE COMPOSITES MARKET, 2022-2032 ($MILLION)
- FIGURE 44. SOUTH AFRICA AUTOMOTIVE COMPOSITES MARKET, 2022-2032 ($MILLION)
- FIGURE 45. REST OF LAMEA AUTOMOTIVE COMPOSITES MARKET, 2022-2032 ($MILLION)
- FIGURE 46. TOP WINNING STRATEGIES, BY YEAR
- FIGURE 47. TOP WINNING STRATEGIES, BY DEVELOPMENT
- FIGURE 48. TOP WINNING STRATEGIES, BY COMPANY
- FIGURE 49. PRODUCT MAPPING OF TOP 10 PLAYERS
- FIGURE 50. COMPETITIVE DASHBOARD
- FIGURE 51. COMPETITIVE HEATMAP: AUTOMOTIVE COMPOSITES MARKET
- FIGURE 52. TOP PLAYER POSITIONING, 2022
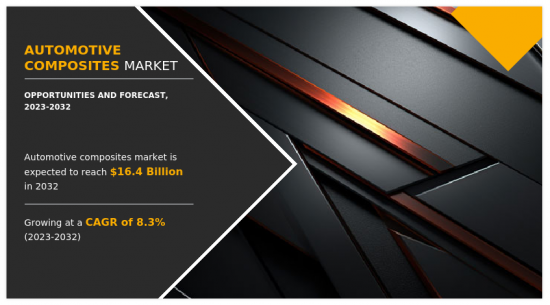
The global automotive composite market was valued at $7.4 billion in 2022 and is estimated to reach $16.4 billion by 2032, exhibiting a CAGR of 8.3% from 2023 to 2032.
Automotive composites are advanced materials used in vehicles, blending various components such as carbon or glass fibers with resin matrix. These composites offer superior strength-to-weight ratios as compared to traditional materials such as steel or aluminum. Employed in body panels, chassis, and structural elements, they enhance performance, durability, and safety. By reducing weight and increasing stiffness, automotive composites contribute to improved fuel efficiency and lower emissions, aligning with industry goals for sustainability and environmental responsibility. Their versatility allows for innovative design solutions, fostering the development of next-generation vehicles that prioritize efficiency, safety, and eco-friendliness in an increasingly competitive automotive landscape.
Sustainability has emerged as a key driver influencing the selection and development of materials in the wearable Technological advancements and material innovations have played a pivotal role in expanding the capabilities and applicability of automotive composites. Through continuous research and development, engineers and scientists have pushed the boundaries of composite materials, enhancing their mechanical properties, durability, and manufacturability. Advanced manufacturing processes, such as automated layup techniques and additive manufacturing, have streamlined production processes and lowered costs, making composites more accessible to automakers. Furthermore, the integration of nanotechnology and smart materials holds immense promise for unlocking new functionalities and performance enhancements in automotive composites. As innovation continues to drive the evolution of composite materials, their adoption across diverse automotive applications is poised to accelerate.
Furthermore, design flexibility and aesthetics represent key differentiators for automotive composites, offering designers unprecedented freedom to create visually striking and aerodynamically efficient vehicles. The ability to mold composites into complex shapes and integrate unique design elements has enabled automakers to differentiate their products and enhance brand identity. Moreover, composites allow for the integration of functional features, such as aerodynamic enhancements and structural reinforcements, without compromising design aesthetics. As consumer preferences gravitate towards distinctive and personalized vehicles, the design flexibility offered by composites will play a pivotal role in shaping future automotive design trends.
However, while composites offer superior design flexibility as compared to metals, they also present unique challenges in terms of design and engineering. Integrating composites into vehicle structures requires advanced design and simulation tools to optimize material usage and ensure structural integrity. Moreover, composites behave differently under various loading conditions as compared to metals, necessitating specialized engineering expertise for effective design solutions. Lack of standardized design guidelines and testing protocols for automotive composites further complicates the design process and increases development lead times.
On the contrary, emerging economies represent untapped potential for the automotive composites market, driven by rise in disposable incomes, urbanization, and infrastructural developments. As these regions experience growing demand for automobiles, there exists a significant opportunity to introduce lightweight composite materials into vehicle manufacturing processes. Collaborating with local automotive manufacturers and investing in infrastructure development can enable composite material suppliers to penetrate emerging markets and capitalize on the burgeoning automotive industry in these regions.
The global automotive composites market profiles leading players that include Toray Industries, Inc., SGL Carbon SE, Teijin Limited, Hexcel Corporation, Owens Corning, Mitsubishi Chemical Holdings Corporation, Gurit Holding AG, Solvay S.A., TenCate Advanced Composites, and Huntsman Corporation.
The global automotive composites market profiles leading players such as Toray Industries, Inc., SGL Carbon SE, Teijin Limited, Hexcel Corporation, Owens Corning, Mitsubishi Chemical Holdings Corporation, Gurit Holding AG, Solvay S.A., TenCate Advanced Composites, and Huntsman Corporation.
Other key players involved in the manufacturing of automotive composites include Magna, Mar-Bal, Plasan, UFP Technologies, Base Group, 3B Fiberglass, Delphi Auto, and others. The global automotive composites market report provides in-depth competitive analysis as well as profiles of these major players.
Key Benefits For Stakeholders
- This report provides a quantitative analysis of the market segments, current trends, estimations, and dynamics of the automotive composites market analysis from 2022 to 2032 to identify the prevailing automotive composites market opportunities.
- The market research is offered along with information related to key drivers, restraints, and opportunities.
- Porter's five forces analysis highlights the potency of buyers and suppliers to enable stakeholders make profit-oriented business decisions and strengthen their supplier-buyer network.
- In-depth analysis of the automotive composites market segmentation assists to determine the prevailing market opportunities.
- Major countries in each region are mapped according to their revenue contribution to the global market.
- Market player positioning facilitates benchmarking and provides a clear understanding of the present position of the market players.
- The report includes the analysis of the regional as well as global automotive composites market trends, key players, market segments, application areas, and market growth strategies.
Additional benefits you will get with this purchase are:
- Quarterly Update and* (only available with a corporate license, on listed price)
- 5 additional Company Profile of client Choice pre- or Post-purchase, as a free update.
- Free Upcoming Version on the Purchase of Five and Enterprise User License.
- 16 analyst hours of support* (post-purchase, if you find additional data requirements upon review of the report, you may receive support amounting to 16 analyst hours to solve questions, and post-sale queries)
- 15% Free Customization* (in case the scope or segment of the report does not match your requirements, 15% is equivalent to 3 working days of free work, applicable once)
- Free data Pack on the Five and Enterprise User License. (Excel version of the report)
- Free Updated report if the report is 6-12 months old or older.
- 24-hour priority response*
- Free Industry updates and white papers.
Possible Customization with this report (with additional cost and timeline, please talk to the sales executive to know more)
- Manufacturing Capacity
- Upcoming/New Entrant by Regions
- Technology Trend Analysis
- Market share analysis of players by products/segments
- New Product Development/ Product Matrix of Key Players
- Patient/epidemiology data at country, region, global level
- Regulatory Guidelines
- Additional company profiles with specific to client's interest
- Additional country or region analysis- market size and forecast
- Average Selling Price Analysis / Price Point Analysis
- Expanded list for Company Profiles
- Historic market data
- Import Export Analysis/Data
- Key player details (including location, contact details, supplier/vendor network etc. in excel format)
- List of customers/consumers/raw material suppliers- value chain analysis
- Market share analysis of players at global/region/country level
- SWOT Analysis
- Volume Market Size and Forecast
Key Market Segments
By Fiber Type
- Glass Fiber
- Carbon Fiber
- Others
By Resin Type
- Thermoset
- Thermoplastic
By Application
- Exterior
- Interior
- Others
By Region
- North America
- U.S.
- Canada
- Mexico
- Europe
- Germany
- UK
- France
- Spain
- Italy
- Rest of Europe
- Asia-Pacific
- China
- India
- Japan
- South Korea
- Australia
- Rest of Asia-Pacific
- LAMEA
- Brazil
- Saudi Arabia
- South Africa
- Rest of LAMEA
Key Market Players:
- TORAY INDUSTRIES, INC.
- SGL Carbon SE
- Teijin Limited
- TEIJIN LIMITED.
- Hexcel Corporation
- Owens Corning
- Mitsubishi Chemical Holdings Corporation
- Gurit Holding AG
- Solvay S.A.
- TenCate Advanced Composites
- Huntsman Corporation
TABLE OF CONTENTS
CHAPTER 1: INTRODUCTION
- 1.1. Report description
- 1.2. Key market segments
- 1.3. Key benefits to the stakeholders
- 1.4. Research methodology
- 1.4.1. Primary research
- 1.4.2. Secondary research
- 1.4.3. Analyst tools and models
CHAPTER 2: EXECUTIVE SUMMARY
- 2.1. CXO perspective
CHAPTER 3: MARKET OVERVIEW
- 3.1. Market definition and scope
- 3.2. Key findings
- 3.2.1. Top impacting factors
- 3.2.2. Top investment pockets
- 3.3. Porter's five forces analysis
- 3.4. Market dynamics
- 3.4.1. Drivers
- 3.4.2. Restraints
- 3.4.3. Opportunities
- 3.5. Value Chain Analysis
- 3.6. Pricing Analysis
- 3.7. Key Regulation Analysis
- 3.8. Patent Landscape
CHAPTER 4: AUTOMOTIVE COMPOSITES MARKET, BY FIBER TYPE
- 4.1. Overview
- 4.1.1. Market size and forecast
- 4.2. Glass Fiber
- 4.2.1. Key market trends, growth factors and opportunities
- 4.2.2. Market size and forecast, by region
- 4.2.3. Market share analysis by country
- 4.3. Carbon Fiber
- 4.3.1. Key market trends, growth factors and opportunities
- 4.3.2. Market size and forecast, by region
- 4.3.3. Market share analysis by country
- 4.4. Others
- 4.4.1. Key market trends, growth factors and opportunities
- 4.4.2. Market size and forecast, by region
- 4.4.3. Market share analysis by country
CHAPTER 5: AUTOMOTIVE COMPOSITES MARKET, BY RESIN TYPE
- 5.1. Overview
- 5.1.1. Market size and forecast
- 5.2. Thermoset
- 5.2.1. Key market trends, growth factors and opportunities
- 5.2.2. Market size and forecast, by region
- 5.2.3. Market share analysis by country
- 5.3. Thermoplastic
- 5.3.1. Key market trends, growth factors and opportunities
- 5.3.2. Market size and forecast, by region
- 5.3.3. Market share analysis by country
CHAPTER 6: AUTOMOTIVE COMPOSITES MARKET, BY APPLICATION
- 6.1. Overview
- 6.1.1. Market size and forecast
- 6.2. Exterior
- 6.2.1. Key market trends, growth factors and opportunities
- 6.2.2. Market size and forecast, by region
- 6.2.3. Market share analysis by country
- 6.3. Interior
- 6.3.1. Key market trends, growth factors and opportunities
- 6.3.2. Market size and forecast, by region
- 6.3.3. Market share analysis by country
- 6.4. Others
- 6.4.1. Key market trends, growth factors and opportunities
- 6.4.2. Market size and forecast, by region
- 6.4.3. Market share analysis by country
CHAPTER 7: AUTOMOTIVE COMPOSITES MARKET, BY REGION
- 7.1. Overview
- 7.1.1. Market size and forecast By Region
- 7.2. North America
- 7.2.1. Key market trends, growth factors and opportunities
- 7.2.2. Market size and forecast, by Fiber Type
- 7.2.3. Market size and forecast, by Resin Type
- 7.2.4. Market size and forecast, by Application
- 7.2.5. Market size and forecast, by country
- 7.2.5.1. U.S.
- 7.2.5.1.1. Market size and forecast, by Fiber Type
- 7.2.5.1.2. Market size and forecast, by Resin Type
- 7.2.5.1.3. Market size and forecast, by Application
- 7.2.5.2. Canada
- 7.2.5.2.1. Market size and forecast, by Fiber Type
- 7.2.5.2.2. Market size and forecast, by Resin Type
- 7.2.5.2.3. Market size and forecast, by Application
- 7.2.5.3. Mexico
- 7.2.5.3.1. Market size and forecast, by Fiber Type
- 7.2.5.3.2. Market size and forecast, by Resin Type
- 7.2.5.3.3. Market size and forecast, by Application
- 7.3. Europe
- 7.3.1. Key market trends, growth factors and opportunities
- 7.3.2. Market size and forecast, by Fiber Type
- 7.3.3. Market size and forecast, by Resin Type
- 7.3.4. Market size and forecast, by Application
- 7.3.5. Market size and forecast, by country
- 7.3.5.1. Germany
- 7.3.5.1.1. Market size and forecast, by Fiber Type
- 7.3.5.1.2. Market size and forecast, by Resin Type
- 7.3.5.1.3. Market size and forecast, by Application
- 7.3.5.2. UK
- 7.3.5.2.1. Market size and forecast, by Fiber Type
- 7.3.5.2.2. Market size and forecast, by Resin Type
- 7.3.5.2.3. Market size and forecast, by Application
- 7.3.5.3. France
- 7.3.5.3.1. Market size and forecast, by Fiber Type
- 7.3.5.3.2. Market size and forecast, by Resin Type
- 7.3.5.3.3. Market size and forecast, by Application
- 7.3.5.4. Spain
- 7.3.5.4.1. Market size and forecast, by Fiber Type
- 7.3.5.4.2. Market size and forecast, by Resin Type
- 7.3.5.4.3. Market size and forecast, by Application
- 7.3.5.5. Italy
- 7.3.5.5.1. Market size and forecast, by Fiber Type
- 7.3.5.5.2. Market size and forecast, by Resin Type
- 7.3.5.5.3. Market size and forecast, by Application
- 7.3.5.6. Rest of Europe
- 7.3.5.6.1. Market size and forecast, by Fiber Type
- 7.3.5.6.2. Market size and forecast, by Resin Type
- 7.3.5.6.3. Market size and forecast, by Application
- 7.4. Asia-Pacific
- 7.4.1. Key market trends, growth factors and opportunities
- 7.4.2. Market size and forecast, by Fiber Type
- 7.4.3. Market size and forecast, by Resin Type
- 7.4.4. Market size and forecast, by Application
- 7.4.5. Market size and forecast, by country
- 7.4.5.1. China
- 7.4.5.1.1. Market size and forecast, by Fiber Type
- 7.4.5.1.2. Market size and forecast, by Resin Type
- 7.4.5.1.3. Market size and forecast, by Application
- 7.4.5.2. India
- 7.4.5.2.1. Market size and forecast, by Fiber Type
- 7.4.5.2.2. Market size and forecast, by Resin Type
- 7.4.5.2.3. Market size and forecast, by Application
- 7.4.5.3. Japan
- 7.4.5.3.1. Market size and forecast, by Fiber Type
- 7.4.5.3.2. Market size and forecast, by Resin Type
- 7.4.5.3.3. Market size and forecast, by Application
- 7.4.5.4. South Korea
- 7.4.5.4.1. Market size and forecast, by Fiber Type
- 7.4.5.4.2. Market size and forecast, by Resin Type
- 7.4.5.4.3. Market size and forecast, by Application
- 7.4.5.5. Australia
- 7.4.5.5.1. Market size and forecast, by Fiber Type
- 7.4.5.5.2. Market size and forecast, by Resin Type
- 7.4.5.5.3. Market size and forecast, by Application
- 7.4.5.6. Rest of Asia-Pacific
- 7.4.5.6.1. Market size and forecast, by Fiber Type
- 7.4.5.6.2. Market size and forecast, by Resin Type
- 7.4.5.6.3. Market size and forecast, by Application
- 7.5. LAMEA
- 7.5.1. Key market trends, growth factors and opportunities
- 7.5.2. Market size and forecast, by Fiber Type
- 7.5.3. Market size and forecast, by Resin Type
- 7.5.4. Market size and forecast, by Application
- 7.5.5. Market size and forecast, by country
- 7.5.5.1. Brazil
- 7.5.5.1.1. Market size and forecast, by Fiber Type
- 7.5.5.1.2. Market size and forecast, by Resin Type
- 7.5.5.1.3. Market size and forecast, by Application
- 7.5.5.2. Saudi Arabia
- 7.5.5.2.1. Market size and forecast, by Fiber Type
- 7.5.5.2.2. Market size and forecast, by Resin Type
- 7.5.5.2.3. Market size and forecast, by Application
- 7.5.5.3. South Africa
- 7.5.5.3.1. Market size and forecast, by Fiber Type
- 7.5.5.3.2. Market size and forecast, by Resin Type
- 7.5.5.3.3. Market size and forecast, by Application
- 7.5.5.4. Rest of LAMEA
- 7.5.5.4.1. Market size and forecast, by Fiber Type
- 7.5.5.4.2. Market size and forecast, by Resin Type
- 7.5.5.4.3. Market size and forecast, by Application
CHAPTER 8: COMPETITIVE LANDSCAPE
- 8.1. Introduction
- 8.2. Top winning strategies
- 8.3. Product mapping of top 10 player
- 8.4. Competitive dashboard
- 8.5. Competitive heatmap
- 8.6. Top player positioning, 2022
CHAPTER 9: COMPANY PROFILES
- 9.1. TORAY INDUSTRIES, INC.
- 9.1.1. Company overview
- 9.1.2. Key executives
- 9.1.3. Company snapshot
- 9.1.4. Operating business segments
- 9.1.5. Product portfolio
- 9.1.6. Business performance
- 9.1.7. Key strategic moves and developments
- 9.2. SGL Carbon SE
- 9.2.1. Company overview
- 9.2.2. Key executives
- 9.2.3. Company snapshot
- 9.2.4. Operating business segments
- 9.2.5. Product portfolio
- 9.2.6. Business performance
- 9.2.7. Key strategic moves and developments
- 9.3. Teijin Limited
- 9.3.1. Company overview
- 9.3.2. Key executives
- 9.3.3. Company snapshot
- 9.3.4. Operating business segments
- 9.3.5. Product portfolio
- 9.3.6. Business performance
- 9.3.7. Key strategic moves and developments
- 9.4. TEIJIN LIMITED.
- 9.4.1. Company overview
- 9.4.2. Key executives
- 9.4.3. Company snapshot
- 9.4.4. Operating business segments
- 9.4.5. Product portfolio
- 9.4.6. Business performance
- 9.4.7. Key strategic moves and developments
- 9.5. Hexcel Corporation
- 9.5.1. Company overview
- 9.5.2. Key executives
- 9.5.3. Company snapshot
- 9.5.4. Operating business segments
- 9.5.5. Product portfolio
- 9.5.6. Business performance
- 9.5.7. Key strategic moves and developments
- 9.6. Owens Corning
- 9.6.1. Company overview
- 9.6.2. Key executives
- 9.6.3. Company snapshot
- 9.6.4. Operating business segments
- 9.6.5. Product portfolio
- 9.6.6. Business performance
- 9.6.7. Key strategic moves and developments
- 9.7. Mitsubishi Chemical Holdings Corporation
- 9.7.1. Company overview
- 9.7.2. Key executives
- 9.7.3. Company snapshot
- 9.7.4. Operating business segments
- 9.7.5. Product portfolio
- 9.7.6. Business performance
- 9.7.7. Key strategic moves and developments
- 9.8. Gurit Holding AG
- 9.8.1. Company overview
- 9.8.2. Key executives
- 9.8.3. Company snapshot
- 9.8.4. Operating business segments
- 9.8.5. Product portfolio
- 9.8.6. Business performance
- 9.8.7. Key strategic moves and developments
- 9.9. Solvay S.A.
- 9.9.1. Company overview
- 9.9.2. Key executives
- 9.9.3. Company snapshot
- 9.9.4. Operating business segments
- 9.9.5. Product portfolio
- 9.9.6. Business performance
- 9.9.7. Key strategic moves and developments
- 9.10. TenCate Advanced Composites
- 9.10.1. Company overview
- 9.10.2. Key executives
- 9.10.3. Company snapshot
- 9.10.4. Operating business segments
- 9.10.5. Product portfolio
- 9.10.6. Business performance
- 9.10.7. Key strategic moves and developments
- 9.11. Huntsman Corporation
- 9.11.1. Company overview
- 9.11.2. Key executives
- 9.11.3. Company snapshot
- 9.11.4. Operating business segments
- 9.11.5. Product portfolio
- 9.11.6. Business performance
- 9.11.7. Key strategic moves and developments
