|
|
市場調査レポート
商品コード
1472299
バイオガス市場:供給源別、用途別:世界の機会分析と産業予測、2023~2032年Biogas Market By Source (Landfill Gas, Livestock Waste, Municipal Waste, Others), By Application (Power Generation, Co-Generation, Buildings, Others): Global Opportunity Analysis and Industry Forecast, 2023-2032 |
||||||
|
|
|||||||
|
|||||||


| バイオガス市場:供給源別、用途別:世界の機会分析と産業予測、2023~2032年 |
|
出版日: 2024年03月01日
発行: Allied Market Research
ページ情報: 英文 250 Pages
納期: 2~3営業日
|

- 全表示
- 概要
- 図表
- 目次
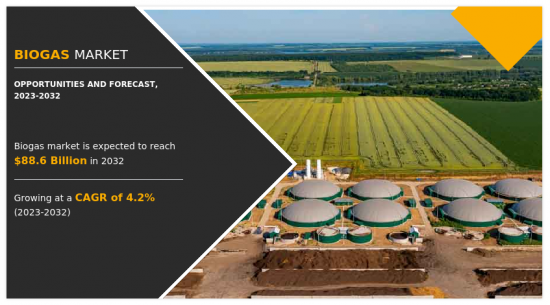
バイオガス市場は2022年に590億米ドルと評価され、2023~2032年のCAGRは4.2%で成長し、2032年には886億米ドルに達すると推定されます。
バイオガスは、嫌気性消化として知られる、酸素のない状態での有機物の分解によって生産される再生可能エネルギー源です。主にメタンと二酸化炭素で構成され、微量の他のガスも含まれます。バイオガス生産の一般的な原料には、農業残渣、家畜ふん尿、下水、生ごみなどがあります。バイオガスは発電、暖房、自動車燃料として利用でき、多用途で環境に優しいエネルギー源です。バイオガスの生産は、気候変動の原因となるメタンを回収し、有機性廃棄物を貴重なエネルギー資源に変換することで、温室効果ガスの排出を緩和するのに役立ちます。
廃棄物管理規制は、持続可能な廃棄物管理慣行の採用を奨励することにより、バイオガス市場の成長を促進する上で重要な役割を果たしています。世界中の政府が環境汚染を緩和し、温室効果ガスの排出を削減するためにより厳しい規制を実施する中、有機廃棄物をより効果的に管理するよう産業界や自治体に対する圧力が高まっています。バイオガス技術は、農業残渣、生ゴミ、下水などの有機廃棄物を貴重な再生可能エネルギーに変換することで、環境に優しいソリューションを記載しています。
廃棄物管理規制が有機廃棄物の埋立地からの転換とメタン排出の削減を義務付けているため、バイオガス生産はコンプライアンス上、魅力的な選択肢となっています。バイオガス施設は、有機廃棄物を効果的に処理し、埋立地での分解や大気中への強力な温室効果ガスであるメタンの放出を防ぐことができます。さらに、バイオガス発電は化石燃料に代わる持続可能な代替燃料となり、二酸化炭素排出量をさらに削減し、気候変動緩和の取り組みに貢献します。バイオガス施設は、再生可能エネルギー発電や有機肥料などの製品別の販売を通じて収益を上げることができます。したがって、廃棄物管理規制はバイオガス市場拡大の原動力となり、持続可能な廃棄物管理慣行と再生可能エネルギー生産を同時に促進します。
バイオガス市場の成長には、土地利用と原料入手の制約が大きな課題となります。バイオガスの生産には、有機廃棄物や農業残渣などの適切な供給原料の入手が不可欠です。しかし、農業、都市開発、自然保護活動の間の土地資源をめぐる競合は、バイオガスプロジェクトに利用可能な原料を制限する可能性があります。農地が限られている地域や土地利用規制が厳しい地域では、適切な原料の調達が難しく、バイオガス生産能力の制約につながる可能性があります。
さらに、原料の質と量は、作物の収穫サイクルや廃棄物の発生パターンなどの要因によって、季節ごとに変動する可能性があります。供給原料の利用可能性が一定でないことは、バイオガスプラントの信頼性と効率性に影響を与え、その経済性と市場全体の成長に影響を及ぼす可能性があります。加えて、バイオガス施設への原料の収集と配送に伴う輸送と物流は、特に有機廃棄物の供給源が分散している地方では、追加コストと物流上の課題が発生する可能性があります。さらに、バイオ燃料やバイオエネルギーなど、他のバイオマス関連産業との原料資源の競合は、バイオガス生産における原料確保の制約をさらに悪化させる。バイオマスの需要が複数のセクターで増加するにつれ、信頼できる持続可能な原料供給の確保はますます困難になっています。
バイオガスをベースとする輸送用燃料の需要増加は、バイオガス市場に有利な機会をもたらします。輸送部門が二酸化炭素排出量を削減し、従来の化石燃料に代わる持続可能な燃料への移行を目指す中、バイオガスは有望なソリューションとして浮上しています。バイオガスは高純度のメタンガスであるバイオメタンに改良することができ、圧縮天然ガス(CNG)や液化天然ガス(LNG)の形で再生可能な輸送用燃料として使用できます。バイオメタンを燃料とする自動車は、ガソリン車やディーゼル車に比べて温室効果ガスの排出量が少なく、大気汚染物質も削減されるなど、環境面で大きなメリットがあります。
さらに、バイオガス由来のバイオメタンを輸送用燃料として使用することは、農業残渣、食品廃棄物、都市固形廃棄物などの有機廃棄物の流れを原料として利用することで、廃棄物管理に貢献します。これは、有機廃棄物を埋立地から転換するのに役立つだけでなく、バイオガスの生産を通じて廃棄物生産者に新たな収入源を提供することにもなります。さらに、バイオメタンガスは、輸入化石燃料への依存度を下げることでエネルギー安全保障の強化に貢献し、輸送用の代替燃料源として持続可能な国産燃料を提供することができます。さらに、再生可能な輸送用燃料の採用を促進するインセンティブや政策、バイオメタンで動く自動車に対する消費者の認識と受容の高まりが、バイオガスをベースとする輸送用燃料の需要をさらに押し上げています。その結果、バイオガス市場は、持続可能な輸送ソリューションに対する需要の高まりから恩恵を受け、投資と市場成長の大きな機会を提供することになります。
バイオガス市場は、供給源、最終用途産業、地域によって区分されます。発生源別では、市場は都市廃棄物、家畜廃棄物、農業廃棄物、その他に分けられます。最終用途産業別では、発電、コージェネレーション、その他に分類されます。地域別では、北米、欧州、アジア太平洋、ラテンアメリカ・中東・アフリカで調査されます。
利害関係者にとっての主要メリット
- 当レポートは、2022~2032年までのバイオガス市場分析の市場セグメント、現在の動向、推定・動向分析、力学の定量的分析を提供し、バイオガス市場の有力な機会を特定します。
- 市場促進要因、市場抑制要因、市場機会に関連する情報とともに市場調査を記載しています。
- ポーターのファイブフォース分析では、利害関係者が利益重視のビジネス決定を下し、サプライヤーとバイヤーのネットワークを強化できるよう、バイヤーとサプライヤーの潜在力を明らかにします。
- バイオガス市場のセグメンテーションの詳細な分析により、市場機会を見極めることができます。
- 各地域の主要国を世界市場への収益貢献度に応じてマッピング。
- 市場参入企業のポジショニングはベンチマーキングを容易にし、市場参入企業の現在のポジションを明確に理解します。
- 本レポートには、地域別と世界のバイオガス市場動向、主要企業、市場セグメント、用途セグメント、市場成長戦略の分析が含まれています。
本レポートのカスタマイズが可能です(別途費用とスケジュールが必要です。)
- 顧客の関心に応じた企業プロファイルの追加
- 国別または地域別の追加分析-市場規模と予測
- SWOT分析
目次
第1章 イントロダクション
第2章 エグゼクティブサマリー
第3章 市場概要
- 市場の定義と範囲
- 主要調査結果
- 影響要因
- 主要投資機会
- ポーターのファイブフォース分析
- 市場力学
- 促進要因
- 抑制要因
- 機会
- バリューチェーン分析
- 主要規制分析
- 特許情勢
第4章 バイオガス市場:供給源別
- 概要
- 埋立地ガス
- 家畜排泄物
- 都市廃棄物
- その他
第5章 バイオガス市場:用途別
- 概要
- 発電
- コジェネレーション
- ビル
- その他
第6章 バイオガス市場:地域別
- 概要
- 北米
- 米国
- カナダ
- メキシコ
- 欧州
- ドイツ
- フランス
- イタリア
- 英国
- スペイン
- その他
- アジア太平洋
- 中国
- 日本
- インド
- 韓国
- オーストラリア
- その他
- ラテンアメリカ・中東・アフリカ
- ブラジル
- サウジアラビア
- 南アフリカ
- その他
第7章 競合情勢
- イントロダクション
- 主要成功戦略
- 主要10社の製品マッピング
- 競合ダッシュボード
- 競合ヒートマップ
- 主要企業のポジショニング、2022年
第8章 企業プロファイル
- Wartsila
- EnviTec Biogas AG
- Air Liquide
- Hindustan Petroleum Corporation Limited
- PlanET Biogas Group GmbH
- BoxLNG Pvt. Ltd.
- Bharat Biogas Energy Ltd.
- Primove Engineering Pvt. Ltd.
- gail gas limited
- GPS Renewables Pvt. Ltd
LIST OF TABLES
- TABLE 01. GLOBAL BIOGAS MARKET, BY SOURCE, 2022-2032 ($MILLION)
- TABLE 02. BIOGAS MARKET FOR LANDFILL GAS, BY REGION, 2022-2032 ($MILLION)
- TABLE 03. BIOGAS MARKET FOR LIVESTOCK WASTE, BY REGION, 2022-2032 ($MILLION)
- TABLE 04. BIOGAS MARKET FOR MUNICIPAL WASTE, BY REGION, 2022-2032 ($MILLION)
- TABLE 05. BIOGAS MARKET FOR OTHERS, BY REGION, 2022-2032 ($MILLION)
- TABLE 06. GLOBAL BIOGAS MARKET, BY APPLICATION, 2022-2032 ($MILLION)
- TABLE 07. BIOGAS MARKET FOR POWER GENERATION, BY REGION, 2022-2032 ($MILLION)
- TABLE 08. BIOGAS MARKET FOR CO-GENERATION, BY REGION, 2022-2032 ($MILLION)
- TABLE 09. BIOGAS MARKET FOR BUILDINGS, BY REGION, 2022-2032 ($MILLION)
- TABLE 10. BIOGAS MARKET FOR OTHERS, BY REGION, 2022-2032 ($MILLION)
- TABLE 11. BIOGAS MARKET, BY REGION, 2022-2032 ($MILLION)
- TABLE 12. NORTH AMERICA BIOGAS MARKET, BY SOURCE, 2022-2032 ($MILLION)
- TABLE 13. NORTH AMERICA BIOGAS MARKET, BY APPLICATION, 2022-2032 ($MILLION)
- TABLE 14. NORTH AMERICA BIOGAS MARKET, BY COUNTRY, 2022-2032 ($MILLION)
- TABLE 15. U.S. BIOGAS MARKET, BY SOURCE, 2022-2032 ($MILLION)
- TABLE 16. U.S. BIOGAS MARKET, BY APPLICATION, 2022-2032 ($MILLION)
- TABLE 17. CANADA BIOGAS MARKET, BY SOURCE, 2022-2032 ($MILLION)
- TABLE 18. CANADA BIOGAS MARKET, BY APPLICATION, 2022-2032 ($MILLION)
- TABLE 19. MEXICO BIOGAS MARKET, BY SOURCE, 2022-2032 ($MILLION)
- TABLE 20. MEXICO BIOGAS MARKET, BY APPLICATION, 2022-2032 ($MILLION)
- TABLE 21. EUROPE BIOGAS MARKET, BY SOURCE, 2022-2032 ($MILLION)
- TABLE 22. EUROPE BIOGAS MARKET, BY APPLICATION, 2022-2032 ($MILLION)
- TABLE 23. EUROPE BIOGAS MARKET, BY COUNTRY, 2022-2032 ($MILLION)
- TABLE 24. GERMANY BIOGAS MARKET, BY SOURCE, 2022-2032 ($MILLION)
- TABLE 25. GERMANY BIOGAS MARKET, BY APPLICATION, 2022-2032 ($MILLION)
- TABLE 26. FRANCE BIOGAS MARKET, BY SOURCE, 2022-2032 ($MILLION)
- TABLE 27. FRANCE BIOGAS MARKET, BY APPLICATION, 2022-2032 ($MILLION)
- TABLE 28. ITALY BIOGAS MARKET, BY SOURCE, 2022-2032 ($MILLION)
- TABLE 29. ITALY BIOGAS MARKET, BY APPLICATION, 2022-2032 ($MILLION)
- TABLE 30. UK BIOGAS MARKET, BY SOURCE, 2022-2032 ($MILLION)
- TABLE 31. UK BIOGAS MARKET, BY APPLICATION, 2022-2032 ($MILLION)
- TABLE 32. SPAIN BIOGAS MARKET, BY SOURCE, 2022-2032 ($MILLION)
- TABLE 33. SPAIN BIOGAS MARKET, BY APPLICATION, 2022-2032 ($MILLION)
- TABLE 34. REST OF EUROPE BIOGAS MARKET, BY SOURCE, 2022-2032 ($MILLION)
- TABLE 35. REST OF EUROPE BIOGAS MARKET, BY APPLICATION, 2022-2032 ($MILLION)
- TABLE 36. ASIA-PACIFIC BIOGAS MARKET, BY SOURCE, 2022-2032 ($MILLION)
- TABLE 37. ASIA-PACIFIC BIOGAS MARKET, BY APPLICATION, 2022-2032 ($MILLION)
- TABLE 38. ASIA-PACIFIC BIOGAS MARKET, BY COUNTRY, 2022-2032 ($MILLION)
- TABLE 39. CHINA BIOGAS MARKET, BY SOURCE, 2022-2032 ($MILLION)
- TABLE 40. CHINA BIOGAS MARKET, BY APPLICATION, 2022-2032 ($MILLION)
- TABLE 41. JAPAN BIOGAS MARKET, BY SOURCE, 2022-2032 ($MILLION)
- TABLE 42. JAPAN BIOGAS MARKET, BY APPLICATION, 2022-2032 ($MILLION)
- TABLE 43. INDIA BIOGAS MARKET, BY SOURCE, 2022-2032 ($MILLION)
- TABLE 44. INDIA BIOGAS MARKET, BY APPLICATION, 2022-2032 ($MILLION)
- TABLE 45. SOUTH KOREA BIOGAS MARKET, BY SOURCE, 2022-2032 ($MILLION)
- TABLE 46. SOUTH KOREA BIOGAS MARKET, BY APPLICATION, 2022-2032 ($MILLION)
- TABLE 47. AUSTRALIA BIOGAS MARKET, BY SOURCE, 2022-2032 ($MILLION)
- TABLE 48. AUSTRALIA BIOGAS MARKET, BY APPLICATION, 2022-2032 ($MILLION)
- TABLE 49. REST OF ASIA-PACIFIC BIOGAS MARKET, BY SOURCE, 2022-2032 ($MILLION)
- TABLE 50. REST OF ASIA-PACIFIC BIOGAS MARKET, BY APPLICATION, 2022-2032 ($MILLION)
- TABLE 51. LAMEA BIOGAS MARKET, BY SOURCE, 2022-2032 ($MILLION)
- TABLE 52. LAMEA BIOGAS MARKET, BY APPLICATION, 2022-2032 ($MILLION)
- TABLE 53. LAMEA BIOGAS MARKET, BY COUNTRY, 2022-2032 ($MILLION)
- TABLE 54. BRAZIL BIOGAS MARKET, BY SOURCE, 2022-2032 ($MILLION)
- TABLE 55. BRAZIL BIOGAS MARKET, BY APPLICATION, 2022-2032 ($MILLION)
- TABLE 56. SAUDI ARABIA BIOGAS MARKET, BY SOURCE, 2022-2032 ($MILLION)
- TABLE 57. SAUDI ARABIA BIOGAS MARKET, BY APPLICATION, 2022-2032 ($MILLION)
- TABLE 58. SOUTH AFRICA BIOGAS MARKET, BY SOURCE, 2022-2032 ($MILLION)
- TABLE 59. SOUTH AFRICA BIOGAS MARKET, BY APPLICATION, 2022-2032 ($MILLION)
- TABLE 60. REST OF LAMEA BIOGAS MARKET, BY SOURCE, 2022-2032 ($MILLION)
- TABLE 61. REST OF LAMEA BIOGAS MARKET, BY APPLICATION, 2022-2032 ($MILLION)
- TABLE 62. WARTSILA: KEY EXECUTIVES
- TABLE 63. WARTSILA: COMPANY SNAPSHOT
- TABLE 64. WARTSILA: PRODUCT SEGMENTS
- TABLE 65. WARTSILA: SERVICE SEGMENTS
- TABLE 66. WARTSILA: PRODUCT PORTFOLIO
- TABLE 67. WARTSILA: KEY STRATERGIES
- TABLE 68. ENVITEC BIOGAS AG: KEY EXECUTIVES
- TABLE 69. ENVITEC BIOGAS AG: COMPANY SNAPSHOT
- TABLE 70. ENVITEC BIOGAS AG: PRODUCT SEGMENTS
- TABLE 71. ENVITEC BIOGAS AG: SERVICE SEGMENTS
- TABLE 72. ENVITEC BIOGAS AG: PRODUCT PORTFOLIO
- TABLE 73. ENVITEC BIOGAS AG: KEY STRATERGIES
- TABLE 74. AIR LIQUIDE: KEY EXECUTIVES
- TABLE 75. AIR LIQUIDE: COMPANY SNAPSHOT
- TABLE 76. AIR LIQUIDE: PRODUCT SEGMENTS
- TABLE 77. AIR LIQUIDE: SERVICE SEGMENTS
- TABLE 78. AIR LIQUIDE: PRODUCT PORTFOLIO
- TABLE 79. AIR LIQUIDE: KEY STRATERGIES
- TABLE 80. HINDUSTAN PETROLEUM CORPORATION LIMITED: KEY EXECUTIVES
- TABLE 81. HINDUSTAN PETROLEUM CORPORATION LIMITED: COMPANY SNAPSHOT
- TABLE 82. HINDUSTAN PETROLEUM CORPORATION LIMITED: PRODUCT SEGMENTS
- TABLE 83. HINDUSTAN PETROLEUM CORPORATION LIMITED: SERVICE SEGMENTS
- TABLE 84. HINDUSTAN PETROLEUM CORPORATION LIMITED: PRODUCT PORTFOLIO
- TABLE 85. HINDUSTAN PETROLEUM CORPORATION LIMITED: KEY STRATERGIES
- TABLE 86. PLANET BIOGAS GROUP GMBH: KEY EXECUTIVES
- TABLE 87. PLANET BIOGAS GROUP GMBH: COMPANY SNAPSHOT
- TABLE 88. PLANET BIOGAS GROUP GMBH: PRODUCT SEGMENTS
- TABLE 89. PLANET BIOGAS GROUP GMBH: SERVICE SEGMENTS
- TABLE 90. PLANET BIOGAS GROUP GMBH: PRODUCT PORTFOLIO
- TABLE 91. PLANET BIOGAS GROUP GMBH: KEY STRATERGIES
- TABLE 92. BOXLNG PVT. LTD.: KEY EXECUTIVES
- TABLE 93. BOXLNG PVT. LTD.: COMPANY SNAPSHOT
- TABLE 94. BOXLNG PVT. LTD.: PRODUCT SEGMENTS
- TABLE 95. BOXLNG PVT. LTD.: SERVICE SEGMENTS
- TABLE 96. BOXLNG PVT. LTD.: PRODUCT PORTFOLIO
- TABLE 97. BOXLNG PVT. LTD.: KEY STRATERGIES
- TABLE 98. BHARAT BIOGAS ENERGY LTD.: KEY EXECUTIVES
- TABLE 99. BHARAT BIOGAS ENERGY LTD.: COMPANY SNAPSHOT
- TABLE 100. BHARAT BIOGAS ENERGY LTD.: PRODUCT SEGMENTS
- TABLE 101. BHARAT BIOGAS ENERGY LTD.: SERVICE SEGMENTS
- TABLE 102. BHARAT BIOGAS ENERGY LTD.: PRODUCT PORTFOLIO
- TABLE 103. BHARAT BIOGAS ENERGY LTD.: KEY STRATERGIES
- TABLE 104. PRIMOVE ENGINEERING PVT. LTD.: KEY EXECUTIVES
- TABLE 105. PRIMOVE ENGINEERING PVT. LTD.: COMPANY SNAPSHOT
- TABLE 106. PRIMOVE ENGINEERING PVT. LTD.: PRODUCT SEGMENTS
- TABLE 107. PRIMOVE ENGINEERING PVT. LTD.: SERVICE SEGMENTS
- TABLE 108. PRIMOVE ENGINEERING PVT. LTD.: PRODUCT PORTFOLIO
- TABLE 109. PRIMOVE ENGINEERING PVT. LTD.: KEY STRATERGIES
- TABLE 110. GAIL GAS LIMITED: KEY EXECUTIVES
- TABLE 111. GAIL GAS LIMITED: COMPANY SNAPSHOT
- TABLE 112. GAIL GAS LIMITED: PRODUCT SEGMENTS
- TABLE 113. GAIL GAS LIMITED: SERVICE SEGMENTS
- TABLE 114. GAIL GAS LIMITED: PRODUCT PORTFOLIO
- TABLE 115. GAIL GAS LIMITED: KEY STRATERGIES
- TABLE 116. GPS RENEWABLES PVT. LTD: KEY EXECUTIVES
- TABLE 117. GPS RENEWABLES PVT. LTD: COMPANY SNAPSHOT
- TABLE 118. GPS RENEWABLES PVT. LTD: PRODUCT SEGMENTS
- TABLE 119. GPS RENEWABLES PVT. LTD: SERVICE SEGMENTS
- TABLE 120. GPS RENEWABLES PVT. LTD: PRODUCT PORTFOLIO
- TABLE 121. GPS RENEWABLES PVT. LTD: KEY STRATERGIES
LIST OF FIGURES
- FIGURE 01. BIOGAS MARKET, 2022-2032
- FIGURE 02. SEGMENTATION OF BIOGAS MARKET,2022-2032
- FIGURE 03. TOP IMPACTING FACTORS IN BIOGAS MARKET
- FIGURE 04. TOP INVESTMENT POCKETS IN BIOGAS MARKET (2023-2032)
- FIGURE 05. BARGAINING POWER OF SUPPLIERS
- FIGURE 06. BARGAINING POWER OF BUYERS
- FIGURE 07. THREAT OF SUBSTITUTION
- FIGURE 08. THREAT OF SUBSTITUTION
- FIGURE 09. COMPETITIVE RIVALRY
- FIGURE 10. GLOBAL BIOGAS MARKET:DRIVERS, RESTRAINTS AND OPPORTUNITIES
- FIGURE 11. IMPACT OF KEY REGULATION: BIOGAS MARKET
- FIGURE 12. PATENT ANALYSIS BY COMPANY
- FIGURE 13. PATENT ANALYSIS BY COUNTRY
- FIGURE 14. BIOGAS MARKET, BY SOURCE, 2022 AND 2032(%)
- FIGURE 15. COMPARATIVE SHARE ANALYSIS OF BIOGAS MARKET FOR LANDFILL GAS, BY COUNTRY 2022 AND 2032(%)
- FIGURE 16. COMPARATIVE SHARE ANALYSIS OF BIOGAS MARKET FOR LIVESTOCK WASTE, BY COUNTRY 2022 AND 2032(%)
- FIGURE 17. COMPARATIVE SHARE ANALYSIS OF BIOGAS MARKET FOR MUNICIPAL WASTE, BY COUNTRY 2022 AND 2032(%)
- FIGURE 18. COMPARATIVE SHARE ANALYSIS OF BIOGAS MARKET FOR OTHERS, BY COUNTRY 2022 AND 2032(%)
- FIGURE 19. BIOGAS MARKET, BY APPLICATION, 2022 AND 2032(%)
- FIGURE 20. COMPARATIVE SHARE ANALYSIS OF BIOGAS MARKET FOR POWER GENERATION, BY COUNTRY 2022 AND 2032(%)
- FIGURE 21. COMPARATIVE SHARE ANALYSIS OF BIOGAS MARKET FOR CO-GENERATION, BY COUNTRY 2022 AND 2032(%)
- FIGURE 22. COMPARATIVE SHARE ANALYSIS OF BIOGAS MARKET FOR BUILDINGS, BY COUNTRY 2022 AND 2032(%)
- FIGURE 23. COMPARATIVE SHARE ANALYSIS OF BIOGAS MARKET FOR OTHERS, BY COUNTRY 2022 AND 2032(%)
- FIGURE 24. BIOGAS MARKET BY REGION, 2022 AND 2032(%)
- FIGURE 25. U.S. BIOGAS MARKET, 2022-2032 ($MILLION)
- FIGURE 26. CANADA BIOGAS MARKET, 2022-2032 ($MILLION)
- FIGURE 27. MEXICO BIOGAS MARKET, 2022-2032 ($MILLION)
- FIGURE 28. GERMANY BIOGAS MARKET, 2022-2032 ($MILLION)
- FIGURE 29. FRANCE BIOGAS MARKET, 2022-2032 ($MILLION)
- FIGURE 30. ITALY BIOGAS MARKET, 2022-2032 ($MILLION)
- FIGURE 31. UK BIOGAS MARKET, 2022-2032 ($MILLION)
- FIGURE 32. SPAIN BIOGAS MARKET, 2022-2032 ($MILLION)
- FIGURE 33. REST OF EUROPE BIOGAS MARKET, 2022-2032 ($MILLION)
- FIGURE 34. CHINA BIOGAS MARKET, 2022-2032 ($MILLION)
- FIGURE 35. JAPAN BIOGAS MARKET, 2022-2032 ($MILLION)
- FIGURE 36. INDIA BIOGAS MARKET, 2022-2032 ($MILLION)
- FIGURE 37. SOUTH KOREA BIOGAS MARKET, 2022-2032 ($MILLION)
- FIGURE 38. AUSTRALIA BIOGAS MARKET, 2022-2032 ($MILLION)
- FIGURE 39. REST OF ASIA-PACIFIC BIOGAS MARKET, 2022-2032 ($MILLION)
- FIGURE 40. BRAZIL BIOGAS MARKET, 2022-2032 ($MILLION)
- FIGURE 41. SAUDI ARABIA BIOGAS MARKET, 2022-2032 ($MILLION)
- FIGURE 42. SOUTH AFRICA BIOGAS MARKET, 2022-2032 ($MILLION)
- FIGURE 43. REST OF LAMEA BIOGAS MARKET, 2022-2032 ($MILLION)
- FIGURE 44. TOP WINNING STRATEGIES, BY YEAR
- FIGURE 45. TOP WINNING STRATEGIES, BY DEVELOPMENT
- FIGURE 46. TOP WINNING STRATEGIES, BY COMPANY
- FIGURE 47. PRODUCT MAPPING OF TOP 10 PLAYERS
- FIGURE 48. COMPETITIVE DASHBOARD
- FIGURE 49. COMPETITIVE HEATMAP: BIOGAS MARKET
- FIGURE 50. TOP PLAYER POSITIONING, 2022
The biogas market was valued at $59.0 billion in 2022, and is estimated to reach $88.6 billion by 2032, growing at a CAGR of 4.2% from 2023 to 2032.
Biogas is a renewable energy source produced through the breakdown of organic matter in the absence of oxygen, a process known as anaerobic digestion. It primarily consists of methane and carbon dioxide, with trace amounts of other gases. Common feedstocks for biogas production include agricultural residues, animal manure, sewage, and food waste. Biogas can be used for electricity generation, heating, and as a vehicle fuel, making it a versatile and environmentally friendly energy source. Its production helps mitigate greenhouse gas emissions by capturing methane, a potent contributor to climate change, and converting organic waste into a valuable energy resource.
Waste management regulations play a crucial role in driving the growth of the biogas market by incentivizing the adoption of sustainable waste management practices. As governments around the globe implement stricter regulations to mitigate environmental pollution and reduce greenhouse gas emissions, there is increasing pressure on industries and municipalities to manage their organic waste more effectively. Biogas technology offers an environmentally friendly solution by converting organic waste materials, such as agricultural residues, food scraps, and sewage, into valuable renewable energy.
With waste management regulations mandating the diversion of organic waste from landfills and the reduction of methane emissions, biogas production becomes an attractive option for compliance. Biogas facilities can effectively treat organic waste, preventing it from decomposing in landfills and releasing methane, a potent greenhouse gas into the atmosphere. Moreover, biogas generation provides a sustainable alternative to fossil fuels, further reducing carbon emissions and contributing to climate change mitigation efforts. Biogas facilities can generate revenue through the sale of renewable energy and by-products, such as organic fertilizers. Therefore, waste management regulations serve as a driving force behind the expansion of the biogas market, fostering sustainable waste management practices and renewable energy production simultaneously.
Land use and feedstock availability constraints pose significant challenges to the growth of the biogas market. The availability of suitable feedstock, such as organic waste and agricultural residues, is essential for biogas production. However, competition for land resources between agriculture, urban development, and conservation efforts can limit the availability of feedstock for biogas projects. In regions with limited agricultural land or strict land-use regulations, sourcing adequate feedstock may be challenging, leading to constraints on biogas production capacity.
Moreover, the quality and quantity of feedstock can vary seasonally, depending on factors such as crop harvesting cycles and waste generation patterns. Inconsistent feedstock availability can impact the reliability and efficiency of biogas plants, affecting their economic viability and overall market growth. In addition, the transportation and logistics involved in collecting and delivering feedstock to biogas facilities can incur additional costs and logistical challenges, particularly in rural areas with dispersed sources of organic waste. Furthermore, competition for feedstock resources from other biomass-based industries, such as biofuels and bioenergy, further exacerbates feedstock availability constraints for biogas production. As demand for biomass increases across multiple sectors, securing a reliable and sustainable supply of feedstock becomes increasingly challenging.
The increasing demand for biogas-based transportation fuels presents lucrative opportunities for the biogas market. As the transportation sector seeks to reduce its carbon footprint and transition towards sustainable alternatives to conventional fossil fuels, biogas emerges as a promising solution. Biogas can be upgraded to biomethane, a high-purity methane gas, which can be used as a renewable transportation fuel in the form of compressed natural gas (CNG) or liquefied natural gas (LNG). Biomethane-powered vehicles offer significant environmental benefits, including lower greenhouse gas emissions and reduced air pollutants compared to gasoline or diesel-powered vehicles.
Moreover, the use of biogas-derived biomethane as a transportation fuel contributes to waste management by utilizing organic waste streams such as agricultural residues, food waste, and municipal solid waste as feedstock. This not only helps divert organic waste from landfills but also provides an additional revenue stream for waste producers through biogas production. In addition, biomethane can help enhance energy security by reducing dependency on imported fossil fuels, thus offering a sustainable and domestically produced alternative fuel source for transportation. Furthermore, incentives and policies promoting the adoption of renewable transportation fuels, along with increasing consumer awareness and acceptance of biomethane-powered vehicles, further drive the demand for biogas-based transportation fuels. As a result, the biogas market stands to benefit from the growing demand for sustainable transportation solutions, offering significant opportunities for investment and market growth.
The biogas market is segmented based on source, end-use industry, and region. As per source, the market is divided into municipal waste, animal waste, agricultural waste, and others. By end-use industry, it is categorized into electricity generation, cogeneration, and others. Region-wise, the market is studied across North America, Europe, Asia-Pacific, and LAMEA.
The major players operating in the global biogas market are Wartsila, EnviTec Biogas AG, Air Liquide USA, Hindustan Petroleum Corporation Limited, India, PlanET Biogas Group, BoxLNG Pvt. Ltd., Bharat Biogas Energy Ltd., Primove Engineering Pvt. Ltd., GAIL Gas Limited, and GPS Renewables Pvt. Ltd. Other players include Green Elephant, IOT, Praj Industries, and SLPP RE.
Key Benefits For Stakeholders
- This report provides a quantitative analysis of the market segments, current trends, estimations, and dynamics of the biogas market analysis from 2022 to 2032 to identify the prevailing biogas market opportunities.
- The market research is offered along with information related to key drivers, restraints, and opportunities.
- Porter's five forces analysis highlights the potency of buyers and suppliers to enable stakeholders make profit-oriented business decisions and strengthen their supplier-buyer network.
- In-depth analysis of the biogas market segmentation assists to determine the prevailing market opportunities.
- Major countries in each region are mapped according to their revenue contribution to the global market.
- Market player positioning facilitates benchmarking and provides a clear understanding of the present position of the market players.
- The report includes the analysis of the regional as well as global biogas market trends, key players, market segments, application areas, and market growth strategies.
Additional benefits you will get with this purchase are:
- Quarterly Update and* (only available with a corporate license, on listed price)
- 5 additional Company Profile of client Choice pre- or Post-purchase, as a free update.
- Free Upcoming Version on the Purchase of Five and Enterprise User License.
- 16 analyst hours of support* (post-purchase, if you find additional data requirements upon review of the report, you may receive support amounting to 16 analyst hours to solve questions, and post-sale queries)
- 15% Free Customization* (in case the scope or segment of the report does not match your requirements, 15% is equivalent to 3 working days of free work, applicable once)
- Free data Pack on the Five and Enterprise User License. (Excel version of the report)
- Free Updated report if the report is 6-12 months old or older.
- 24-hour priority response*
- Free Industry updates and white papers.
Possible Customization with this report (with additional cost and timeline, please talk to the sales executive to know more)
- Additional company profiles with specific to client's interest
- Additional country or region analysis- market size and forecast
- SWOT Analysis
Key Market Segments
By Source
- Landfill Gas
- Livestock Waste
- Municipal Waste
- Others
By Application
- Buildings
- Others
- Power Generation
- Co-Generation
By Region
- North America
- U.S.
- Canada
- Mexico
- Europe
- Germany
- France
- Italy
- UK
- Spain
- Rest of Europe
- Asia-Pacific
- China
- Japan
- India
- South Korea
- Australia
- Rest of Asia-Pacific
- LAMEA
- Brazil
- Saudi Arabia
- South Africa
- Rest of LAMEA
Key Market Players:
- Wartsila
- EnviTec Biogas AG
- Air Liquide
- Hindustan Petroleum Corporation Limited
- PlanET Biogas Group GmbH
- BoxLNG Pvt. Ltd.
- Bharat Biogas Energy Ltd.
- Primove Engineering Pvt. Ltd.
- gail gas limited
- GPS Renewables Pvt. Ltd
TABLE OF CONTENTS
CHAPTER 1: INTRODUCTION
- 1.1. Report description
- 1.2. Key market segments
- 1.3. Key benefits to the stakeholders
- 1.4. Research methodology
- 1.4.1. Primary research
- 1.4.2. Secondary research
- 1.4.3. Analyst tools and models
CHAPTER 2: EXECUTIVE SUMMARY
- 2.1. CXO perspective
CHAPTER 3: MARKET OVERVIEW
- 3.1. Market definition and scope
- 3.2. Key findings
- 3.2.1. Top impacting factors
- 3.2.2. Top investment pockets
- 3.3. Porter's five forces analysis
- 3.4. Market dynamics
- 3.4.1. Drivers
- 3.4.2. Restraints
- 3.4.3. Opportunities
- 3.5. Value Chain Analysis
- 3.6. Key Regulation Analysis
- 3.7. Patent Landscape
CHAPTER 4: BIOGAS MARKET, BY SOURCE
- 4.1. Overview
- 4.1.1. Market size and forecast
- 4.2. Landfill Gas
- 4.2.1. Key market trends, growth factors and opportunities
- 4.2.2. Market size and forecast, by region
- 4.2.3. Market share analysis by country
- 4.3. Livestock Waste
- 4.3.1. Key market trends, growth factors and opportunities
- 4.3.2. Market size and forecast, by region
- 4.3.3. Market share analysis by country
- 4.4. Municipal Waste
- 4.4.1. Key market trends, growth factors and opportunities
- 4.4.2. Market size and forecast, by region
- 4.4.3. Market share analysis by country
- 4.5. Others
- 4.5.1. Key market trends, growth factors and opportunities
- 4.5.2. Market size and forecast, by region
- 4.5.3. Market share analysis by country
CHAPTER 5: BIOGAS MARKET, BY APPLICATION
- 5.1. Overview
- 5.1.1. Market size and forecast
- 5.2. Power Generation
- 5.2.1. Key market trends, growth factors and opportunities
- 5.2.2. Market size and forecast, by region
- 5.2.3. Market share analysis by country
- 5.3. Co-Generation
- 5.3.1. Key market trends, growth factors and opportunities
- 5.3.2. Market size and forecast, by region
- 5.3.3. Market share analysis by country
- 5.4. Buildings
- 5.4.1. Key market trends, growth factors and opportunities
- 5.4.2. Market size and forecast, by region
- 5.4.3. Market share analysis by country
- 5.5. Others
- 5.5.1. Key market trends, growth factors and opportunities
- 5.5.2. Market size and forecast, by region
- 5.5.3. Market share analysis by country
CHAPTER 6: BIOGAS MARKET, BY REGION
- 6.1. Overview
- 6.1.1. Market size and forecast By Region
- 6.2. North America
- 6.2.1. Key market trends, growth factors and opportunities
- 6.2.2. Market size and forecast, by Source
- 6.2.3. Market size and forecast, by Application
- 6.2.4. Market size and forecast, by country
- 6.2.4.1. U.S.
- 6.2.4.1.1. Market size and forecast, by Source
- 6.2.4.1.2. Market size and forecast, by Application
- 6.2.4.2. Canada
- 6.2.4.2.1. Market size and forecast, by Source
- 6.2.4.2.2. Market size and forecast, by Application
- 6.2.4.3. Mexico
- 6.2.4.3.1. Market size and forecast, by Source
- 6.2.4.3.2. Market size and forecast, by Application
- 6.3. Europe
- 6.3.1. Key market trends, growth factors and opportunities
- 6.3.2. Market size and forecast, by Source
- 6.3.3. Market size and forecast, by Application
- 6.3.4. Market size and forecast, by country
- 6.3.4.1. Germany
- 6.3.4.1.1. Market size and forecast, by Source
- 6.3.4.1.2. Market size and forecast, by Application
- 6.3.4.2. France
- 6.3.4.2.1. Market size and forecast, by Source
- 6.3.4.2.2. Market size and forecast, by Application
- 6.3.4.3. Italy
- 6.3.4.3.1. Market size and forecast, by Source
- 6.3.4.3.2. Market size and forecast, by Application
- 6.3.4.4. UK
- 6.3.4.4.1. Market size and forecast, by Source
- 6.3.4.4.2. Market size and forecast, by Application
- 6.3.4.5. Spain
- 6.3.4.5.1. Market size and forecast, by Source
- 6.3.4.5.2. Market size and forecast, by Application
- 6.3.4.6. Rest of Europe
- 6.3.4.6.1. Market size and forecast, by Source
- 6.3.4.6.2. Market size and forecast, by Application
- 6.4. Asia-Pacific
- 6.4.1. Key market trends, growth factors and opportunities
- 6.4.2. Market size and forecast, by Source
- 6.4.3. Market size and forecast, by Application
- 6.4.4. Market size and forecast, by country
- 6.4.4.1. China
- 6.4.4.1.1. Market size and forecast, by Source
- 6.4.4.1.2. Market size and forecast, by Application
- 6.4.4.2. Japan
- 6.4.4.2.1. Market size and forecast, by Source
- 6.4.4.2.2. Market size and forecast, by Application
- 6.4.4.3. India
- 6.4.4.3.1. Market size and forecast, by Source
- 6.4.4.3.2. Market size and forecast, by Application
- 6.4.4.4. South Korea
- 6.4.4.4.1. Market size and forecast, by Source
- 6.4.4.4.2. Market size and forecast, by Application
- 6.4.4.5. Australia
- 6.4.4.5.1. Market size and forecast, by Source
- 6.4.4.5.2. Market size and forecast, by Application
- 6.4.4.6. Rest of Asia-Pacific
- 6.4.4.6.1. Market size and forecast, by Source
- 6.4.4.6.2. Market size and forecast, by Application
- 6.5. LAMEA
- 6.5.1. Key market trends, growth factors and opportunities
- 6.5.2. Market size and forecast, by Source
- 6.5.3. Market size and forecast, by Application
- 6.5.4. Market size and forecast, by country
- 6.5.4.1. Brazil
- 6.5.4.1.1. Market size and forecast, by Source
- 6.5.4.1.2. Market size and forecast, by Application
- 6.5.4.2. Saudi Arabia
- 6.5.4.2.1. Market size and forecast, by Source
- 6.5.4.2.2. Market size and forecast, by Application
- 6.5.4.3. South Africa
- 6.5.4.3.1. Market size and forecast, by Source
- 6.5.4.3.2. Market size and forecast, by Application
- 6.5.4.4. Rest of LAMEA
- 6.5.4.4.1. Market size and forecast, by Source
- 6.5.4.4.2. Market size and forecast, by Application
CHAPTER 7: COMPETITIVE LANDSCAPE
- 7.1. Introduction
- 7.2. Top winning strategies
- 7.3. Product mapping of top 10 player
- 7.4. Competitive dashboard
- 7.5. Competitive heatmap
- 7.6. Top player positioning, 2022
CHAPTER 8: COMPANY PROFILES
- 8.1. Wartsila
- 8.1.1. Company overview
- 8.1.2. Key executives
- 8.1.3. Company snapshot
- 8.1.4. Operating business segments
- 8.1.5. Product portfolio
- 8.1.6. Business performance
- 8.1.7. Key strategic moves and developments
- 8.2. EnviTec Biogas AG
- 8.2.1. Company overview
- 8.2.2. Key executives
- 8.2.3. Company snapshot
- 8.2.4. Operating business segments
- 8.2.5. Product portfolio
- 8.2.6. Business performance
- 8.2.7. Key strategic moves and developments
- 8.3. Air Liquide
- 8.3.1. Company overview
- 8.3.2. Key executives
- 8.3.3. Company snapshot
- 8.3.4. Operating business segments
- 8.3.5. Product portfolio
- 8.3.6. Business performance
- 8.3.7. Key strategic moves and developments
- 8.4. Hindustan Petroleum Corporation Limited
- 8.4.1. Company overview
- 8.4.2. Key executives
- 8.4.3. Company snapshot
- 8.4.4. Operating business segments
- 8.4.5. Product portfolio
- 8.4.6. Business performance
- 8.4.7. Key strategic moves and developments
- 8.5. PlanET Biogas Group GmbH
- 8.5.1. Company overview
- 8.5.2. Key executives
- 8.5.3. Company snapshot
- 8.5.4. Operating business segments
- 8.5.5. Product portfolio
- 8.5.6. Business performance
- 8.5.7. Key strategic moves and developments
- 8.6. BoxLNG Pvt. Ltd.
- 8.6.1. Company overview
- 8.6.2. Key executives
- 8.6.3. Company snapshot
- 8.6.4. Operating business segments
- 8.6.5. Product portfolio
- 8.6.6. Business performance
- 8.6.7. Key strategic moves and developments
- 8.7. Bharat Biogas Energy Ltd.
- 8.7.1. Company overview
- 8.7.2. Key executives
- 8.7.3. Company snapshot
- 8.7.4. Operating business segments
- 8.7.5. Product portfolio
- 8.7.6. Business performance
- 8.7.7. Key strategic moves and developments
- 8.8. Primove Engineering Pvt. Ltd.
- 8.8.1. Company overview
- 8.8.2. Key executives
- 8.8.3. Company snapshot
- 8.8.4. Operating business segments
- 8.8.5. Product portfolio
- 8.8.6. Business performance
- 8.8.7. Key strategic moves and developments
- 8.9. gail gas limited
- 8.9.1. Company overview
- 8.9.2. Key executives
- 8.9.3. Company snapshot
- 8.9.4. Operating business segments
- 8.9.5. Product portfolio
- 8.9.6. Business performance
- 8.9.7. Key strategic moves and developments
- 8.10. GPS Renewables Pvt. Ltd
- 8.10.1. Company overview
- 8.10.2. Key executives
- 8.10.3. Company snapshot
- 8.10.4. Operating business segments
- 8.10.5. Product portfolio
- 8.10.6. Business performance
- 8.10.7. Key strategic moves and developments
