|
|
市場調査レポート
商品コード
1472286
バイオディーゼル市場:原料別、用途別:世界の機会分析と産業予測、2023~2032年Biodiesel Market By Feedstock, By Application : Global Opportunity Analysis and Industry Forecast, 2023-2032 |
||||||
|
|
|||||||
|
|||||||


| バイオディーゼル市場:原料別、用途別:世界の機会分析と産業予測、2023~2032年 |
|
出版日: 2024年03月01日
発行: Allied Market Research
ページ情報: 英文 290 Pages
納期: 2~3営業日
|

- 全表示
- 概要
- 図表
- 目次
バイオディーゼル市場は2022年に509億米ドルと評価され、2023~2032年のCAGRは3.4%で、2032年には709億米ドルに達すると推定されます。
バイオディーゼルは、植物油、動物性油脂、リサイクル食用油から作られる再生可能な生分解性燃料です。従来のディーゼルに代わるこの燃料は、クリーンな燃焼が可能な再生可能燃料として機能し、従来の化石燃料に関連する二酸化炭素排出量の削減を目指した取り組みに貢献しています。バイオディーゼルの生産は多様な原料に依存しており、大豆油やパーム油などの食用植物油と、菜種やジャトロファなどの非食用植物油に分類されます。さらに、リサイクル食用油、動物性油脂、トウモロコシデンプンやサトウキビバガスなどのバイオマス原料もあります。原料の多様性は、バイオディーゼル生産がさまざまな原料に適応できることを裏付けています。
バイオディーゼルの製造プロセスには、塩基触媒による油のトランスエステル化、油の脂肪酸への変換、脂肪酸からのバイオディーゼルの生成を含む多段階の手順であるトランスエステル化が含まれます。この方法は、原料を使用可能なバイオディーゼル燃料に変換するために必要な化学変化を明確にするものです。
市場力学
バイオディーゼル市場の成長を促進する主要要因には、温室効果ガス排出削減に貢献する環境に優しい燃料に対する需要の高まりがあります。補助金や規制措置による政府の支援がバイオディーゼル生産をさらに刺激し、よりクリーンで持続可能なエネルギー源への移行を目指す世界の取り組みと一致しています。
このような前向きな機運にもかかわらず、バイオディーゼル市場には課題も残っています。原料の入手可能性、バイオディーゼル性能に関する懸念、市場の変動といった問題が抑制要因となっています。変動する原料コストや生産効率の課題といった要因は、バイオディーゼルが広く受け入れられ、主流のエネルギーシステムに統合されることに影響を与えます。
バイオディーゼル市場には成長と革新の機会があります。技術の進歩、収率の高い藻類やジャトロファのような代替原料、生産能力の向上、流通・サプライチェーン戦略の強化などが潜在的な機会の一つです。ドイツや英国のような国々におけるバイオディーゼル混合慣行を含む世界のイニシアチブは、今後数年間のバイオディーゼル市場の前向きな展望に寄与しています。
市場促進要因、抑制要因、市場機会については、市場力学をよりよく理解するために本レポートで説明しています。本レポートではさらに、主要投資セグメントをハイライトしています。さらに、欧州バイオディーゼル業界の競合シナリオと各利害関係者の役割を理解するためのポーターのファイブフォース分析も含まれています。研究開発、部品メーカー、組み立て、プログラミングとテスト、マーケティングと販売、顧客、販売後のサービスなど、この業界のバリューチェーン分析についても解説しています。本レポートでは、主要市場参入企業が市場での足場を維持するために採用した戦略を特集しています。さらに、市場シェアを拡大し、業界における激しい競争を維持するための主要企業の競合情勢にもハイライトを当てています。
セグメント概要
バイオディーゼル市場は、原料、用途、国に区分されます。原料別では、再生食用油、動物性油脂、カシューナッツ殻液(CNSL)、蒸留残渣、脂肪酸、パーム油工場廃液(POME)、使用済み漂白土油(SBEO)、その他に分けられます。用途別では、自動車、航空、海洋、発電、その他に分類されます。地域別では、バイオディーゼル市場は北米、欧州、アジア太平洋、ラテンアメリカ・中東・アフリカで分析されます。
原料別では、カシューナッツ殻液がバイオディーゼル市場で最も急成長しているセグメントです。カシューナッツ工業の製品別であるカシューナッツ殻液(CNSL)は、環境の持続可能性と費用対効果の高さから、バイオディーゼル生産の有望な原料です。CNSLの様々な抽出技術により、入手しやすく実現可能です。また、エネルギー産業とカシューナッツ部門との共生関係を促進し、貴重な代替燃料として環境の持続可能性と経済効率に貢献します。
用途別では、バイオディーゼル市場の自動車部門です。バイオディーゼルは様々な比率で従来のディーゼルと混合され、その利点をバランスさせながら、低温流動性や貯蔵安定性といった課題に対処しています。自動車用エンジンメーカーは、バイオディーゼル混合燃料に対応できるようエンジンを改良しています。バイオディーゼルはセタン価が高いため、着火性、燃焼効率、エンジン性能が向上します。バイオディーゼル対応の燃料噴射システムなどの技術の進歩により、バイオディーゼルの利用が促進され、従来の燃料よりもコスト効率が高く、競合が高まっています。
地域別では、アジア太平洋が最も有利な市場であり、予測期間中にCAGR 4.1%で成長すると予想されます。これは、多くの新興国市場が存在することと、インド、中国、インドネシア、その他の国々で混合燃料に関する政府の指令が市場に好影響を与えていることが主要理由です。
主要市場動向
- 原料別では、再生食用油セグメントが市場シェアの3分の1近くを占め最も高いです。
- 用途別では、自動車用が市場シェアの5分の2以上を占め、最も高いです。
- 地域別では、欧州が最も高い市場シェアを占め、2023年の市場シェアのほぼ半分を占める。
利害関係者にとっての主要メリット
- 当レポートでは、2022~2032年にかけてのバイオディーゼル市場分析の市場セグメント、現在の動向、推定、力学を定量的に分析し、バイオディーゼル市場の有力な機会を特定します。
- 市場促進要因、市場抑制要因、市場機会に関連する情報とともに市場調査を記載しています。
- ポーターのファイブフォース分析では、利害関係者が利益重視のビジネス決定を下し、サプライヤーとバイヤーのネットワークを強化できるよう、バイヤーとサプライヤーの潜在力を明らかにします。
- バイオディーゼル市場のセグメンテーションを詳細に分析することで、市場機会を見極めることができます。
- 各地域の主要国は、世界市場への収益貢献度に応じてマッピングされています。
- 市場参入企業のポジショニングはベンチマーキングを容易にし、市場参入企業の現在のポジションを明確に理解することができます。
- 本レポートには、地域と世界のバイオディーゼル市場動向、主要企業、市場セグメント、用途セグメント、市場成長戦略の分析が含まれています。
本レポートで可能なカスタマイズ(追加費用とスケジュールが必要です。)
- 製造能力
- 設備投資の内訳
- 投資機会
- 地域別新規参入企業
- 技術動向分析
- 規制ガイドライン
- 戦略的推奨
- クライアントの関心に特化した追加企業プロファイル
- 国別または地域別の追加分析-市場規模と予測
- 企業プロファイルの拡大リスト
- 過去の市場データ
- 輸出入分析/データ
- 市場規模と予測
目次
第1章 イントロダクション
第2章 エグゼクティブサマリー
第3章 市場概要
- 市場の定義と範囲
- 主要調査結果
- 影響要因
- 主要投資機会
- ポーターのファイブフォース分析
- 市場力学
- 促進要因
- エネルギー安全保障への懸念
- 環境規制
- 再生可能燃料基準の進展
- 抑制要因
- エンジンと燃料の効率
- 初期インフラ・コスト
- 機会
- 政府の支援とインセンティブ
- 促進要因
- バリューチェーン分析
- 主要規制分析
第4章 バイオディーゼル市場:原料別
- 概要
- リサイクル食用油
- 動物性油脂
- カシューナッツ殻液(CNSL)
- 蒸留残渣
- 脂肪酸
- パーム油工場廃液(POME)
- 使用済み白化土類油(SBEO)
- その他
第5章 バイオディーゼル市場:用途別
- 概要
- 自動車
- 航空
- 海洋
- 発電
- その他
第6章 バイオディーゼル市場:地域別
- 概要
- 北米
- 米国
- カナダ
- メキシコ
- 欧州
- ドイツ
- フランス
- イタリア
- スペイン
- 英国
- その他
- アジア太平洋
- 中国
- 日本
- インド
- 韓国
- その他
- ラテンアメリカ・中東・アフリカ
- ブラジル
- 南アフリカ
- サウジアラビア
- その他
第7章 競合情勢
- イントロダクション
- 主要成功戦略
- 主要10社の製品マッピング
- 競合ダッシュボード
- 競合ヒートマップ
- 主要企業のポジショニング、2022年
第8章 企業プロファイル
- Kolmar
- Ital Bi Oil S.R.L.
- Cargill Incorporated
- BP p.l.c.
- Eni S.p.A.
- Eco Fox S.r.l.
- Tamoil Italia S.p.A
- Italiana Petroli S.p.A.
- Esso Italiana S.r.l.
- Saras S.P.A.
- Bunge
- Masol Continental SRL
LIST OF TABLES
- TABLE 01. GLOBAL BIODIESEL MARKET, BY FEEDSTOCK, 2022-2032 ($MILLION)
- TABLE 02. GLOBAL BIODIESEL MARKET, BY FEEDSTOCK, 2022-2032 (MILLION LITERS)
- TABLE 03. BIODIESEL MARKET FOR RECYCLED COOKING OIL, BY REGION, 2022-2032 ($MILLION)
- TABLE 04. BIODIESEL MARKET FOR RECYCLED COOKING OIL, BY REGION, 2022-2032 (MILLION LITERS)
- TABLE 05. BIODIESEL MARKET FOR ANIMAL FATS, BY REGION, 2022-2032 ($MILLION)
- TABLE 06. BIODIESEL MARKET FOR ANIMAL FATS, BY REGION, 2022-2032 (MILLION LITERS)
- TABLE 07. BIODIESEL MARKET FOR CASHEW NUTSHELL LIQUID (CNSL), BY REGION, 2022-2032 ($MILLION)
- TABLE 08. BIODIESEL MARKET FOR CASHEW NUTSHELL LIQUID (CNSL), BY REGION, 2022-2032 (MILLION LITERS)
- TABLE 09. BIODIESEL MARKET FOR DISTILLATION RESIDUES, BY REGION, 2022-2032 ($MILLION)
- TABLE 10. BIODIESEL MARKET FOR DISTILLATION RESIDUES, BY REGION, 2022-2032 (MILLION LITERS)
- TABLE 11. BIODIESEL MARKET FOR FATTY ACIDS, BY REGION, 2022-2032 ($MILLION)
- TABLE 12. BIODIESEL MARKET FOR FATTY ACIDS, BY REGION, 2022-2032 (MILLION LITERS)
- TABLE 13. BIODIESEL MARKET FOR PALM OIL MILL EFFLUENT (POME), BY REGION, 2022-2032 ($MILLION)
- TABLE 14. BIODIESEL MARKET FOR PALM OIL MILL EFFLUENT (POME), BY REGION, 2022-2032 (MILLION LITERS)
- TABLE 15. BIODIESEL MARKET FOR SPENT BLEACHING EARTH OIL (SBEO), BY REGION, 2022-2032 ($MILLION)
- TABLE 16. BIODIESEL MARKET FOR SPENT BLEACHING EARTH OIL (SBEO), BY REGION, 2022-2032 (MILLION LITERS)
- TABLE 17. BIODIESEL MARKET FOR OTHERS, BY REGION, 2022-2032 ($MILLION)
- TABLE 18. BIODIESEL MARKET FOR OTHERS, BY REGION, 2022-2032 (MILLION LITERS)
- TABLE 19. GLOBAL BIODIESEL MARKET, BY APPLICATION, 2022-2032 ($MILLION)
- TABLE 20. GLOBAL BIODIESEL MARKET, BY APPLICATION, 2022-2032 (MILLION LITERS)
- TABLE 21. BIODIESEL MARKET FOR AUTOMOTIVE, BY REGION, 2022-2032 ($MILLION)
- TABLE 22. BIODIESEL MARKET FOR AUTOMOTIVE, BY REGION, 2022-2032 (MILLION LITERS)
- TABLE 23. BIODIESEL MARKET FOR AVIATION, BY REGION, 2022-2032 ($MILLION)
- TABLE 24. BIODIESEL MARKET FOR AVIATION, BY REGION, 2022-2032 (MILLION LITERS)
- TABLE 25. BIODIESEL MARKET FOR MARINE, BY REGION, 2022-2032 ($MILLION)
- TABLE 26. BIODIESEL MARKET FOR MARINE, BY REGION, 2022-2032 (MILLION LITERS)
- TABLE 27. BIODIESEL MARKET FOR POWER GENERATION, BY REGION, 2022-2032 ($MILLION)
- TABLE 28. BIODIESEL MARKET FOR POWER GENERATION, BY REGION, 2022-2032 (MILLION LITERS)
- TABLE 29. BIODIESEL MARKET FOR OTHERS, BY REGION, 2022-2032 ($MILLION)
- TABLE 30. BIODIESEL MARKET FOR OTHERS, BY REGION, 2022-2032 (MILLION LITERS)
- TABLE 31. BIODIESEL MARKET, BY REGION, 2022-2032 ($MILLION)
- TABLE 32. BIODIESEL MARKET, BY REGION, 2022-2032 (MILLION LITERS)
- TABLE 33. NORTH AMERICA BIODIESEL MARKET, BY FEEDSTOCK, 2022-2032 ($MILLION)
- TABLE 34. NORTH AMERICA BIODIESEL MARKET, BY FEEDSTOCK, 2022-2032 (MILLION LITERS)
- TABLE 35. NORTH AMERICA BIODIESEL MARKET, BY APPLICATION, 2022-2032 ($MILLION)
- TABLE 36. NORTH AMERICA BIODIESEL MARKET, BY APPLICATION, 2022-2032 (MILLION LITERS)
- TABLE 37. NORTH AMERICA BIODIESEL MARKET, BY COUNTRY, 2022-2032 ($MILLION)
- TABLE 38. NORTH AMERICA BIODIESEL MARKET, BY COUNTRY, 2022-2032 (MILLION LITERS)
- TABLE 39. U.S. BIODIESEL MARKET, BY FEEDSTOCK, 2022-2032 ($MILLION)
- TABLE 40. U.S. BIODIESEL MARKET, BY FEEDSTOCK, 2022-2032 (MILLION LITERS)
- TABLE 41. U.S. BIODIESEL MARKET, BY APPLICATION, 2022-2032 ($MILLION)
- TABLE 42. U.S. BIODIESEL MARKET, BY APPLICATION, 2022-2032 (MILLION LITERS)
- TABLE 43. CANADA BIODIESEL MARKET, BY FEEDSTOCK, 2022-2032 ($MILLION)
- TABLE 44. CANADA BIODIESEL MARKET, BY FEEDSTOCK, 2022-2032 (MILLION LITERS)
- TABLE 45. CANADA BIODIESEL MARKET, BY APPLICATION, 2022-2032 ($MILLION)
- TABLE 46. CANADA BIODIESEL MARKET, BY APPLICATION, 2022-2032 (MILLION LITERS)
- TABLE 47. MEXICO BIODIESEL MARKET, BY FEEDSTOCK, 2022-2032 ($MILLION)
- TABLE 48. MEXICO BIODIESEL MARKET, BY FEEDSTOCK, 2022-2032 (MILLION LITERS)
- TABLE 49. MEXICO BIODIESEL MARKET, BY APPLICATION, 2022-2032 ($MILLION)
- TABLE 50. MEXICO BIODIESEL MARKET, BY APPLICATION, 2022-2032 (MILLION LITERS)
- TABLE 51. EUROPE BIODIESEL MARKET, BY FEEDSTOCK, 2022-2032 ($MILLION)
- TABLE 52. EUROPE BIODIESEL MARKET, BY FEEDSTOCK, 2022-2032 (MILLION LITERS)
- TABLE 53. EUROPE BIODIESEL MARKET, BY APPLICATION, 2022-2032 ($MILLION)
- TABLE 54. EUROPE BIODIESEL MARKET, BY APPLICATION, 2022-2032 (MILLION LITERS)
- TABLE 55. EUROPE BIODIESEL MARKET, BY COUNTRY, 2022-2032 ($MILLION)
- TABLE 56. EUROPE BIODIESEL MARKET, BY COUNTRY, 2022-2032 (MILLION LITERS)
- TABLE 57. GERMANY BIODIESEL MARKET, BY FEEDSTOCK, 2022-2032 ($MILLION)
- TABLE 58. GERMANY BIODIESEL MARKET, BY FEEDSTOCK, 2022-2032 (MILLION LITERS)
- TABLE 59. GERMANY BIODIESEL MARKET, BY APPLICATION, 2022-2032 ($MILLION)
- TABLE 60. GERMANY BIODIESEL MARKET, BY APPLICATION, 2022-2032 (MILLION LITERS)
- TABLE 61. FRANCE BIODIESEL MARKET, BY FEEDSTOCK, 2022-2032 ($MILLION)
- TABLE 62. FRANCE BIODIESEL MARKET, BY FEEDSTOCK, 2022-2032 (MILLION LITERS)
- TABLE 63. FRANCE BIODIESEL MARKET, BY APPLICATION, 2022-2032 ($MILLION)
- TABLE 64. FRANCE BIODIESEL MARKET, BY APPLICATION, 2022-2032 (MILLION LITERS)
- TABLE 65. ITALY BIODIESEL MARKET, BY FEEDSTOCK, 2022-2032 ($MILLION)
- TABLE 66. ITALY BIODIESEL MARKET, BY FEEDSTOCK, 2022-2032 (MILLION LITERS)
- TABLE 67. ITALY BIODIESEL MARKET, BY APPLICATION, 2022-2032 ($MILLION)
- TABLE 68. ITALY BIODIESEL MARKET, BY APPLICATION, 2022-2032 (MILLION LITERS)
- TABLE 69. SPAIN BIODIESEL MARKET, BY FEEDSTOCK, 2022-2032 ($MILLION)
- TABLE 70. SPAIN BIODIESEL MARKET, BY FEEDSTOCK, 2022-2032 (MILLION LITERS)
- TABLE 71. SPAIN BIODIESEL MARKET, BY APPLICATION, 2022-2032 ($MILLION)
- TABLE 72. SPAIN BIODIESEL MARKET, BY APPLICATION, 2022-2032 (MILLION LITERS)
- TABLE 73. UK BIODIESEL MARKET, BY FEEDSTOCK, 2022-2032 ($MILLION)
- TABLE 74. UK BIODIESEL MARKET, BY FEEDSTOCK, 2022-2032 (MILLION LITERS)
- TABLE 75. UK BIODIESEL MARKET, BY APPLICATION, 2022-2032 ($MILLION)
- TABLE 76. UK BIODIESEL MARKET, BY APPLICATION, 2022-2032 (MILLION LITERS)
- TABLE 77. REST OF EUROPE BIODIESEL MARKET, BY FEEDSTOCK, 2022-2032 ($MILLION)
- TABLE 78. REST OF EUROPE BIODIESEL MARKET, BY FEEDSTOCK, 2022-2032 (MILLION LITERS)
- TABLE 79. REST OF EUROPE BIODIESEL MARKET, BY APPLICATION, 2022-2032 ($MILLION)
- TABLE 80. REST OF EUROPE BIODIESEL MARKET, BY APPLICATION, 2022-2032 (MILLION LITERS)
- TABLE 81. ASIA-PACIFIC BIODIESEL MARKET, BY FEEDSTOCK, 2022-2032 ($MILLION)
- TABLE 82. ASIA-PACIFIC BIODIESEL MARKET, BY FEEDSTOCK, 2022-2032 (MILLION LITERS)
- TABLE 83. ASIA-PACIFIC BIODIESEL MARKET, BY APPLICATION, 2022-2032 ($MILLION)
- TABLE 84. ASIA-PACIFIC BIODIESEL MARKET, BY APPLICATION, 2022-2032 (MILLION LITERS)
- TABLE 85. ASIA-PACIFIC BIODIESEL MARKET, BY COUNTRY, 2022-2032 ($MILLION)
- TABLE 86. ASIA-PACIFIC BIODIESEL MARKET, BY COUNTRY, 2022-2032 (MILLION LITERS)
- TABLE 87. CHINA BIODIESEL MARKET, BY FEEDSTOCK, 2022-2032 ($MILLION)
- TABLE 88. CHINA BIODIESEL MARKET, BY FEEDSTOCK, 2022-2032 (MILLION LITERS)
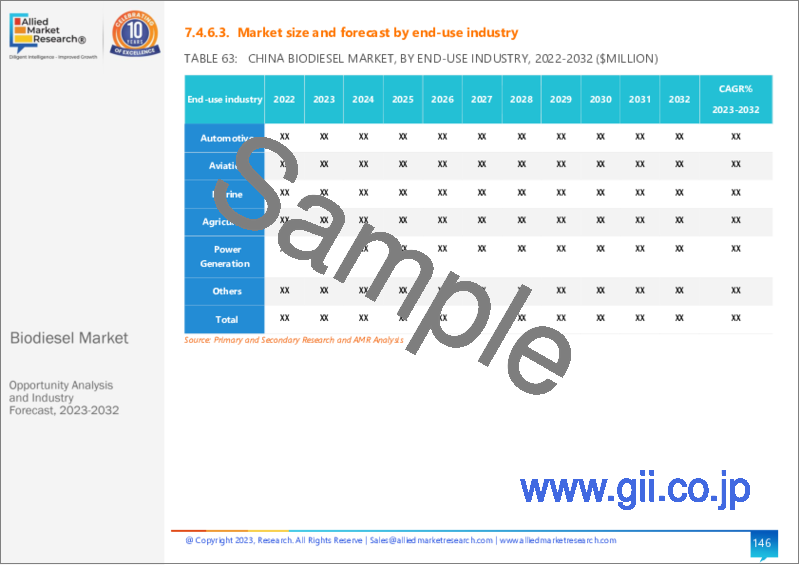
- TABLE 89. CHINA BIODIESEL MARKET, BY APPLICATION, 2022-2032 ($MILLION)
- TABLE 90. CHINA BIODIESEL MARKET, BY APPLICATION, 2022-2032 (MILLION LITERS)
- TABLE 91. JAPAN BIODIESEL MARKET, BY FEEDSTOCK, 2022-2032 ($MILLION)
- TABLE 92. JAPAN BIODIESEL MARKET, BY FEEDSTOCK, 2022-2032 (MILLION LITERS)
- TABLE 93. JAPAN BIODIESEL MARKET, BY APPLICATION, 2022-2032 ($MILLION)
- TABLE 94. JAPAN BIODIESEL MARKET, BY APPLICATION, 2022-2032 (MILLION LITERS)
- TABLE 95. INDIA BIODIESEL MARKET, BY FEEDSTOCK, 2022-2032 ($MILLION)
- TABLE 96. INDIA BIODIESEL MARKET, BY FEEDSTOCK, 2022-2032 (MILLION LITERS)
- TABLE 97. INDIA BIODIESEL MARKET, BY APPLICATION, 2022-2032 ($MILLION)
- TABLE 98. INDIA BIODIESEL MARKET, BY APPLICATION, 2022-2032 (MILLION LITERS)
- TABLE 99. SOUTH KOREA BIODIESEL MARKET, BY FEEDSTOCK, 2022-2032 ($MILLION)
- TABLE 100. SOUTH KOREA BIODIESEL MARKET, BY FEEDSTOCK, 2022-2032 (MILLION LITERS)
- TABLE 101. SOUTH KOREA BIODIESEL MARKET, BY APPLICATION, 2022-2032 ($MILLION)
- TABLE 102. SOUTH KOREA BIODIESEL MARKET, BY APPLICATION, 2022-2032 (MILLION LITERS)
- TABLE 103. REST OF ASIA-PACIFIC BIODIESEL MARKET, BY FEEDSTOCK, 2022-2032 ($MILLION)
- TABLE 104. REST OF ASIA-PACIFIC BIODIESEL MARKET, BY FEEDSTOCK, 2022-2032 (MILLION LITERS)
- TABLE 105. REST OF ASIA-PACIFIC BIODIESEL MARKET, BY APPLICATION, 2022-2032 ($MILLION)
- TABLE 106. REST OF ASIA-PACIFIC BIODIESEL MARKET, BY APPLICATION, 2022-2032 (MILLION LITERS)
- TABLE 107. LAMEA BIODIESEL MARKET, BY FEEDSTOCK, 2022-2032 ($MILLION)
- TABLE 108. LAMEA BIODIESEL MARKET, BY FEEDSTOCK, 2022-2032 (MILLION LITERS)
- TABLE 109. LAMEA BIODIESEL MARKET, BY APPLICATION, 2022-2032 ($MILLION)
- TABLE 110. LAMEA BIODIESEL MARKET, BY APPLICATION, 2022-2032 (MILLION LITERS)
- TABLE 111. LAMEA BIODIESEL MARKET, BY COUNTRY, 2022-2032 ($MILLION)
- TABLE 112. LAMEA BIODIESEL MARKET, BY COUNTRY, 2022-2032 (MILLION LITERS)
- TABLE 113. BRAZIL BIODIESEL MARKET, BY FEEDSTOCK, 2022-2032 ($MILLION)
- TABLE 114. BRAZIL BIODIESEL MARKET, BY FEEDSTOCK, 2022-2032 (MILLION LITERS)
- TABLE 115. BRAZIL BIODIESEL MARKET, BY APPLICATION, 2022-2032 ($MILLION)
- TABLE 116. BRAZIL BIODIESEL MARKET, BY APPLICATION, 2022-2032 (MILLION LITERS)
- TABLE 117. SOUTH AFRICA BIODIESEL MARKET, BY FEEDSTOCK, 2022-2032 ($MILLION)
- TABLE 118. SOUTH AFRICA BIODIESEL MARKET, BY FEEDSTOCK, 2022-2032 (MILLION LITERS)
- TABLE 119. SOUTH AFRICA BIODIESEL MARKET, BY APPLICATION, 2022-2032 ($MILLION)
- TABLE 120. SOUTH AFRICA BIODIESEL MARKET, BY APPLICATION, 2022-2032 (MILLION LITERS)
- TABLE 121. SAUDI ARABIA BIODIESEL MARKET, BY FEEDSTOCK, 2022-2032 ($MILLION)
- TABLE 122. SAUDI ARABIA BIODIESEL MARKET, BY FEEDSTOCK, 2022-2032 (MILLION LITERS)
- TABLE 123. SAUDI ARABIA BIODIESEL MARKET, BY APPLICATION, 2022-2032 ($MILLION)
- TABLE 124. SAUDI ARABIA BIODIESEL MARKET, BY APPLICATION, 2022-2032 (MILLION LITERS)
- TABLE 125. REST OF LAMEA BIODIESEL MARKET, BY FEEDSTOCK, 2022-2032 ($MILLION)
- TABLE 126. REST OF LAMEA BIODIESEL MARKET, BY FEEDSTOCK, 2022-2032 (MILLION LITERS)
- TABLE 127. REST OF LAMEA BIODIESEL MARKET, BY APPLICATION, 2022-2032 ($MILLION)
- TABLE 128. REST OF LAMEA BIODIESEL MARKET, BY APPLICATION, 2022-2032 (MILLION LITERS)
- TABLE 129. KOLMAR: KEY EXECUTIVES
- TABLE 130. KOLMAR: COMPANY SNAPSHOT
- TABLE 131. KOLMAR: PRODUCT SEGMENTS
- TABLE 132. KOLMAR: PRODUCT PORTFOLIO
- TABLE 133. ITAL BI OIL S.R.L.: KEY EXECUTIVES
- TABLE 134. ITAL BI OIL S.R.L.: COMPANY SNAPSHOT
- TABLE 135. ITAL BI OIL S.R.L.: PRODUCT SEGMENTS
- TABLE 136. ITAL BI OIL S.R.L.: PRODUCT PORTFOLIO
- TABLE 137. CARGILL INCORPORATED: KEY EXECUTIVES
- TABLE 138. CARGILL INCORPORATED: COMPANY SNAPSHOT
- TABLE 139. CARGILL INCORPORATED: PRODUCT SEGMENTS
- TABLE 140. CARGILL INCORPORATED: PRODUCT PORTFOLIO
- TABLE 141. CARGILL INCORPORATED: KEY STRATERGIES
- TABLE 142. BP P.L.C.: KEY EXECUTIVES
- TABLE 143. BP P.L.C.: COMPANY SNAPSHOT
- TABLE 144. BP P.L.C.: PRODUCT SEGMENTS
- TABLE 145. BP P.L.C.: PRODUCT PORTFOLIO
- TABLE 146. ENI S.P.A.: KEY EXECUTIVES
- TABLE 147. ENI S.P.A.: COMPANY SNAPSHOT
- TABLE 148. ENI S.P.A.: PRODUCT SEGMENTS
- TABLE 149. ENI S.P.A.: PRODUCT PORTFOLIO
- TABLE 150. ECO FOX S.R.L.: KEY EXECUTIVES
- TABLE 151. ECO FOX S.R.L.: COMPANY SNAPSHOT
- TABLE 152. ECO FOX S.R.L.: PRODUCT SEGMENTS
- TABLE 153. ECO FOX S.R.L.: PRODUCT PORTFOLIO
- TABLE 154. TAMOIL ITALIA S.P.A: KEY EXECUTIVES
- TABLE 155. TAMOIL ITALIA S.P.A: COMPANY SNAPSHOT
- TABLE 156. TAMOIL ITALIA S.P.A: PRODUCT SEGMENTS
- TABLE 157. TAMOIL ITALIA S.P.A: PRODUCT PORTFOLIO
- TABLE 158. ITALIANA PETROLI S.P.A.: KEY EXECUTIVES
- TABLE 159. ITALIANA PETROLI S.P.A.: COMPANY SNAPSHOT
- TABLE 160. ITALIANA PETROLI S.P.A.: PRODUCT SEGMENTS
- TABLE 161. ITALIANA PETROLI S.P.A.: SERVICE SEGMENTS
- TABLE 162. ITALIANA PETROLI S.P.A.: PRODUCT PORTFOLIO
- TABLE 163. ESSO ITALIANA S.R.L.: KEY EXECUTIVES
- TABLE 164. ESSO ITALIANA S.R.L.: COMPANY SNAPSHOT
- TABLE 165. ESSO ITALIANA S.R.L.: PRODUCT SEGMENTS
- TABLE 166. ESSO ITALIANA S.R.L.: PRODUCT PORTFOLIO
- TABLE 167. ESSO ITALIANA S.R.L.: KEY STRATERGIES
- TABLE 168. SARAS S.P.A.: KEY EXECUTIVES
- TABLE 169. SARAS S.P.A.: COMPANY SNAPSHOT
- TABLE 170. SARAS S.P.A.: PRODUCT SEGMENTS
- TABLE 171. SARAS S.P.A.: PRODUCT PORTFOLIO
- TABLE 172. BUNGE: KEY EXECUTIVES
- TABLE 173. BUNGE: COMPANY SNAPSHOT
- TABLE 174. BUNGE: PRODUCT SEGMENTS
- TABLE 175. BUNGE: PRODUCT PORTFOLIO
- TABLE 176. MASOL CONTINENTAL SRL: KEY EXECUTIVES
- TABLE 177. MASOL CONTINENTAL SRL: COMPANY SNAPSHOT
- TABLE 178. MASOL CONTINENTAL SRL: PRODUCT SEGMENTS
- TABLE 179. MASOL CONTINENTAL SRL: PRODUCT PORTFOLIO
LIST OF FIGURES
- FIGURE 01. BIODIESEL MARKET, 2022-2032
- FIGURE 02. SEGMENTATION OF BIODIESEL MARKET,2022-2032
- FIGURE 03. TOP IMPACTING FACTORS IN BIODIESEL MARKET (2022 TO 2032)
- FIGURE 04. TOP INVESTMENT POCKETS IN BIODIESEL MARKET (2023-2032)
- FIGURE 05. LOW BARGAINING POWER OF SUPPLIERS
- FIGURE 06. LOW THREAT OF NEW ENTRANTS
- FIGURE 07. LOW THREAT OF SUBSTITUTES
- FIGURE 08. LOW INTENSITY OF RIVALRY
- FIGURE 09. LOW BARGAINING POWER OF BUYERS
- FIGURE 10. GLOBAL BIODIESEL MARKET:DRIVERS, RESTRAINTS AND OPPORTUNITIES
- FIGURE 11. IMPACT OF KEY REGULATION: BIODIESEL MARKET
- FIGURE 12. BIODIESEL MARKET, BY FEEDSTOCK, 2022 AND 2032(%)
- FIGURE 13. COMPARATIVE SHARE ANALYSIS OF BIODIESEL MARKET FOR RECYCLED COOKING OIL, BY COUNTRY 2022 AND 2032(%)
- FIGURE 14. COMPARATIVE SHARE ANALYSIS OF BIODIESEL MARKET FOR ANIMAL FATS, BY COUNTRY 2022 AND 2032(%)
- FIGURE 15. COMPARATIVE SHARE ANALYSIS OF BIODIESEL MARKET FOR CASHEW NUTSHELL LIQUID (CNSL), BY COUNTRY 2022 AND 2032(%)
- FIGURE 16. COMPARATIVE SHARE ANALYSIS OF BIODIESEL MARKET FOR DISTILLATION RESIDUES, BY COUNTRY 2022 AND 2032(%)
- FIGURE 17. COMPARATIVE SHARE ANALYSIS OF BIODIESEL MARKET FOR FATTY ACIDS, BY COUNTRY 2022 AND 2032(%)
- FIGURE 18. COMPARATIVE SHARE ANALYSIS OF BIODIESEL MARKET FOR PALM OIL MILL EFFLUENT (POME), BY COUNTRY 2022 AND 2032(%)
- FIGURE 19. COMPARATIVE SHARE ANALYSIS OF BIODIESEL MARKET FOR SPENT BLEACHING EARTH OIL (SBEO), BY COUNTRY 2022 AND 2032(%)
- FIGURE 20. COMPARATIVE SHARE ANALYSIS OF BIODIESEL MARKET FOR OTHERS, BY COUNTRY 2022 AND 2032(%)
- FIGURE 21. BIODIESEL MARKET, BY APPLICATION, 2022 AND 2032(%)
- FIGURE 22. COMPARATIVE SHARE ANALYSIS OF BIODIESEL MARKET FOR AUTOMOTIVE, BY COUNTRY 2022 AND 2032(%)
- FIGURE 23. COMPARATIVE SHARE ANALYSIS OF BIODIESEL MARKET FOR AVIATION, BY COUNTRY 2022 AND 2032(%)
- FIGURE 24. COMPARATIVE SHARE ANALYSIS OF BIODIESEL MARKET FOR MARINE, BY COUNTRY 2022 AND 2032(%)
- FIGURE 25. COMPARATIVE SHARE ANALYSIS OF BIODIESEL MARKET FOR POWER GENERATION, BY COUNTRY 2022 AND 2032(%)
- FIGURE 26. COMPARATIVE SHARE ANALYSIS OF BIODIESEL MARKET FOR OTHERS, BY COUNTRY 2022 AND 2032(%)
- FIGURE 27. BIODIESEL MARKET BY REGION, 2022 AND 2032(%)
- FIGURE 28. U.S. BIODIESEL MARKET, 2022-2032 ($MILLION)
- FIGURE 29. CANADA BIODIESEL MARKET, 2022-2032 ($MILLION)
- FIGURE 30. MEXICO BIODIESEL MARKET, 2022-2032 ($MILLION)
- FIGURE 31. GERMANY BIODIESEL MARKET, 2022-2032 ($MILLION)
- FIGURE 32. FRANCE BIODIESEL MARKET, 2022-2032 ($MILLION)
- FIGURE 33. ITALY BIODIESEL MARKET, 2022-2032 ($MILLION)
- FIGURE 34. SPAIN BIODIESEL MARKET, 2022-2032 ($MILLION)
- FIGURE 35. UK BIODIESEL MARKET, 2022-2032 ($MILLION)
- FIGURE 36. REST OF EUROPE BIODIESEL MARKET, 2022-2032 ($MILLION)
- FIGURE 37. CHINA BIODIESEL MARKET, 2022-2032 ($MILLION)
- FIGURE 38. JAPAN BIODIESEL MARKET, 2022-2032 ($MILLION)
- FIGURE 39. INDIA BIODIESEL MARKET, 2022-2032 ($MILLION)
- FIGURE 40. SOUTH KOREA BIODIESEL MARKET, 2022-2032 ($MILLION)
- FIGURE 41. REST OF ASIA-PACIFIC BIODIESEL MARKET, 2022-2032 ($MILLION)
- FIGURE 42. BRAZIL BIODIESEL MARKET, 2022-2032 ($MILLION)
- FIGURE 43. SOUTH AFRICA BIODIESEL MARKET, 2022-2032 ($MILLION)
- FIGURE 44. SAUDI ARABIA BIODIESEL MARKET, 2022-2032 ($MILLION)
- FIGURE 45. REST OF LAMEA BIODIESEL MARKET, 2022-2032 ($MILLION)
- FIGURE 46. TOP WINNING STRATEGIES, BY YEAR (2022-2022)
- FIGURE 47. TOP WINNING STRATEGIES, BY DEVELOPMENT (2022-2022)
- FIGURE 48. TOP WINNING STRATEGIES, BY COMPANY (2022-2022)
- FIGURE 49. PRODUCT MAPPING OF TOP 10 PLAYERS
- FIGURE 50. COMPETITIVE DASHBOARD
- FIGURE 51. COMPETITIVE HEATMAP: BIODIESEL MARKET
- FIGURE 52. TOP PLAYER POSITIONING, 2022
- FIGURE 53. CARGILL INCORPORATED: NET REVENUE, 2021-2023 ($BILLION)
- FIGURE 54. ENI S.P.A.: NET SALES, 2020-2022 ($MILLION)
- FIGURE 55. ENI S.P.A.: REVENUE SHARE BY SEGMENT, 2022 (%)
- FIGURE 56. ENI S.P.A.: REVENUE SHARE BY REGION, 2022 (%)
- FIGURE 57. SARAS S.P.A.: NET REVENUE, 2020-2022 ($MILLION)
- FIGURE 58. SARAS S.P.A.: REVENUE SHARE BY REGION, 2022 (%)
- FIGURE 59. BUNGE: NET REVENUE, 2020-2022 ($MILLION)
- FIGURE 60. BUNGE: REVENUE SHARE BY SEGMENT, 2022 (%)
- FIGURE 61. BUNGE: REVENUE SHARE BY REGION, 2022 (%)
The biodiesel market was valued at $50.9 billion in 2022 and is estimated to reach $70.9 billion by 2032, exhibiting a CAGR of 3.4% from 2023 to 2032.
Biodiesel is a renewable and biodegradable fuel crafted from vegetable oils, animal fats, and recycled cooking oils. This alternative to conventional diesel serves as a clean-burning renewable fuel, contributing to efforts aimed at reducing the carbon footprint associated with traditional fossil fuels. Biodiesel production relies on diverse feedstocks, categorized into edible vegetable oils such as soybean and palm oil, and non-edible options like rapeseed and jatropha. Additional sources encompass recycled cooking oil, animal fats, and biomass feedstocks such as corn starch and sugarcane bagasse. The variety of feedstocks underscores the adaptability of biodiesel production to different raw materials.
The manufacturing process of biodiesel involves transesterification, a multi-step procedure that includes base-catalyzed transesterification of oil, conversion of oils to fatty acids, and the ultimate formation of biodiesel from these fatty acids. This method underscores the chemical transformation required to convert feedstocks into usable biodiesel fuel.
Market Dynamics
Key drivers propelling the growth of the biodiesel market include the rising demand for environmentally friendly fuels that contribute to greenhouse gas emission reduction. Government support, manifested through subsidies and regulatory measures, further stimulates biodiesel production, aligning with global efforts to transition towards cleaner and sustainable energy sources.
Despite the positive momentum, challenges persist in the biodiesel market. Issues like feedstock availability, concerns related to biodiesel performance, and market fluctuations pose restraints. Factors such as fluctuating feedstock costs and production efficiency challenges impact the broader acceptance and integration of biodiesel into mainstream energy systems.
The biodiesel market presents opportunities for growth and innovation. Advancements in technology, alternative raw materials like algae and jatropha with higher yields, improvements in production capacity, and enhanced distribution and supply chain strategies are among the potential opportunities. Global initiatives, including biodiesel blending practices in countries like Germany, and UK, contribute to the positive outlook for the biodiesel market in the coming years.
The growth drivers, restraints, and opportunities are explained in the report to better understand the market dynamics. This report further highlights the key areas of investment. In addition, it includes Porter's five forces analysis to understand the competitive scenario of the Europe biodiesel industry and role of each stakeholder. Value chain analysis for this industry, which includes R&D, components manufacturers, assembly, programming & testing, marketing & sales, customers, and post-sales services, is explained. The report features the strategies adopted by key market players to maintain their foothold in the market. Furthermore, it highlights the competitive landscape of the key players to increase their market share and sustain intense competition in the industry.
Segments Overview
The Biodiesel market is segmented into feedstock, application, and country. By feedstock, the market is divided into recycled cooking oil, animal fats, cashew nutshell liquid (CNSL), distillation residues, fatty acids, palm oil mill effluent (POME), spent bleaching earth oil (SBEO), and others. By application, it is segregated into automotive, aviation, marine, power generation, and others. On the basis of region, the Biodiesel market is analyzed across North America, Europe, Asia-Pacific, and LAMEA.
On the basis of feedstock, the cashew nutshell liquid is the fastest-growing segment of the biodiesel market. Cashew Nutshell Liquid (CNSL), a by-product of the cashew industry, is a promising feedstock for biodiesel production due to its environmental sustainability and cost-effectiveness. CNSL's various extraction techniques make it accessible and feasible. It also fosters a symbiotic relationship between the energy industry and the cashew nut sector, making it a valuable alternative fuel, contributing to environmental sustainability and economic efficiency.
On the basis of application, the automotive segment of the biodiesel market. Biodiesel is blended with conventional diesel in various ratios to balance its benefits while addressing challenges like cold flow and storage stability. Automotive engine manufacturers are adapting engines to accommodate biodiesel blends. Biodiesel's higher cetane number improves ignition quality, combustion efficiency, and engine performance. Technological advancements, such as biodiesel-compatible fuel injection systems, have enhanced biodiesel usage, making it more cost-effective and competitive with traditional fuels.
On the basis of region, Asia-Pacific region is most lucrative market which is expected to grow at a CAGR of 4.1% during the forecast period. It is mostly due to the presence of a large number of developing countries and government mandates concerning blending fuels in India, China, Indonesia, and other countries that have a positive impact on the market.
Competitive analysis and profiles of the major biodiesel market players such as Cargill Incorporated, Eni S.p.A., Bunge, Kolmar, Ital Bi Oil S.R.L., Bp Oil International Ltd., Tamoil Italia S.P.A., Italiana Petroli S.P.A., Esso Italiana S.R.L., Masol Continental Biofuel Srl, and Saras S.P.A. are focusing their investment on technologically advanced, cost-effective, and more secure products and solutions for various applications.
Key Market Trends
- On the basis of feedstock, the recycled cooking oil segment registered the highest accounting for nearly one-third of the market share and is projected to maintain the same during the forecast period.
- On the basis of application, automotive registered the highest market share accounting for more than two-fifths of the market share.
- On the basis of region, Europe dominates the highest market share accounting for nearly half of the market share in 2023.
Key Benefits For Stakeholders
- This report provides a quantitative analysis of the market segments, current trends, estimations, and dynamics of the biodiesel market analysis from 2022 to 2032 to identify the prevailing biodiesel market opportunities.
- The market research is offered along with information related to key drivers, restraints, and opportunities.
- Porter's five forces analysis highlights the potency of buyers and suppliers to enable stakeholders make profit-oriented business decisions and strengthen their supplier-buyer network.
- In-depth analysis of the biodiesel market segmentation assists to determine the prevailing market opportunities.
- Major countries in each region are mapped according to their revenue contribution to the global market.
- Market player positioning facilitates benchmarking and provides a clear understanding of the present position of the market players.
- The report includes the analysis of the regional as well as global biodiesel market trends, key players, market segments, application areas, and market growth strategies.
Additional benefits you will get with this purchase are:
- Quarterly Update and* (only available with a corporate license, on listed price)
- 5 additional Company Profile of client Choice pre- or Post-purchase, as a free update.
- Free Upcoming Version on the Purchase of Five and Enterprise User License.
- 16 analyst hours of support* (post-purchase, if you find additional data requirements upon review of the report, you may receive support amounting to 16 analyst hours to solve questions, and post-sale queries)
- 15% Free Customization* (in case the scope or segment of the report does not match your requirements, 15% is equivalent to 3 working days of free work, applicable once)
- Free data Pack on the Five and Enterprise User License. (Excel version of the report)
- Free Updated report if the report is 6-12 months old or older.
- 24-hour priority response*
- Free Industry updates and white papers.
Possible Customization with this report (with additional cost and timeline, please talk to the sales executive to know more)
- Manufacturing Capacity
- Capital Investment breakdown
- Investment Opportunities
- Upcoming/New Entrant by Regions
- Technology Trend Analysis
- Regulatory Guidelines
- Strategic Recommedations
- Additional company profiles with specific to client's interest
- Additional country or region analysis- market size and forecast
- Expanded list for Company Profiles
- Historic market data
- Import Export Analysis/Data
- Volume Market Size and Forecast
Key Market Segments
By Feedstock
- Others
- Recycled Cooking Oil
- Animal Fats
- Cashew Nutshell Liquid (CNSL)
- Distillation Residues
- Fatty Acids
- Palm Oil Mill Effluent (POME)
- Spent Bleaching Earth Oil (SBEO)
By Application
- Automotive
- Aviation
- Marine
- Power Generation
- Others
By Region
- North America
- U.S.
- Canada
- Mexico
- Europe
- Germany
- France
- Italy
- Spain
- UK
- Rest of Europe
- Asia-Pacific
- China
- Japan
- India
- South Korea
- Rest of Asia-Pacific
- LAMEA
- Brazil
- South Africa
- Saudi Arabia
- Rest of LAMEA
Key Market Players:
- Kolmar
- Saras S.P.A.
- Eco Fox S.r.l.
- Masol Continental SRL
- Esso Italiana S.r.l.
- Cargill Incorporated
- Ital Bi Oil S.R.L.
- Tamoil Italia S.p.A
- BP p.l.c.
- Bunge
- Italiana Petroli S.p.A.
- Eni S.p.A.
TABLE OF CONTENTS
CHAPTER 1: INTRODUCTION
- 1.1. Report description
- 1.2. Key market segments
- 1.3. Key benefits to the stakeholders
- 1.4. Research methodology
- 1.4.1. Primary research
- 1.4.2. Secondary research
- 1.4.3. Analyst tools and models
CHAPTER 2: EXECUTIVE SUMMARY
- 2.1. CXO perspective
CHAPTER 3: MARKET OVERVIEW
- 3.1. Market definition and scope
- 3.2. Key findings
- 3.2.1. Top impacting factors
- 3.2.2. Top investment pockets
- 3.3. Porter's five forces analysis
- 3.3.1. Low bargaining power of suppliers
- 3.3.2. Low threat of new entrants
- 3.3.3. Low threat of substitutes
- 3.3.4. Low intensity of rivalry
- 3.3.5. Low bargaining power of buyers
- 3.4. Market dynamics
- 3.4.1. Drivers
- 3.4.1.1. Energy Security Concerns
- 3.4.1.2. Environmental Regulations
- 3.4.1.3. Developments in Renewable Fuel Standards
- 3.4.2. Restraints
- 3.4.2.1. Engine and Fuel Efficiency
- 3.4.2.2. Initial Infrastructure Cost
- 3.4.3. Opportunities
- 3.4.3.1. Government support and incentives
- 3.4.1. Drivers
- 3.5. Value Chain Analysis
- 3.6. Key Regulation Analysis
CHAPTER 4: BIODIESEL MARKET, BY FEEDSTOCK
- 4.1. Overview
- 4.1.1. Market size and forecast
- 4.2. Recycled Cooking Oil
- 4.2.1. Key market trends, growth factors and opportunities
- 4.2.2. Market size and forecast, by region
- 4.2.3. Market share analysis by country
- 4.3. Animal Fats
- 4.3.1. Key market trends, growth factors and opportunities
- 4.3.2. Market size and forecast, by region
- 4.3.3. Market share analysis by country
- 4.4. Cashew Nutshell Liquid (CNSL)
- 4.4.1. Key market trends, growth factors and opportunities
- 4.4.2. Market size and forecast, by region
- 4.4.3. Market share analysis by country
- 4.5. Distillation Residues
- 4.5.1. Key market trends, growth factors and opportunities
- 4.5.2. Market size and forecast, by region
- 4.5.3. Market share analysis by country
- 4.6. Fatty Acids
- 4.6.1. Key market trends, growth factors and opportunities
- 4.6.2. Market size and forecast, by region
- 4.6.3. Market share analysis by country
- 4.7. Palm Oil Mill Effluent (POME)
- 4.7.1. Key market trends, growth factors and opportunities
- 4.7.2. Market size and forecast, by region
- 4.7.3. Market share analysis by country
- 4.8. Spent Bleaching Earth Oil (SBEO)
- 4.8.1. Key market trends, growth factors and opportunities
- 4.8.2. Market size and forecast, by region
- 4.8.3. Market share analysis by country
- 4.9. Others
- 4.9.1. Key market trends, growth factors and opportunities
- 4.9.2. Market size and forecast, by region
- 4.9.3. Market share analysis by country
CHAPTER 5: BIODIESEL MARKET, BY APPLICATION
- 5.1. Overview
- 5.1.1. Market size and forecast
- 5.2. Automotive
- 5.2.1. Key market trends, growth factors and opportunities
- 5.2.2. Market size and forecast, by region
- 5.2.3. Market share analysis by country
- 5.3. Aviation
- 5.3.1. Key market trends, growth factors and opportunities
- 5.3.2. Market size and forecast, by region
- 5.3.3. Market share analysis by country
- 5.4. Marine
- 5.4.1. Key market trends, growth factors and opportunities
- 5.4.2. Market size and forecast, by region
- 5.4.3. Market share analysis by country
- 5.5. Power Generation
- 5.5.1. Key market trends, growth factors and opportunities
- 5.5.2. Market size and forecast, by region
- 5.5.3. Market share analysis by country
- 5.6. Others
- 5.6.1. Key market trends, growth factors and opportunities
- 5.6.2. Market size and forecast, by region
- 5.6.3. Market share analysis by country
CHAPTER 6: BIODIESEL MARKET, BY REGION
- 6.1. Overview
- 6.1.1. Market size and forecast By Region
- 6.2. North America
- 6.2.1. Key market trends, growth factors and opportunities
- 6.2.2. Market size and forecast, by Feedstock
- 6.2.3. Market size and forecast, by Application
- 6.2.4. Market size and forecast, by country
- 6.2.4.1. U.S.
- 6.2.4.1.1. Market size and forecast, by Feedstock
- 6.2.4.1.2. Market size and forecast, by Application
- 6.2.4.2. Canada
- 6.2.4.2.1. Market size and forecast, by Feedstock
- 6.2.4.2.2. Market size and forecast, by Application
- 6.2.4.3. Mexico
- 6.2.4.3.1. Market size and forecast, by Feedstock
- 6.2.4.3.2. Market size and forecast, by Application
- 6.3. Europe
- 6.3.1. Key market trends, growth factors and opportunities
- 6.3.2. Market size and forecast, by Feedstock
- 6.3.3. Market size and forecast, by Application
- 6.3.4. Market size and forecast, by country
- 6.3.4.1. Germany
- 6.3.4.1.1. Market size and forecast, by Feedstock
- 6.3.4.1.2. Market size and forecast, by Application
- 6.3.4.2. France
- 6.3.4.2.1. Market size and forecast, by Feedstock
- 6.3.4.2.2. Market size and forecast, by Application
- 6.3.4.3. Italy
- 6.3.4.3.1. Market size and forecast, by Feedstock
- 6.3.4.3.2. Market size and forecast, by Application
- 6.3.4.4. Spain
- 6.3.4.4.1. Market size and forecast, by Feedstock
- 6.3.4.4.2. Market size and forecast, by Application
- 6.3.4.5. UK
- 6.3.4.5.1. Market size and forecast, by Feedstock
- 6.3.4.5.2. Market size and forecast, by Application
- 6.3.4.6. Rest of Europe
- 6.3.4.6.1. Market size and forecast, by Feedstock
- 6.3.4.6.2. Market size and forecast, by Application
- 6.4. Asia-Pacific
- 6.4.1. Key market trends, growth factors and opportunities
- 6.4.2. Market size and forecast, by Feedstock
- 6.4.3. Market size and forecast, by Application
- 6.4.4. Market size and forecast, by country
- 6.4.4.1. China
- 6.4.4.1.1. Market size and forecast, by Feedstock
- 6.4.4.1.2. Market size and forecast, by Application
- 6.4.4.2. Japan
- 6.4.4.2.1. Market size and forecast, by Feedstock
- 6.4.4.2.2. Market size and forecast, by Application
- 6.4.4.3. India
- 6.4.4.3.1. Market size and forecast, by Feedstock
- 6.4.4.3.2. Market size and forecast, by Application
- 6.4.4.4. South Korea
- 6.4.4.4.1. Market size and forecast, by Feedstock
- 6.4.4.4.2. Market size and forecast, by Application
- 6.4.4.5. Rest of Asia-Pacific
- 6.4.4.5.1. Market size and forecast, by Feedstock
- 6.4.4.5.2. Market size and forecast, by Application
- 6.5. LAMEA
- 6.5.1. Key market trends, growth factors and opportunities
- 6.5.2. Market size and forecast, by Feedstock
- 6.5.3. Market size and forecast, by Application
- 6.5.4. Market size and forecast, by country
- 6.5.4.1. Brazil
- 6.5.4.1.1. Market size and forecast, by Feedstock
- 6.5.4.1.2. Market size and forecast, by Application
- 6.5.4.2. South Africa
- 6.5.4.2.1. Market size and forecast, by Feedstock
- 6.5.4.2.2. Market size and forecast, by Application
- 6.5.4.3. Saudi Arabia
- 6.5.4.3.1. Market size and forecast, by Feedstock
- 6.5.4.3.2. Market size and forecast, by Application
- 6.5.4.4. Rest of LAMEA
- 6.5.4.4.1. Market size and forecast, by Feedstock
- 6.5.4.4.2. Market size and forecast, by Application
CHAPTER 7: COMPETITIVE LANDSCAPE
- 7.1. Introduction
- 7.2. Top winning strategies
- 7.3. Product mapping of top 10 player
- 7.4. Competitive dashboard
- 7.5. Competitive heatmap
- 7.6. Top player positioning, 2022
CHAPTER 8: COMPANY PROFILES
- 8.1. Kolmar
- 8.1.1. Company overview
- 8.1.2. Key executives
- 8.1.3. Company snapshot
- 8.1.4. Operating business segments
- 8.1.5. Product portfolio
- 8.2. Ital Bi Oil S.R.L.
- 8.2.1. Company overview
- 8.2.2. Key executives
- 8.2.3. Company snapshot
- 8.2.4. Operating business segments
- 8.2.5. Product portfolio
- 8.3. Cargill Incorporated
- 8.3.1. Company overview
- 8.3.2. Key executives
- 8.3.3. Company snapshot
- 8.3.4. Operating business segments
- 8.3.5. Product portfolio
- 8.3.6. Business performance
- 8.3.7. Key strategic moves and developments
- 8.4. BP p.l.c.
- 8.4.1. Company overview
- 8.4.2. Key executives
- 8.4.3. Company snapshot
- 8.4.4. Operating business segments
- 8.4.5. Product portfolio
- 8.5. Eni S.p.A.
- 8.5.1. Company overview
- 8.5.2. Key executives
- 8.5.3. Company snapshot
- 8.5.4. Operating business segments
- 8.5.5. Product portfolio
- 8.5.6. Business performance
- 8.6. Eco Fox S.r.l.
- 8.6.1. Company overview
- 8.6.2. Key executives
- 8.6.3. Company snapshot
- 8.6.4. Operating business segments
- 8.6.5. Product portfolio
- 8.7. Tamoil Italia S.p.A
- 8.7.1. Company overview
- 8.7.2. Key executives
- 8.7.3. Company snapshot
- 8.7.4. Operating business segments
- 8.7.5. Product portfolio
- 8.8. Italiana Petroli S.p.A.
- 8.8.1. Company overview
- 8.8.2. Key executives
- 8.8.3. Company snapshot
- 8.8.4. Operating business segments
- 8.8.5. Product portfolio
- 8.9. Esso Italiana S.r.l.
- 8.9.1. Company overview
- 8.9.2. Key executives
- 8.9.3. Company snapshot
- 8.9.4. Operating business segments
- 8.9.5. Product portfolio
- 8.9.6. Key strategic moves and developments
- 8.10. Saras S.P.A.
- 8.10.1. Company overview
- 8.10.2. Key executives
- 8.10.3. Company snapshot
- 8.10.4. Operating business segments
- 8.10.5. Product portfolio
- 8.10.6. Business performance
- 8.11. Bunge
- 8.11.1. Company overview
- 8.11.2. Key executives
- 8.11.3. Company snapshot
- 8.11.4. Operating business segments
- 8.11.5. Product portfolio
- 8.11.6. Business performance
- 8.12. Masol Continental SRL
- 8.12.1. Company overview
- 8.12.2. Key executives
- 8.12.3. Company snapshot
- 8.12.4. Operating business segments
- 8.12.5. Product portfolio
